
Abstract
In light of the gravity of environmental issues, this study investigates the influence of competitive advantage and stakeholder pressure on voluntary environmental disclosures, together with the “certification” mediating variable. The research questions and hypotheses were developed based on the essence of stakeholder and legitimacy theory, within the compass of the resource-based view. Data were collected from numerous listed manufacturing organizations and analyzed following the deductive approach. Structural equation modeling was used to test the hypotheses. The results show that competitive advantage influences and smoothens the attainment of environmental certificates, leading to an impression on voluntary environmental disclosures. The evidence from the study also demystifies the dominance of competitive advantage over environmental disclosures. Furthermore, the associated effect of certification upon environmental disclosure is also established and found worthy. Other factors were not found to be significant. Finally, the study also provides various insightful policy suggestions to the wide range of stakeholders.
Plain Language Summary
The main objective of this study is to find out the motivation of voluntary environmental disclosure. This study also justifies the role of authorized certifications as a mediating variable between environmental disclosure and motivation factors. According to the stakeholder theory, legitimacy theory and resource-based view, this paper identified two motivation factors such as pressures and competitive advantage. Applying structural equation model on data set gathered from the listed Bangladeshi companies, the study revealed competitive advantage as a significant motivation factor of environmental disclosure while stakeholder’s pressure proved insignificant. Moreover, the study also found significant relationship of acquiring certificates from authorized organisations to receive competitive advantage.
Introduction
Currently, global warming and climate change issues are prime concerns and challenges for world leaders, with their impact crossing frontiers (Kyoto Protocol, 1997; Paris Agreement, 2016, https://www.un.org/en/sections/issues-depth/climate-change/). In order to control pollution and encourage conservation, all stakeholders are putting pressure on the polluters responsible. Consequently, all stakeholders in society need to consider the facts and adopt environmental safety actions according to their capacity and affordability. In order to legitimate pollution-free activities with society, companies use annual reports as a valid medium. Subsequently, the significance of environmental reporting is growing day by day (Ismail & Rahman, 2016). Such reporting is mandatory in many developed countries. For instance, Australia introduced mandatory environmental guidelines in 1998 (Frost, 2007), Denmark did so in 1995 (Holgaard & Jørgensen, 2005), Spain in 2001 (Criado-Jiménez et al., 2008), and France in 2013 (Kaya, 2016). The environmental disclosure practices of developing countries are also attempting to follow those of developed countries. Despite financial reporting being mandatory, few developing countries disclose environmental information voluntarily; for example, Malaysia (Sumiani et al., 2007), Bangladesh (Chowdhury et al., 2020), and Turkey (Akbas & Canikli, 2014). Many studies have been conducted to explore the rate of environmental exposure, the nature of environment- related facts, and the control factors of green reporting (Akbas & Canikli, 2014; Amran et al., 2015; Andrikopoulos & Kriklani, 2013; Arrive & Feng, 2018; Baalouch et al., 2019; Dinca et al., 2019; Giannarakis et al., 2016; Hassan & Ibrahim, 2012; Kaymak & Bektas, 2017; Khaireddine et al., 2020; Kuo et al., 2012; Meng et al., 2014; Nurhayati et al., 2016; Odoemelam & Okafor, 2018; Pucheta-Martínez & López-Zamora, 2018; Sobhani et al., 2009; Suttipun & Stanton, 2012; Vogt et al., 2017). In addition, voluntary environmental disclosure has been explained by different theories, such as stakeholder theory (Elijido-Ten, 2009, 2011; Gallego-Alvarez et al., 2017; Husillos & Álvarez-Gil, 2008), institutional theory (Higgins & Larrinaga, 2014), and legitimacy theory (Mousa & Hassan, 2015; Nurhayati et al., 2016).
Research related to the motivational factors of the environmental disclosure of developing countries is limited to company characteristics and based on secondary data (Akbas & Canikli, 2014; Balasubramanian & Shukla, 2020; Chowdhury et al., 2020; da Silva Monteiro & Aibar-Guzmán, 2010; Elshabasy, 2018; Hsiung et al., 2012; Kouloukoui et al., 2019). However, many researchers have attempted to clarify the facts of environmental disclosure (Albertini, 2014; Aldrugi & Abdo, 2014; de Villiers & van Staden, 2006; Huang & Kung, 2010). Most previous studies have focused on perceived pressures from stakeholders for environmental disclosure. These pressures are of two types: internal and external. Internal pressures include companies’ internal stakeholders and the use of resources to overcome the environmental challenges. On the other hand, external pressures are from outside stakeholders such as customers, suppliers, financial institutions, and competitors (Huang & Kung, 2010), who encourage environmentally-friendly products and processes.
Since developed countries have mandatory environmental disclosure rules, they consider internal and external pressures mainly within the context of the best use of resources (product innovation, process innovation etc.). However, in the case of voluntary disclosure, it is assumed that competitive advantage is a more significant factor than stakeholder pressure. It is evident that many companies have acquired different types of environmental certification to gain more advantage over their competitors (Anderson et al., 1999; M. Delmas, 2001; Gavronski et al., 2008). In addition, a certified company discloses more environmental information than one without certification (Chaklader & Gulati, 2015).
Against this backdrop, it is projected that the motivation for manifestations of Eco friendliness in developing economies is the acquisition of competitive advantage, as well as the enhancement of company reputation. At the same time, by acquiring a certificate, companies assume that they have satisfied stakeholders’ demands. In order to establish the real facts behind voluntary environmental disclosure in an emerging economy, this article explores the motivation for corporate ecological reporting in Bangladesh. The paper also examines the relationship among environmental certification, perceived pressures and environmental disclosure.
In spite of its low industrialization, it is suffering from serious climate change effects due to its geographical location. According to the IPCC fifth Assessment Report, sea-levels rose by 17 to 21 cm from 1901 to 2010 and due to global warming ice melt will mean a large part of the globe, including Bangladesh, will be under water within the next 30 years (Department of Environment, 2017). The Bangladesh Economic Survey-2014 report highlights the harmful impacts of climate change. The Global Climate Risk Index (GCRI, 2018) report published by “German Watch” identified Bangladesh as sixth most at risk country due to climate change (Department of Environment, 2017). Recently, Bangladesh has been announced as a middle-income country by the UN and declared as a developing country. Its economic and corporate culture is quite different from other countries. Therefore, this study only covers listed manufacturing companies in Bangladesh. In addition, Brammer and Pavelin (2008) demonstrate that high quality disclosure is found in sectors which are most closely related to environmental concerns. Ahmadi and Bouri (2017) found that healthcare, gas, and oil businesses disseminate more environmental information than other industries, while Iatridis (2013) demonstrated that high quality disclosers include the beverage and chemical sectors, food producers, forestry and paper, and industrial metals and mining. On the other hand, service-related sectors are less harmful to the environment than manufacturing ones.
However, this study contributes to the existing theoretical and empirical literature by many ways. Firstly, it underpins ongoing debates of the role of certification on environment disclosures, competitive advantages, and stakeholders’ pressure. Secondly, this study augments the findings of the existing studies for example, Anderson et al. (1999), M. Delmas (2001), Gavronski et al. (2008), among others. Thirdly, this study also uses long-span factors for constructing competitive advantage and stakeholder’s pressure. Finally, it enables the policymakers’ to grab the importance of motivational factors of environmental disclosures concerning the role of certification in the setting of emerging economy.
The remainder of the study is organized as follows. Section 2 highlights the theoretical background of the study. Section 3 discusses the relevant previous studied and development of hypotheses that underline the paper’s analysis. Section 4 presents the materials and methods. Section 5 describes the empirical results. Finally, Section 6 concludes the paper.
Theoretical Background to the Study
Voluntary environmental disclosure has been rapidly growing due to legitimacy and stakeholder pressures (Brammer & Pavelin, 2006; Dawkins & Fraas, 2011). According to Freeman, stakeholders are “any group or individual who can affect or is affected by the achievement of the organization’s objectives” (Zuraidah Raja Mohd Rasi et al., 2014). In another study, Carroll and Buchholtz (1996) describe stakeholders as “any individual or group who can affect or is affected by the actions, decisions, policies, practices, or goals of the organization.” Stakeholder theory considers both the internal and external parties of a business. According to the theory, decisions made by organizations depend on the interests of stakeholders. M. A. Delmas (2002) explains that stakeholder theory posits that organizations perform in order to maximize the benefits and amenities of participants (government, financiers, political groups, consumers, dealers, communities, trade associations, and workforces). Freeman et al. (2007) explain that the core notion of stakeholder theory is to direct and integrate the connections and well-being of owners, clientele, traders, personnel and other alliances in a pathway that promises long-lasting advancement for the company. The theory explains the steps taken by management to meet the demands of stakeholders (Cong & Freedman, 2011). It is also noteworthy that civic opinions are characterized by their recent expansion on the internet through blogs, discussion forums, video sharing, communities, and virtual worlds, which generate new potential for individuals (Miliband, 2007). Based on J. Liu et al. (2010) and X. Liu et al. (2010), stakeholder power is presented in Table 1.
Stakeholders Power.

Source. X. Liu et al. (2010)/Journal of Cleaner Production 18 (2010).
Therefore, companies’ environmental actions are dramatically increasing and they are required to disclose their actions to satisfy stakeholders’ demands (Elijido-Ten et al., 2010; Moroney et al., 2012).
On the other hand, the resource-based view (RBV) highlights a business’s assets and know-how as the root of competitive benefit. According to RBV, companies attain viable advantage through the creation of wealth that is worthy, uncommon, non-substitutable and unique (Barney, 1991). Nevertheless, funds will be useless unless the firm accumulates, assimilates and accomplishes these packages of assets in executing its strategic actions (Russo & Fouts, 1997). The capability of an enterprise to customize properties to make economic gains is perceived as the capability to shape diverse supplementary assets in a coordinated fashion through managerial procedures in order to acquire the anticipated competitive leads. In fact, the capabilities of a firm support in instigating its preferred policies which differ from those of other organizations, as different establishments have different sets of resources and capabilities (Barney, 1991). Furthermore, RBV recommends that the prime duty of a firm is to use its available and acquired resources in a distinct manner, so that a competitive gain can be established in line with the firm’s expectations. Companies disclose their desires through annual reports to gain competitive advantage (Ling & Mowen, 2013; Yu et al., 2017).
Suchman (1995) demonstrated that “legitimacy is a generalized perception or assumption that the activities of an organization are desirable, proper, or appropriate within some socially constructed system of norms, values, beliefs and definitions.” From an organizational stance, legitimacy is an operational resource that organizations quote develop from their society or cultural environment in order to achieve their objectives. Legitimacy can produce unparalleled benefits for organizations. Companies repeatedly attempt to accomplish achieve legitimacy as it supports the sustained influx of investment, labor, and market reputation, and offers executives a level of independence to choose new business or business operation processes (Neu et al., 1998). Legitimacy theory can be seen through voluntary corporate social and ecofriendly reporting in response to social, economic and political factors, and it legitimizes administration and its actions. In the short run, organizations endeavor to establish the coexistence between their social value and society; however, different communities often have different interpretations of legitimate corporate behavior (C. M. Deegan, 2019). Therefore, companies cannot do “right” or “wrong,” but society has the right and privilege to evaluate them (Christopher & Gattorna, 2005).
This paper therefore aims to justify the connection between pressures to be environmentally friendly and the reporting of environment-related information in terms of legitimacy. Moreover, it focuses on the relationship between the level of environmental certification, perceived pressures, and environmental disclosure.
Literature Review
Previous Research on Environmental Reporting
Research on environmental reporting is not new. Wiseman (1982) evaluated the level of the environmental exposure of US corporations. Based on 18 selected environmental items in relation to 26 environmentally-sensitive industries, Wiseman concluded that numerical measures were not being voluntarily reported. C. Deegan and Gordon (1996) documented environmental research findings from 197 sample companies in 50 different industries in Australia. Their results show that only 36% of the companies made voluntary environmental reporting; 14% of the sample disclosed negative information; and that environmentally-sensitive companies disclosed more positive environmental information than others. Their paper also highlighted that environmental disclosures were increasing due to the growth of environmental awareness during the period 1980 to 1990. Cowan and Gadenne (2005) examined the features of voluntary and mandatory environmental disclosure among Australian companies and found that companies were not interested in releasing conservation information in a voluntary framework. Their study suggests mandatory environmental guidelines as a possible way of counterbalancing the willful manifestation of disclosures. Frost (2007) justified mandatory regulatory requirements by demonstrating the significant increase in negative environmental disclosures by Australian companies. Beck et al. (2010) conducted research by considering 14 pairs of UK and German companies, revealing that narrative disclosure was more than numeric and that little disclosure contained comparative numerical information. Cho and Roberts (2010) explained environmental disclosure through legitimacy theory and revealed that inferior environmental performers demonstrated more optimistic and less certain environmental information than their superior counterparts (Cho et al., 2010). The study of Sen et al. (2011) indicated that the quantity of environment data and the figures of Indian core industries differed across industries and companies, and that the information presented in annual reports was more descriptive than numerical. A large number of environmental reporting studies were conducted by Chatterjee and Zaman Mir (2008), Tilt (2001), Siddique (2015), Plumlee et al. (2015), C. Deegan and Rankin (1996), Majumder et al. (2019), and Anwar et al. (2020), the outcomes of which mainly concentrated on the frequency and types of disclosure.
Previous Research on the Motivational Factors of Environmental Disclosure
Many studies have focused on the company attributes which are crucial for environmental disclosure. Cormier et al. (2005) found that factors such as risk, ownership, fixed asset age, firm size, and routine determined the frequency of green reporting by German firms. Similarly, Iatridis (2013) demonstrated that company attributes, such as large size, the need for capital, profitability and capital spending, had a positive association with the quality of environmentally-friendly disclosure in Malaysia. In a study of 450 large firms in the UK, Brammer and Pavelin (2008) revealed that high quality environmental figures were predominantly associated with larger firms. Lu and Abeysekera (2014) indicated that corporate social and environmental exposures were positively linked with firm size, profitability, and industry classification in the case of Chinese listed firms. Andrikopoulos and Kriklani (2013) found that the environmental reporting of listed companies in Denmark depended on firm size, financial leverage, the market value to book value ratio, and profitability. Lee (2017) examined the disclosure of 55 Australian metal and mining companies and found that the numerical and descriptive nature of environmental reporting was significantly correlated with firm size (market capitalization). Based on a study of listed companies in France, Ahmadi and Bouri (2017) suggested that ecofriendly data dissemination varied in line with the financial attributes of the company; for example, firm size, the need for capital, profitability and capital spending. Rupley et al. (2012) suggested that the essence and degree of voluntary environmental disclosure (VED) were positively connected with board characteristics of independence, diversity, and expertise. Based on 100 US best corporate citizens, Mallin et al. (2013) showed that the stakeholder orientation of corporate governance was positively allied with social and environmental disclosure (SED).
On the other hand, few studies have highlighted that environmental disclosure depends on the pressure of stakeholder groups. Huang and Kung (2010) studied the disclosure of Taiwanese listed companies, with the results showing that the frequency of green disclosure was significantly influenced by exterior stakeholder groups, such as the government, debtors, and consumers, and by internal groups, such as stockholder and staffs, and those stakeholders levy extra pressures on firms to release ecological information. In addition, intermediary parties such as environmental protection enterprises and accounting firms stimulate management choices greatly concerning their environmental reporting approaches. Cormier et al. (2005) demonstrated that the environmental disclosure levels of German firms were consistent with institutional theory. Rupley et al. (2012) proposed that the contents of voluntary environmental disclosure (VED) was completely linked to environmental media coverage, negative environmental media and institutional stakeholders. Lu and Abeysekera (2014) indicated that the performance of different powerful stakeholders in China was weak in disclosing social and environmental information, but that owners played a positive role in corporate social and environmental manifestations, and that creditors affected corporate environmental performance-related dissemination. According to Acar and Temiz (2020), environmental performance is the prime motivation for environmental disclosure. Their paper also indicates that good performers disclose more information in line with economic theory.
Environmental Disclosure in Bangladesh
Research on environmental disclosure practices in Bangladesh is growing. A. R. Belal (1997) conducted a survey to establish the level of environmental disclosure in Bangladeshi companies, reporting that only three (6%) companies out of 50 had released conservational evidence in their annual reports. It was found that most information was given in the chair’s statement or in the director’s report, focusing on positive information, but without numerical details. Imam (2000) examined the CSR practices of corporations and revealed that only nine companies (22.5%) out of 40 had disclosed environmental issues. These were limited to environmental safety, contamination control, the planting of trees and other such matters. Similarly, Shil and Iqbal (2005) conducted research to ascertain companies’ environmental disclosure, analyzing 117 annual reports from different Bangladeshi organizations. Among these, only 13 (11%) companies had disclosed descriptive environmental information. M. Hossain et al. (2006) found that industry type, external sources of funds (debenture) and profitability were primarily correlated with substantial levels of CSED. Bose (2006) investigated the reporting status of 11 companies working under Petrobangla which operated in oil and gas exploration, production, transmission, distribution, conversion and development and the marketing of coal and hard rock. The results showed that the nature of the measurements was qualitative, not quantitative. The reasons for this included poor legal requirements, deficiency of resources, absence of knowledge, poor performance, and immoral promotion (A. Belal & Cooper, 2007; Rahman & Muttakin, 2005). Afzal Ahmad (2012) conducted an analysis of the environmental disclosure practice of 40 Dhaka Stock Exchange (DSE) listed companies. Satisfactory disclosure items were maintained by the pharmaceuticals industry, while mandatory disclosure requirements of energy expenditure were disclosed by all the sample companies. The other sectors and other environment-related reporting practices were very poor, while the available voluntary information was qualitative and positive in nature. Sobhani et al. (2012) investigated the environmental reporting status of the banking sector and revealed that the annual reports disclosed more information than the websites for the listed banks. This might have been because of difficulties in internet access for local stakeholders. The study also demonstrates that all the listed banks disclosed sustainability information in their annual reports and on their corporate websites in a secret mode. Among the disclosed items, listed banks preferred social information disclosure, followed by economic and environmental information. Their study further highlights that there was no substantial difference in disclosure between different bank generations and systems. This paper suggests extensive research on banks individually to explore the tendency and development of CSD, and on managerial insights regarding environmental disclosure, since these provide a broad outlook of CSD, rather than an in-depth analysis of a single bank. I. Hossain and Chowdhury (2014) examined the current status of the environmental reporting of listed companies in Bangladesh, finding that only 33 companies (46.48%) had conveyed at least one line of eco-friendly information in the annual report, and that the majority of the information was descriptive in nature. Chowdhury et al. (2020) examined the features of corporate environmental disclosure in Bangladesh and found that three types of disclosure, general, moderate and extensive, were significant with respect to business size and profitability.
Therefore, it is clear that studies on corporate environmental disclosures in Bangladesh are mainly confined to determination of their current status and the moderation effect of company attributes. Consequently, this paper aims to establish the perceived pressure regarding environmental tasks and the consequences of corporate environmental disclosure in Bangladesh. It also investigates the role of the level of environmental certification under a voluntary disclosure framework.
Hypothesis Development
Stakeholder pressure is often anticipated as a commanding external aspect of environmental management operation (Dai et al., 2015; M. A. Delmas & Toffel, 2008; Sarkis et al., 2011). M. A. Delmas (2002) explains that in line with stakeholder theory, organizations perform to maximize the benefits and welfare of stakeholders (regulators, financiers, political groups, clients, suppliers, communities, trade associations, and workforce). Handfield et al. (2005) indicated collaboration to be a primary force of environmental sustainability. In practice, environmental topics are generally influenced by numerous dynamics; for example, packaging and labels (Hyllegard et al., 2012). Therefore, it is advocated that the viewpoints of suppliers should be considered in investigating environmental issues. Zuraidah Raja Mohd Rasi et al. (2014) revealed that suppliers’ interaction simultaneously influences firm’s product and process-based environmental changes. Vachon and Klassen (2008) reveal that without collaboration and knowledge transfer with suppliers, environmental sustainability strategies are difficult to implement. Green, Zelbest, Meacham et al. (2012) demonstrated a positive relationship between partnerships with dealers and environmental performance. As resource interdependence is a foundation of stakeholder theory (Pfeffer & Salancik, 2003), and as such interdependence occurs between focal firms and their customers, investigators have indicated that customer can influence an organization’s policymaking using numerous tactics (Frooman, 1999). Zhu and Sarkis (2007) revealed that pressure from customers leads to innovative environmental practice, while Vachon and Klassen (2008) claim that alliances with consumers are likely to be encouraged and steered by buyers’ knowledge related to the conservation philosophy of the organization. An important element of the market environment embraces uninterrupted and close surveillance of competitors’ actions and plans (Narver & Slater, 1990). Recent pragmatic investigations in the US have also scrutinized the extent to which focal firms apply environmental management in response to their opponents’ ecological controlling efforts (Dai et al., 2015; Hofer et al., 2012). King et al. (2005) argue that the inclination of foreign suppliers should be accredited by ISO 14000. Hence, suppliers are likely to establish the basis of an environmental management system, which will strengthen their environmental excellence (King et al., 2005; Melnyk et al., 2003). In order to satisfy the demands of stakeholders, firms use their media (annual reports, websites) to make disclosures. This will bring immense benefits to companies by legitimizing their environmental activities to society (Cho & Patten, 2007). As a result, it is assumed that companies engage in environmental activities due to stakeholder pressures and disclose more information to meet the demand. Moreover, companies attempt to acquire environment-related certificates to legitimize and disclose additional environment-related material in line with the requirements of the certificate. Therefore, the following hypotheses are proposed:
H1: Corporations release extra environmental information due to stakeholder pressures.
H2: Corporations adopt certificates due to Stakeholders’ pressure and disclose additional environmental information at the presence of authorized certificates.
The resource-based view explains that capable companies exploit their resources to overcome the challenges of environmental threats and dangers through innovation and by making differences in product or distribution channels. Florida (1996) and Hart (1995) state that firms can use their resources to redesign production processes, recycle manufacturing by-products and innovate green manufacturing processes. Green product innovation makes an impression on firms’ brands and on competitive gains (Chang & Fong, 2010; Chen, 2008; Chen et al., 2006; Kam-Sing Wong, 2012). R.-J. Lin et al. (2014) also found a positive relationship between green product innovation and environmental performance in their empirical study of the automobile industry (Chan et al., 2016; R.-J. Lin et al., 2013). Firms can generate competitive advantage in many ways, such as energy efficiency (Leszczynska, 2010), material management (Kritchanchai, 2004; Proctor, 2005), green human resources (Som, 2003), or by using green technology (Dimitrova et al., 2007). These competitive advantage factors lead to improved environmental performance (Jabbour & Jabbour, 2009). On the other hand, if firms are ISO 14001 certified, this entails that they are conscious of environmental issues through the adoption of an environmental management system. The empirical results of some studies show that environmental management certified companies perform better environmentally (Arimura et al., 2008; Dasgupta et al., 2000; Potoski & Prakash, 2005). Companies disclose such actions to legitimize themselves in society and acquire competitive advantage (Ling & Mowen, 2013).
Therefore, companies engage in environmental issues to make the best use of resources and disclose more information in order to gain competitive advantage. Moreover, some companies acquire environment-related certificates as tools for competitive advantage and to disclose more information in line with the requirements of the certificate.
H3: Companies release more environmental information in order to acquire competitive advantage.
H4: Companies adopt certificates due to competitive advantage factors and release more environmental information at the presence of a certificate.
Materials and Methods
The paper used structural equation modeling (SEM) to establish the influence of perceived pressures and motivational factors on the level of corporate environmental disclosure, and the mediation effect of different authorized environmental certificates on this level. In order to process and analyze the gathered data, the study used SPSS, AMOS, and STATA software. In fact, the authors used these different softwares as they fit for data screening, confirmatory factor analysis and structural equation modeling respectively.
Sample
Listed Bangladeshi manufacturing companies were employed as the sample. Bangladesh is a small but highly populated country [Transferred to Introduction section]. Accordingly, this study used 132 samples out of the 180 listed manufacturing units in Bangladesh, equivalent to 73% of the population.
The study population consisted of listed manufacturing companies in Bangladesh. According to data accessed from the listed companies’ Directory of the Dhaka Stock Exchange (2018), the listing comprises 30 banks, 47 insurance companies, 23 financial institutions, and 240 mutual fund and treasury bond companies, with the remaining 181 companies being in the industrial goods sector.
Although there are more non-manufacturing companies than manufacturing ones, there were various reasons for considering manufacturing companies as the population. First, such companies contaminate the environment more than non-manufacturing ones, in different dimensions such as instance air, water, land, sound, and wastage. Second, manufacturing companies deal with dangerous chemicals. Third, manufacturing companies consume more energy, and fourth, pollution prevention technology and equipment are expensive. Fifth, according to the Department of the Environment, Bangladesh categorizes all manufacturing industries as red or orange, which indicate they are very dangerous or dangerous for the environment respectively. Therefore, this study considered manufacturing companies as the study population. Moreover, it is more important to assess which manufacturing firms have developed and implemented pollution reduction policies, and why.
Banks and insurance companies play a vital role in engaging manufacturing units in sustainable programs. This study acknowledges their contributions by including them as a pressure group. On the other hand, each bank and insurance company have a large number of branches, which would be too difficult to assess in a whole. Therefore, the study only focuses on business manufacturing organizations that are listed on the DSE and whose corporate annual reports are published and available. It should be noted that the tannery industry is the most polluting manufacturing sector. According to a government regulation directive, currently all tannery industries are asked to transfer their operations to Savar, Dhaka from Hazaribag, to allow the construction of a central effluent treatment plant (ETP). Consequently, some of the tannery companies are not operating at the moment and their senior executives have no interest in participating. Therefore, this industry was excluded from the study.
Purposive sampling techniques were employed because of unequal representation of companies from various sectors. Moreover, data unavailability was also a problem. Etikan et al. (2016) explains that the purposive sampling technique concentrates on people with particular features who can provide information on a research subject. This study had certain particular criteria; for example, one aim is to assess international pressures. To meet this requirement, most textile and pharmaceutical companies were considered. However, the criteria include the exclusion of companies delisted from the Dhaka Stock Exchange (DSE), exclusion of those with incomplete annual reports (in which only financial performance is presented and reported), and the exclusion of companies whose shares were not listed on the DSE in 2018. More companies were selected from the textile, pharmaceutical, and engineering sectors since the number of listed companies was sufficient and their current audited annual reports were also available. However, we have considered significant number of companies from the food and allied sectors, and fuel and power sectors. The study also selected a few companies from the remaining sectors, such as cement, ceramics, paper, and jute, which are not representative of their overall sectors. The list of sample companies is attached in Appendix 1.
Since both primary and secondary data were employed, the same samples were used as respondents. Another important factor in using the purposive sampling technique is to be able to reach companies easily. Therefore, the convenience sampling technique was also considered for the sample selection. According to Etikan et al. (2016), convenience sampling involves selecting individuals who are easily accessible, available at a given time and willing to participate in the survey.
Data Measurement
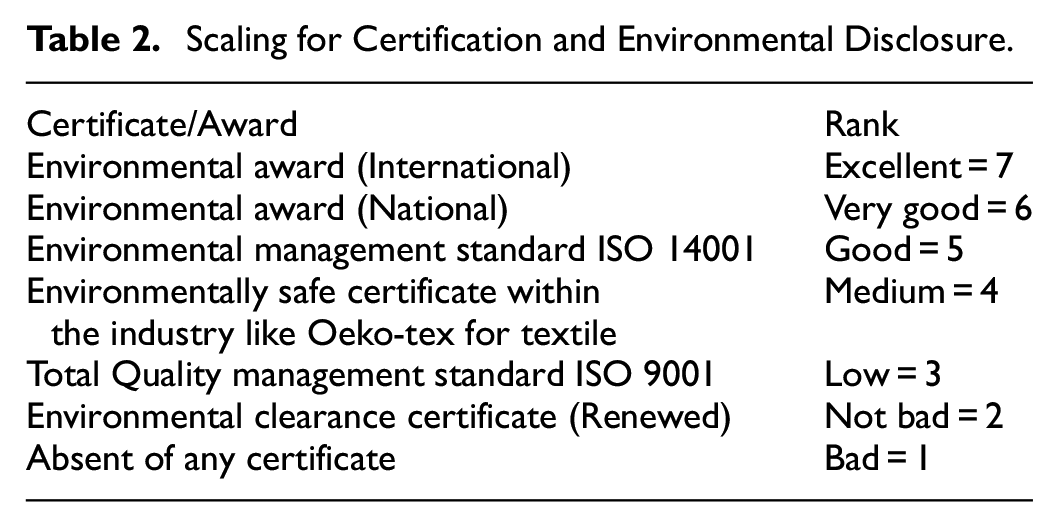
In this paper, two types of data, primary and secondary, were used. A questionnaire was employed to ascertain the level of perceived pressures and motivation to engage in environmental activities. A 7-point Likert scale was utilized as the measurement tool, from 1, denoting “strongly disagree” to 7, “strongly agree.” The scaling for certification and environmental disclosure are shown in Table 2.
Scaling for Certification and Environmental Disclosure.
The disclosure index for each firm would be the total number of items, divided by the total number of relevant items expected to be disclosed. The total disclosure score thus arrived at for a company is as follows:

where DIj is the disclosure index for the jth company; nj is the number of items that are relevant for the jth firm; Xit = 1 if the ith (relevant) item is disclosed by company j; Xit = 0 if the ith (relevant) item is not disclosed. Therefore, 0 ≤ DIj ≤ 1. DIj = 1 indicates 100% disclosure.
Questionnaire
The study created an exceptional databank that involved primary data from executives accountable for the environmental initiatives of firms and secondary data from annual reports. The use of both types of data allows researchers to validate previous empirical work and to offset the effects of common method variance (O’Sullivan & Abela, 2007; Roth, 1992). The survey data were collected from March to November 2018. Before starting the survey, several academics from the field of operations management (specialized in environmental management) studied the initial measurement scales and gave feedback. The researcher then held a pilot test with several industrial managers (from different sectors such as textiles, pharmaceuticals, engineering, cement, tanneries, food, and fuel) to ensure that the questions were clear, significant, pertinent, and easy to interpret (O’Leary-Kelly & J. Vokurka, 1998). After the test, some statements in the questionnaire were revised and the language changed and scaled (Appendix 2).
After removing incomplete replies, the survey sample size was 132; the effective response rate of 73% was comparable to that of other survey-based environmental management studies, for example, Chiou et al. (2011) and Green, Zelbst, Meacham, et al. (2012). The sample size (n = 132) was also comparable to that of other studies; for example, Hsu et al. (2016) with n = 125, Tachizawa et al. (2015) with n = 71, and Vachon and Klassen (2008) with n = 84.
Environmental Disclosure Index (EDS)
It was necessary to determine the presence of environmental and sustainability information from the selected sample companies’ annual reports (Appendix 3). To establishing the scores for the development of the index, there are mainly two approaches, namely the adjusted weighted index and unweighted index. The most commonly used approach is the unweighted index, which follows a dichotomous procedure in which an item scores one if it is disclosed, zero if it is not disclosed, and NA if it is not applicable (e.g., Abdel Karim, 1995; Adelopo, 2011; Ahmed & Dey, 2011; Akhtaruddin et al., 2009; Ashcroft, 2012; Cooke, 1989; M. Hossain et al., 1994; M. Hossain & Hammami, 2009; Ienciu, 2012; Kamran & Nicholls, 1994; Leventis & Weetman, 2004; Mia & Mamun, 2011; Mohd Ghazali & Weetman, 2006; Omar & Simon, 2011; Uwuigbe & Uadiale, 2011; Zubairu et al., 2011). A similar approach was adopted in this study in view of its advantages and to avoid the limitations of a weighted index. The underlying assumption of the unweighted index is that it considers all the information items to be equally essential to average users. A notable benefit of applying such an index is that it allows analysis of the independent perceptions of a specific user group (Chow & Wong-Boren, 1987).
Validity and Reliability of the Disclosure Index and Questionnaire Components
This research adapted prefers the study of Mariah and Mohammad (2015) to conduct the validity and reliability of the questionnaire and disclosure index. Cronbach’s alpha coefficient was used to quantify the reliability of the questionnaire. Its validity was assessed by following the content validity approach, which involved circulating five copies of the questionnaire to corporate sustainability and reporting scholars (researchers).
In this study, the reliability of the scale established to ascertain the factors encouraging environmental engagement and disclosure was determined by applying Cronbach’s alpha, computed using STATA 14. The calculated Cronbach’s alpha coefficient for the factors influencing environmental disclosure was .941, which based on Pallant (2010, 2020) implies very acceptable internal consistency of the scale, as it is above the prescribed value of .7.
Results and Discussion
Summary Statistics
Seven different competitive advantage factors were identified, denoted as Ca1…Ca7. Among these, the highest and lowest averages were 6.2121 and 3.9242 for Ca5 (energy efficient technology) and Ca7 (green HR) respectively (Table 3). The average scores of Ca1 (hazard free material) and Ca3 (recycling) is also in good practice for overall industries. The average scores of the remaining three factors, Ca2 (reuse), Ca4 (remanufacturing), and Ca6 (clean material), were 5.4848, 4.9015, and 5.9015 respectively. In general, all companies use energy saving technologies for improved environmental performance as well as for cost saving. Commonly, companies follow a recycling strategy and use hazard-free materials to achieve competitive advantage. Green human resource policy is a relatively new concept in Bangladesh. Some companies are starting to adopt this policy in recruitment, while others are not yet in that position. Therefore, the variation in Ca7 is high (1.8519). It is also noteworthy that the reuse and remanufacturing strategy is not completely applied by all companies. The standard deviations of Ca2 and Ca4 are 1.5555 and 1.6890 respectively, which are relatively higher than those of the other variables.
Summary of Competitive Advantage Factor.

Source. Data analysis.
In line with the research model, we identified six stakeholders, denoted by Sp1 (environmentally sensitive consumers/buyers); Sp2 (senior managers and employees); Sp3 (suppliers); Sp4 (financial institutions); Sp5 (mass media); and Sp6 (major competitors). We found that the highest average score was obtained (Table 4) by Sp1 (5.6439), followed by Sp2 (5.5606), and Sp3 (5.1970). The average scores showed positive pressure for all stakeholders. We also observed that the standard deviation was high for Sp1 (1.5878), but low for Sp5 (1.0483). According to the results, companies’ environmental engagements are highly dependable on their environmentally sensitive consumers/buyers and their own senior employees’ commitment. Subsequently, suppliers, financial institutions, mass media and major competitors exert pressure to adopt environmental strategies.
Summary of Stakeholders’ Pressures.

Source. Data analysis.
Two-Step Analyses
The measures were subjected to exhaustive quality and legitimacy two-step examinations. First, quality was surveyed utilizing Cronbach’s alpha coefficients with SPSS 21.0, which ranged from .930 to .958. Coefficients over 0.70 were considered worthy (Nunnally & Bernstein, 1994). All the measures were therefore subjected to confirmatory factor analysis (CFA) for examination of their validity (Gerbing & Anderson, 1992) through AMOS 21.0. Those with factor loadings lower than 0.5 should be ignored in order to allow investigations to preserve a suitable level of convergent and discriminant validity (Li, 2013). The factor loadings ranged from 0.700 to 0.917. In addition, insights into the measures of area (e.g., mean), scattering (e.g., standard deviation) and dissemination (e.g., skewness and kurtosis) were evaluated for the data. The data arrangement was tested for typicality utilizing the Kolmogorov–Smirnov test (Janssen & Laatz, 1997, 2013). The outcomes of the normality test for the conveyance sort affirmed that the data were around ordinarily dispersed, at a noteworthy level of 5%. CFA comes about distinguished a great fit show:
Factor Loadings for CA and SP.

Source. Data analysis.
Two measures, composite reliability (CR) and average variance extracted (AVE), were inspected to survey the reliability and the convergent and discriminant validity of the inactive constructs. The CR coefficients were all over 0.70 which are more than the least recommended value (Hair et al., 2010). Moreover, all the AVE estimates were more than their comparable squared value of correlations (Fornell & Larcker, 1981), demonstrating excellent discriminant validity between any two factors (Table 6). In this manner, the estimation models for the competitive advantage and stakeholder pressure constructs were well justified to be tried within the following basic demonstration.
Construct Inter-correlations (Squared Correlation), Mean and SD.

Note. Squared correlations are given in brackets.
p < .01. **p < .05.
Common method variance (CMV) refers to the sum of spurious covariance shared among factors since the common strategy utilized for collecting data (Bagozzi & Yi, 1990). CMV originates from response groups and scale sorts, as well as response inclinations such as corona impacts and social allure (Bagozzi & Yi, 1990). It was tested using Harman’s one-factor test by comparing the fit of the proposed model against that of a one-factor model. If a high level of CMV is present, entering all of the factors together will lead to one figure which accounts for most of the variance (Podsakoff & Organ, 1986). A one-factor solution comes about in
Structural Model and Hypothesis Tests
STATA 14.0 was utilized to conduct the examination with summated scales. The scales created two benefits in the models. First, they offered assistance in overseeing the impact of multicollinearity on the estimation of the relapse coefficients. Second, they offered assistance center from the management’s consideration on more crucial measurements of companies execution (e.g., advertising and eco), of which the individual attributes are indicators (Grapentine, 2000). The results of the path analysis suggest a good fit:
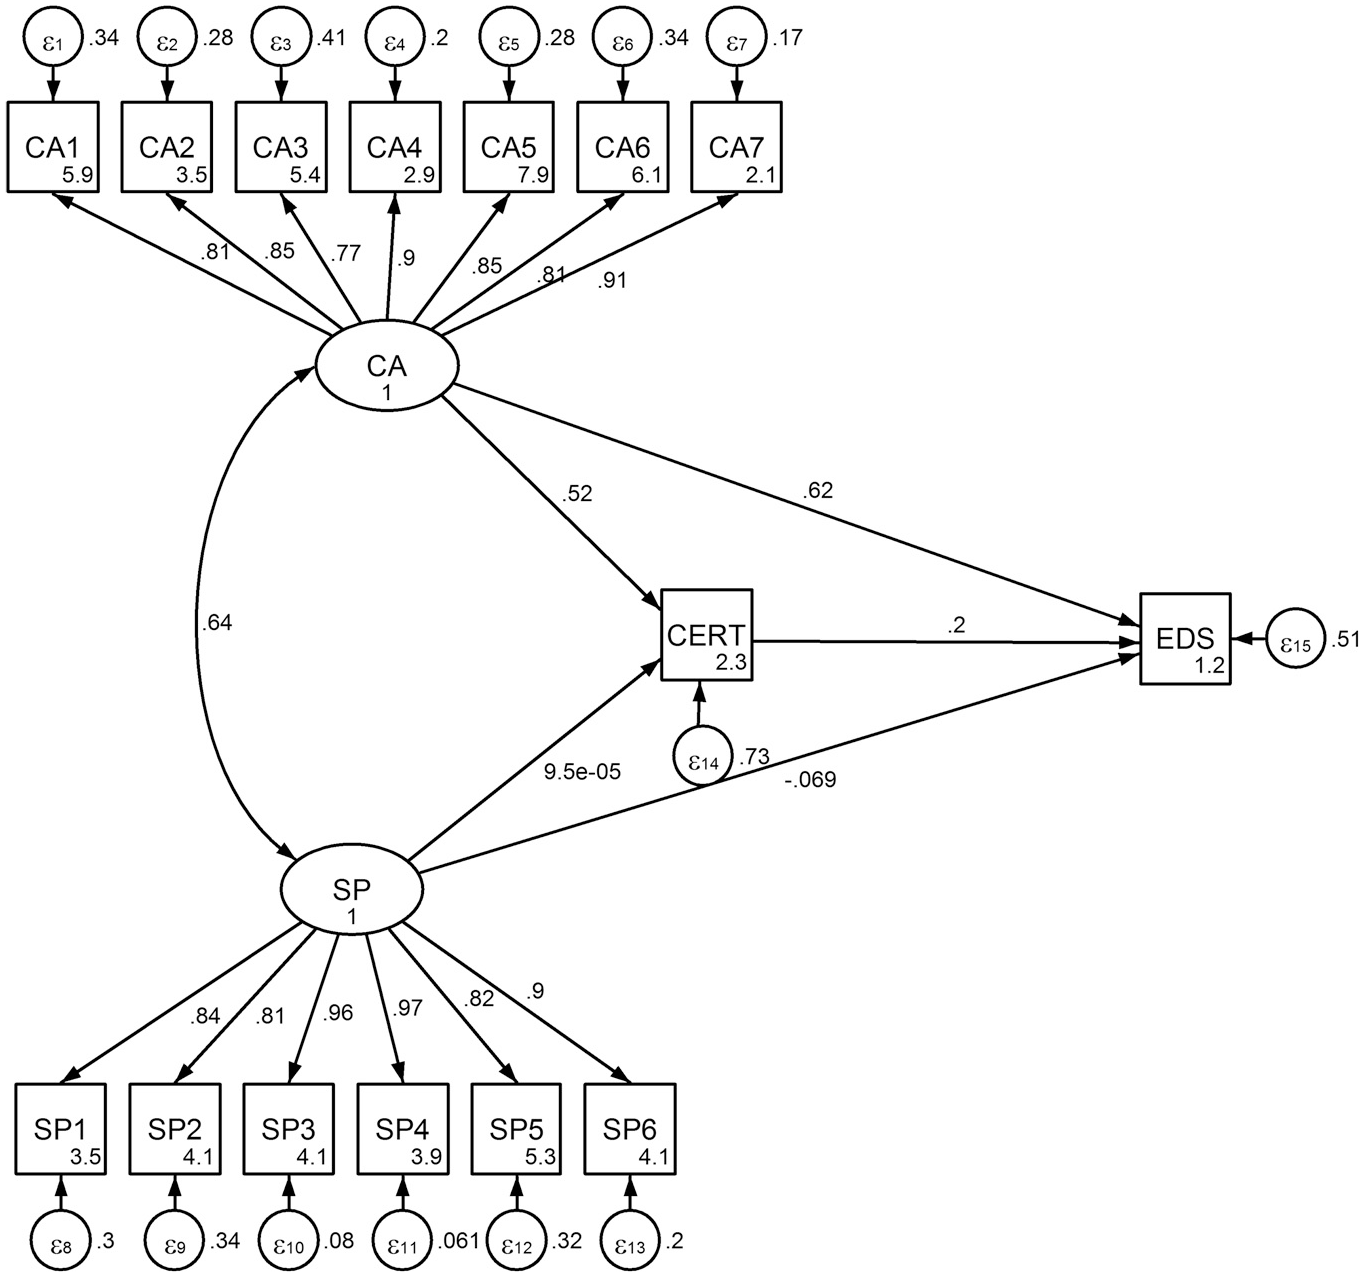
Standardized coefficients from SEM.
The standardized structural estimates are reported in Table 7. It can be seen from the table that CA has a significant positive influence on certification, which means that competitive advantage motivates the companies to obtain environmental certification from the various authorities. With regard to stakeholder pressure, it can be seen that there is no pressure from them regarding such certification. Certification has a significant positive impact on environmental disclosure. It can be concluded that there is no significant impact of stakeholder pressure on environmental disclosure. Finally, it is observed that competitive advantage has a significant positive impact on environmental disclosure. Equation level of goodness of fit is shown in Table 8. It can be seen from the table that 27.21% of the variation in certification is explained by the model, together with 48.87% of the variation in environmental disclosure.
Standardized Structural Estimates.

Equation-level Goodness of Fit.

Mediation Effect
The decomposition of effects is shown in Table 9. In the certification equation, all the effects are direct ones. The competitive advantage variable has a statistically significant (p < .000) positive direct impact (.7642) on certification, meaning that competitive advantage encourages firms to obtain environmental certification. On the other hand, the coefficient of SP is 1, which is constrained by default.
Direct Effects, Indirect Effects and Total Effects.

For EDS, the effects can be decomposed into direct, indirect, and total effects. Among the direct effects on EDS, certification and CA have significant impact, which means that firms with environmental certification make more environmental disclosures. In addition, to gain competitive advantage, firms also disclose more.
The indirect effects on EDS from CA and SP are statistically significant. The CA variable has a significant positive indirect effect (.1036) on EDS, while the SP variable also has a significant positive impact (.000019). It can be concluded that SP and CA both motivate firms to disclose more environmental information in their annual reports.
The total effects of the variables are simply the sum of the direct and indirect effects. Therefore, the total effects on certification are equal to the direct effects, because they are not mediated. All the total effects for EDS are statistically significant, apart from SP.
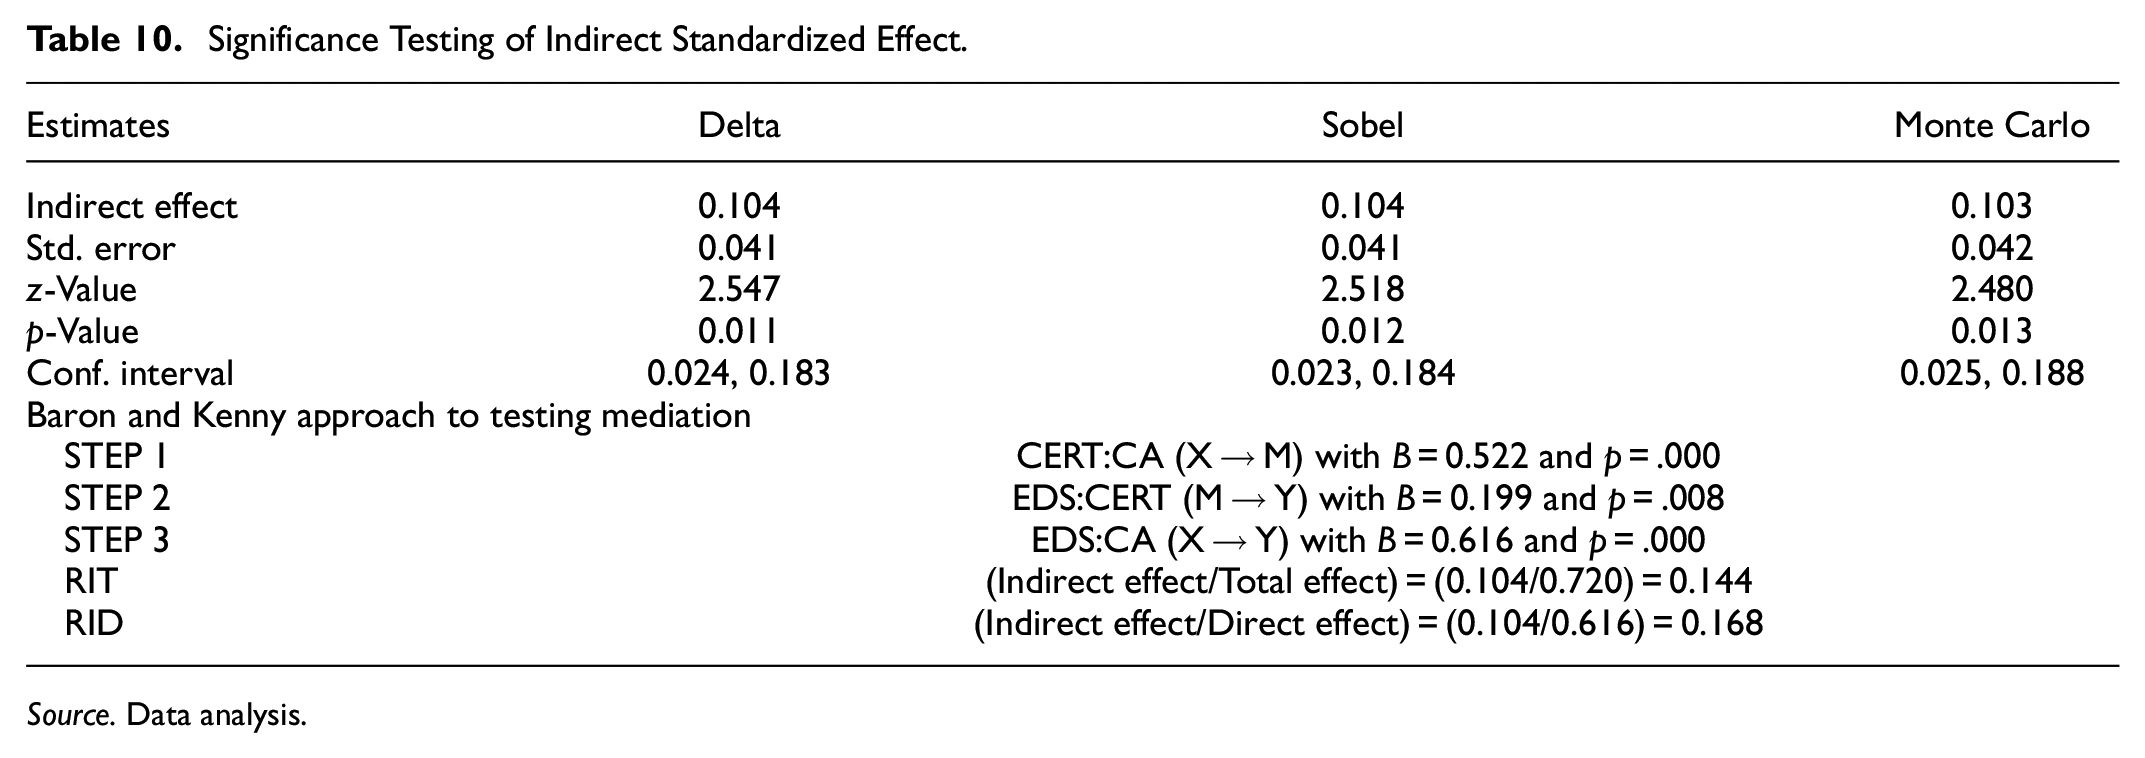
Following Mehmetoglu (2018), we also ran Delta, Sobel, and Monte Carlo tests to test the indirect standardized effect and also applied the Baron and Kenny approach to test mediation; the results are shown in Tables 10 and 11.
Significance Testing of Indirect Standardized Effect.
Source. Data analysis.
Significance Testing of Indirect Standardized Effect.

Source. Data analysis.
Table 10 shows that STEP 1, STEP 2, and STEP 3, together with the Sobel test, are significant, so it can be concluded that the mediation is partial. This means that the relationship between CA and EDS is partially mediated by certification. It can also be seen that around 14% of the effect of CA on EDS is mediated by CERT, or that the mediated effect is around 0.2 times greater than the direct effect of CA on EDS.
From Table 11, it can be seen that neither STEP 1 nor STEP 2 is significant, so it can be concluded that there is no mediation from SP to EDS via CERT. It can also be seen that the effect of SP on EDS through mediation by CERT is almost zero that is, the mediated effect is around 0.0 times greater than the direct effect of SP on EDS.
Discussion
From the above results, it is seen that CA has direct, indirect and total effects on the environmental disclosure score (EDS) and that CA has a mediation effect on EDS via CERT, while SP has only an indirect effect on EDS. Many companies, especially those in the textile, pharmaceutical, and cement industries, are export oriented so compete globally. In addition, to some extent environmental concerns are a prerequisite for foreign buyers. On the contrary, local market-oriented companies face pressure from government to be pollution free, despite there being no mandatory disclosure rules. Such local companies, aiming to start international trade with a high level of capital or profit, enjoy competitive advantage through certification and greater disclosure. They satisfy government requirements by acquiring certification and gaining competitive advantage by disclosing environment-saving activities. According to RBV, companies can utilize their resources to acquire competitive advantage. As a result, they acquire certification from different authorized bodies, which requires the fulfilment of certain preconditions, thus resulting in various environment saving activities. Finally, certified companies disclose their environmental actions following recognized certification. If companies engage in environmental activities which save the environment for society, they will disclose these to legitimatize themselves. Such environmental disclosures enrich their brand image and make them unique in their industry as environmentally friendly companies. This infers that competitive advantage leads to the disclosure of more environmental information. In addition, highly recognized certified companies disclose more environmental information than those without certification or ones with less recognized certification. Therefore, the findings of the study fully support the RBV and legitimacy theory, as is the case in the previous studies of Cho and Patten (2007), de Villiers and van Staden (2006), and Nurhayati et al. (2016).
On the contrary, stakeholders have no direct impact on CERT and EDS. This does not mean that there is no stakeholder pressure on environmental activities, but rather that they have no direct pressure on certification or environmental disclosure. Company management may consider that they are satisfying their buyers or government authorities by providing the necessary information individually and not using disclosure media, which reduces costs. Additionally, the cost of disclosure may be higher than the gains. However, this has an indirect effect on EDS, since there are environmental regulations for employing pollution-free equipment (e.g., ETP setup according to Bangladesh Environmental Conservation Rule, 1997: https://www.elaw.org/system/files/Bangladesh+–+Environmental+Conservation+Rules,+1997.pdf). Companies do not feel pressure, directly since to some extent they disclose environmental information to legitimatize themselves with society and to gain competitive advantage. In addition, the government introduces environmental regulations as a result of stakeholder pressure. Therefore, it can be stated that the findings of the study partially support stakeholder theory, in line with the studies of (Elijido-Ten, 2009) and (Husillos & Álvarez-Gil, 2008), although SP to CERT and SP to EDS are shown to insignificant.
Conclusion
This study contributes to understanding of the influence of competitive advantage (CA) and stakeholder pressure (SP) on environmental disclosures, while appraising the role of certification as a predictive mediating factor. CA, unlike SP, is likely to be considered as a significant factor that encourages the securing of environmental certificates and the generation of environmental reports. Attaining internal energy efficiency, implementing green HR, and employing clean and hazard-free materials may be instrumental for organizations to invest in environmental certification and to clarify their eco-efficiency through environmental reporting. On the other hand, stakeholder pressure has little effect on motivating organizations to secure certification with continuous renewal. Finally, the significant impact of environmental certification on environmental reporting justifies the intent of firms to reach people through their current competitive position as eco performers. All these findings further elucidate our concern for the circumstances under which firms can play transformational roles in updating their competitive edge, and which confirms the achievement of certification, which is communicated through environmental reporting in the developing country.
Despite squeezed generalizability, to deal with environmental sustainability the empirical findings of the study lead to recommendations for the top management of organizations to take initiatives to upgrade their eco efficiency, considering the impact of competitive advantage and stakeholder pressure. In summary, the study outlines that competitive advantage has been proven to have a direct impact on the extent of environmental disclosures, as well as an indirect impact through the mediation of environmental certification. Creating an avenue to acquire certificates as proof of environmental credentials by national and international authorities should be an issue of prime importance, and depends on fine tuning company competitiveness.
According to emerging countries’ perspectives, competitive advantage is crucial for certification and extra environmental disclosure, whereas it was previously believed that stakeholder pressure was what determined environmental disclosure. The environmental disclosure literature is thus updated with new information. The following are some ways that various groups can exploit the study’s contributions: (a) In their annual reports, managers of companies will place more emphasis on certification than disclosure in order to gain a competitive edge. (b) New laws, norms, or guidelines for environmental disclosure may be introduced by policymakers that highlight the competitive advantage of the business, such as a tax break or low-interest loan. (c) Since general environmental disclosure will increase costs without adding any value, stakeholders in the company may require environmental disclosure that is, tied to a competitive advantage. The study also adds to our understanding of the world by showing that, despite apparent contradiction, certified companies share more environmental information than non-certified enterprises. Companies with certifications have already demonstrated their environmental stewardship by obtaining them. Additional disclosures raise prices without delivering value. Therefore, in the case of enterprises with fewer certifications, stakeholders should emphasize further environmental disclosures.
The study also suggests that firms and manager must simultaneously develop and nurture corporate, business and functional level strategies focusing on competitive issues such as energy efficiency; green HR; reuse, re-manufacturing and recycling; and the handling of hazardous materials in order to protect and conserve the natural environment, thus expediating the way forward to achieve environmental attestation. In addition, it is also recommended that visits be made to factories which ensure best environmental practices; that their cutting-edge technology be benchmarked; and that lessons, training, and workshops on environmental conservation, environmental accounting and environmental cost accounting be provided, thus building the capacity which is expected to be reflected through certification and communication to the groups of concerned parties. Moreover, management may need to consider the demands of stakeholders, thus leaving the company in a better position to outperform competitors.
This study elucidates the inner crux of environmental disclosures; however, certain drawbacks remain, which may lead to avenues for future research. First, the research findings are not applicable to all country perspectives, as only the developing country of Bangladesh is considered. Therefore, for broader generalization of the outcomes, a multi-country study could be conducted. Second, this study demonstrates certification to be a mediating variable in considering the influences of CA on EDS and SP on EDS. Therefore, future studies could investigate the effects of the environmental values of organizations, their financial performance, the environmental perception of stakeholders, and corporate governance in the proposed model. Finally, more extensive and larger samples could be considered to confirm the generalizability and representativeness of the study findings. Hence, future research could consider the wide-ranging sample of respondents at different organizational levels.
Footnotes
Appendix 1
Sample Companies.
Appendix 2
B5: Statement for CEP.

| CEP1 | Our company reduces air pollution as per target | Environment Conservation Act 1995; Environment Conservation Rules 1997 (Amended Feb and Aug 2002) |
| CEP2 | Our company reduces water pollution as per target | Environment Conservation Act 1995; Environment Conservation Rules 1997 (Amended Feb and Aug 2002) |
| CEP3 | Our company reduces sound pollution as per target | Environment Conservation Act 1995; Environment Conservation Rules 1997 (Amended Feb and Aug 2002); Noise Pollution Control Rules 2006 |
| CEP4 | Our company reduces land pollution as per target | Environment Conservation Act 1995; Environment Conservation Rules 1997 (Amended Feb and Aug 2002) |
| CEP5 | Our company reduces waste production | Environment Conservation Act 1995; Environment Conservation Rules 1997 (Amended Feb and Aug 2002); wastage Management Rules 2008 |
| CEP6 | Our company never incurs any penalties for unlawful activities (environment related) | Azzone et al. (1996), Henri and Journeault (2008) |
| CEP7 | Our company reports environmental performance for external users | Jasch (2000) |
| CEP8 | Our company has environmental management skilled employees | Som (2003) |
Appendix 3

| SL. No. | Name of disclosure |
|---|---|
| 1 | Environmental clearance certificate |
| 2 | Eco-friendly products |
| 3 | Environmental safety related policy |
| 4 | ISO14001 certificate |
| 5 | Environmental management actions |
| 6 | Industry related certificates |
| 7 | Air pollution related information |
| 8 | Effluent treatment plant related information |
| 9 | Sound pollution and prevention related information |
| 10 | Land pollution and prevention related information |
| 11 | Marine pollution and prevention related information |
| 12 | Corporate social responsibility relating to environment |
| 13 | Water consumption and pollution related information |
| 14 | Environmental awards related information |
| 15 | Wastage related information |
| 16 | Tax benefits due to environmental investments or greening |
| 17 | Environmental committee from board of directors |
| 18 | Green human resource policy |
| 19 | Donation for environmental safety |
| 20 | Energy saving information |
| 21 | Training for environmental skill development |
Source. Literature survey.
Acknowledgements
We are grateful to the managers of the manufacturing concerns who provided us with great support in obtaining the data.
Author Contributions
Conceptualization—Md. Ali Arshad Chowdhury, Mohammad Morshedur Rahman; formal analysis and data management—Mouri Dey, Syed Moudud-Ul-Huq; writing—original draft preparation—Sk Alamgir Hossain; writing—review and editing—Syed Moudud-Ul-Huq, Md. Ali Arshad Chowdhury, Mohammad Morshedur Rahman, Mouri Dey, and Sk Alamgir Hossain.
Declaration of Conflicting Interests
The author(s) declared no potential conflicts of interest with respect to the research, authorship, and/or publication of this article.
Funding
The author(s) received no financial support for the research, authorship, and/or publication of this article.
Data Availability Statement
Data sharing not applicable to this article as no datasets were generated or analyzed during the current study.