
Abstract
In cognitive diagnosis assessments, examinees frequently skip some items due to various reasons, such as time constraints, lack of confidence, or the perception of item difficulty. These skipped items are usually due to lacking specific cognitive attributes or knowledge structures. However, many research studies conventionally rely on complete-case analysis, potentially compromising the validity of results by ignoring skipped items. This omission can lead to invalid inferences about the attributes profiles of examinees and introduce bias into item parameters. This study aims to develop statistical models for effectively handling missing data resulting from skipped items. Specifically, we employ an item response theory model for missing indicators and utilize the deterministic inputs, noisy “and” gate (DINA) model to describe cognitive item responses. Furthermore, we introduce a higher-order structure to describe the correlation between the higher-order ability parameters and skipping propensity parameters and the correlation of the item parameters. The proposed new model fills the gaps in missing data handling, providing a more precise evaluation for the examinees who skip items and yielding more accurate research results. This enhances our understanding of cognitive processes and strengthens support for educational policies, aligning them better with student needs and optimizing decision-making.
Plain language summary
We propose a missing data model for skipped items in cognitive diagnostic assessments. The significance of our findings is illustrated with an application to a real data set.
Introduction
In cognitive diagnostic assessments, researchers typically utilize responses from multiple items to gain a comprehensive understanding of individuals’ cognitive attributes or knowledge structures. However, a common challenge emerges when examinees choose to respond to some items while skipping others, resulting in missing data at item level. This behavior can be attributed to various reasons, including perceived difficulty of specific items, allocating excessive time to one item leading to the omission of others, or simply skipping some items. Ignoring such missing data can lead to information loss and potentially bias the interpretations. It is important to note that many research investigations commonly employ an analytical approach that relies solely on available data, evaluating examinees based exclusively on their observed response data. This approach may potentially provide incomplete diagnostic feedback to individuals with missingness in their data, and importantly, may lead to biased conclusions when comparing them to examinees with complete datasets.
The process of making a cognitive diagnosis has received extensive attention in psychology and educational assessment recently. A great deal of cognitive diagnosis models (CDMs) has been developed, for instance, the deterministic inputs, noisy “and” gate (DINA) model (Junker & Sijtsma, 2001), the log-linear cognitive diagnostic (LCDM) model (Henson et al., 2009), and the general DINA model (de la Torre, 2009; de la Torre & Douglas, 2004; Junker & Sijtsma, 2001). De la Torre and Douglas (2004) proposed a higher-order DINA (HO-DINA) model to connect latent attributes through higher-order ability.
In practice, cognitive diagnosis assessments could investigate examinees’ skills and knowledge, which provide fine-grained diagnosis and feedback information, such as attribute mastery information and cognitive processes. For example, even if the scores of two examinees are the same, their knowledge structures and learning paths may be different. Thus, teachers’ instructional approaches should also be distinct. Consequently, examinees with the same score tend to have distinct cognitive structures and cognitive processes. In this case, if examinees’ strengths and weaknesses can be identified, much more meaningful and much richer information about the individuals’ attribute profiles can be provided. Meanwhile, such information can also be used to adapt instruction to the examinees and determine their skills and knowledge that need to be developed further.
Cognitive diagnosis assessments (de la Torre, 2011) are effective tools for evaluating examinees’ mastery of skills or attributes. However, in practical test scenarios, some examinees often leave a few items blank for various reasons. For example, they may perceive some items as too difficult, they may have insufficient time to answer some questions, or their test-taking motivation may decline over the course of the assessments. Usually, the skipped/omitted items occur within a block of responses. According to the Programme for the International Assessment of Adult Competencies (PIAAC) in 2012, skipped item rates varied significantly; in Korea, only 2% of items in the numeracy domain were skipped, while in Chile, 25.9% of items in the literacy domain were left unanswered (OECD, 2013). This highlights the widespread issue of missing data in educational assessment and psychological measurement (Rose et al., 2017; Yuan et al., 2018). Consequently, if these missing responses are not handled properly, they can pose a significant threat to the validity of the assessments (Pohl et al., 2014; Rose et al., 2015).
To address the missing data issue more effectively, Rubin (1976), Little and Rubin (2002) proposed three mechanisms: not missing at random (NMAR), missing at random (MAR), and missing completely at random (MCAR). Let
In the framework of IRT, the issue of missing data has garnered substantial attention, leading to the development of various methodologies to address item nonresponse based on different missing mechanisms (Dai, 2021; Du et al., 2022; Pohl & Becker, 2020; Sperrin & Martin, 2020; Xiao & Bulut, 2020). The contributions include the multidimensional IRT (MIRT) models explored by scholars (Glas & Pimentel, 2008; Grund et al., 2021;Holman & Glas, 2005; Moustaki & Knott, 2000; O’Muircheartaigh & Moustaki, 1999), as well as latent regression models (LRM) proposed by Rose et al. (2010). The literature has also witnessed sophisticated integrations, such as the combination of MIRT with LRM as presented by Rose et al. (2017), and innovative models like the IRTree proposed by Debeer et al. (2017). A recent development, as emphasized by Pohl et al. (2019) and Ulitzsch et al. (2020a, 2020b), focuses on incorporating response time to model item nonresponses (Guo et al., 2022; Lu et al., 2023; Lu & Wang, 2020).
Moving into the realm of cognitive diagnosis assessments (Ma, 2022; Templin & Henson, 2006), which intricately analyze examinees’ skills and knowledge, the need to address missing data becomes increasingly urgent. While several methods have emerged within the cognitive diagnosis framework, most remain relatively straightforward. Ömür Sünbül (2018) investigated four methods to address missing data in the DINA model under the MCAR and MAR mechanisms. These methods include treating missing data as incorrect, person mean imputation, two-way imputation, and expectation-maximization imputation. While these methods are conceptually clear, their effectiveness tends to diminish as the proportion of missing items increases. Specifically, when dealing with non-ignorable missing data, these methods can introduce biases and errors into statistical inference. Following this, Dai et al. (2018) examined the influence of missing responses on two Q matrix validation methods. However, they did not delve into the impact of missingness on specific CDMs. Shan and Wang (2020) proposed a joint CDM model that addresses item-level missing data by introducing the categorical missingness propensity of examinees, but they did not elaborate on this potential categorization. Dai and Svetina Valdivia (2022) assessed the performance of different strategies for managing missing data, including the full information maximum likelihood estimation in CDMs. However, their focus remained on methods to treat missing responses in the CDMs, without constructing a dedicated model for these missing responses. More recently, Liang et al. (2022) introduced a joint cognitive model for not-reached missingness. Yet, when it comes to skipped items, to our knowledge, no model has been developed within the cognitive diagnoses framework to particularly address them.
Recognizing the absence of such models, this paper introduces a novel missing data model for skipped items within the CDM framework. Our aim extends beyond merely addressing this gap; we aim to present a model that offers a comprehensive understanding, departing from the more simplistic approaches employed previously. In essence, our work not only assesses skipped items but also delivers a nuanced analysis, representing a significant advancement. To capture the underlying processes of the cognitive diagnosis, we bring together research on modeling cognitive item responses and research on missing data models in a joint modeling framework. This framework is characterized by a bivariate normal distribution between examinees’ higher-order ability parameters and skipping propensity parameters, and a multivariate normal distribution of the item intercept parameters, interaction parameters, and item skipping difficult parameters. The parameters of the model were estimated by the Bayesian Markov chain Monte Carlo (MCMC) method. The results of simulations showed that the proposed model improved attribute profile correct classification rates and produced precise estimation of item parameters when the missing mechanism is nonignorable.
The remainder of this paper is structured as follows. First, a missing indicator model is presented to model the skipped item responses. Second, the higher-order DINA model is used to model the response data. The missing model and response model are linked by the correlation of higher-level ability parameters and the skipping propensity parameters, and the correlation of item parameters. Third, the MCMC algorithm was used to estimate the model parameters and two model selection criteria were given to evaluate the model fit. Fourth, simulation studies are conducted to evaluate the performance of the proposed model under different conditions. Finally, concluding remarks and some suggestions for future research are provided.
Model Construct
Let
Modeling Skipped Items
The missing data mechanism of skipped items is modeled using an additional manifest or latent variable, which represents the examinees’ tendency to skip items (Holman & Glas, 2005; Rose et al., 2017). The skipping indicator

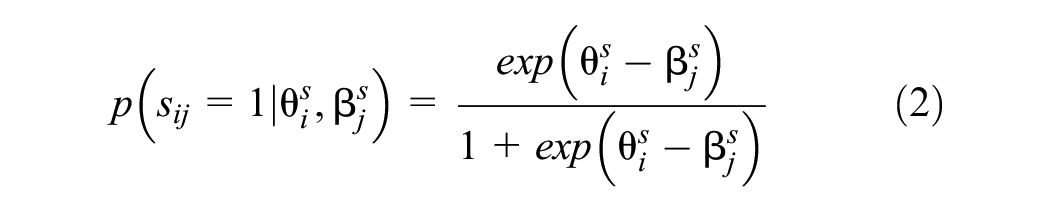
The Rasch model (Rasch, 1966) is employed to express the probability of skipping items. That is, the probability of item skipping is modeled as a function of an examinee’s skipping propensity
HO-DINA Model
The DINA model describes the probability of item response as a function of latent attributes, and the probability of the

where
Equation 3 can be re-parameterized by the logit scale as the re-parameterized DINA model (DeCarlo, 2011):


In addition,

where

where
The Hierarchical Model
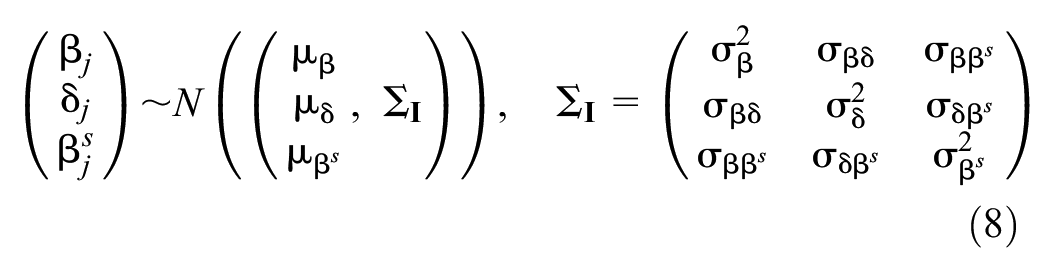
Following the hierarchical modeling framework, item parameters
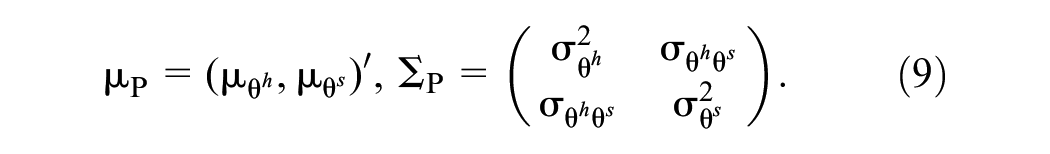
In addition, the joint distribution of the person parameters is assumed to follow a bivariate normal distribution with mean vector
Model Identifications
To solve the identifications of the proposed model, we have made the following restrictions. On the one hand, to eliminate the trade-off between ability
Model Selection
We used two common Bayesian model evaluation criteria: the deviance information criteria (DIC; Spiegelhalter et al., 2002) and the logarithm of the pseudo marginal likelihood (LPML, Geisser & Eddy, 1979; Ibrahim et al., 2001); They can be employed for comparing the missing mechanism models through MCMC sampling. The


Based on the posterior distribution of

where
Another way to compare the two model fits is LPML. The conditional predictive ordinate index (Chen et al., 2000) of the two models is computed. Let
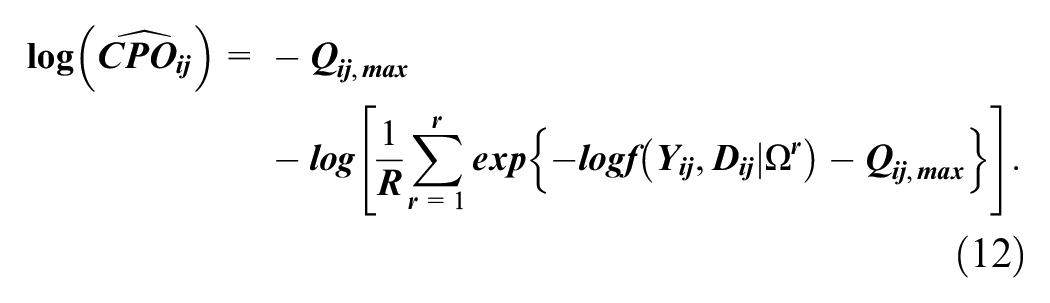
Note that the maximum value adjustment used in

where the model with a larger LPML signifies a better fit to the data.
Simulation Studies
We conducted four simulation studies to evaluate different aspects of the proposed model. Simulation study I was conducted to assess whether the Bayesian MCMC algorithm could successfully recover parameters for the proposed model under different numbers of examinees with fixed numbers of items and attributes. Simulation study II was conducted to investigate the parameter recovery of different numbers of attributes for the same numbers of examinees and items. Simulation study III was intended to show the differences in model parameter estimates between the NMAR and MAR models for different skipping proportions and correlations between person parameters. Simulation study IV aimed to show the performance of the model selection using DIC and LPML for the NMAR and MAR models with different skipping proportions and correlations between person parameters.
We employed the Bayesian MCMC method to estimate the model parameters. The convergence of the Bayesian algorithm was checked by monitoring the trace plots of the parameters for 10,000 iterations. The first 5,000 iterations were set as the burn-in period. There were R = 30 replications for each simulation condition. In terms of convergence, we found that the potential scale reduction factor (PSRF; Brooks & Gelman, 1998) was less than 1.1 for all parameters, which means that the chains converge well. The bias and root mean square error (RMSE) were computed to evaluate the parameter recoveries. To evaluate item parameter recoveries, the bias was averaged across all items. Regarding the classification of individual attributes and profiles, the attribute correct classification rate (ACCR) and the pattern correct classification rate (PCCR) were computed.
Data Generation
In the four simulation studies, the item parameters were sampled from the following distributions:

which were consistent with Liang et al. (2022). The low and high skipping proportions were varied by setting the value of
The intercept parameters of the attributes were set as

The person parameters

The Prior and Posterior Distributions
Model parameters were estimated using the Bayesian MCMC algorithm. The joint posterior distributions for the model parameters are obtained through observed data likelihood and prior distributions of model parameters.
Let
The Priors and Hyperpriors of the Model Parameters and Their Values in Simulation Studies.

The posterior distribution of the proposed model can be obtained as follows:

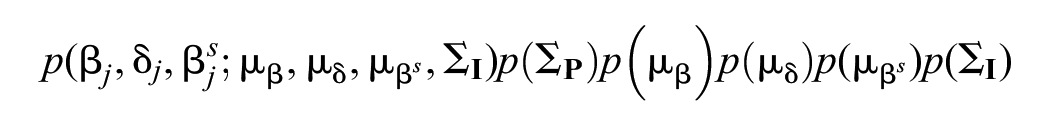

The details of the MCMC algorithm are given in the Appendix.
Simulation Study I
In simulation study I, the aim was to investigate the impact of the sample size on the performance of the parameters and attribute profiles. The conditions were set as follows: 1,000 examinees responded to 30 items with five attributes, and this was compared to a scenario where 500 examinees answered 30 items with five attributes. Moreover, the correlation between
Table 2 presents recoveries of the ability parameters and item parameters as well as the attribute parameter estimates. Given the test length and the number of attributes, when the number of examinees increased from 500 to 1,000, the bias and RMSE of the item parameters
The Parameter Estimates in Simulation Study I.
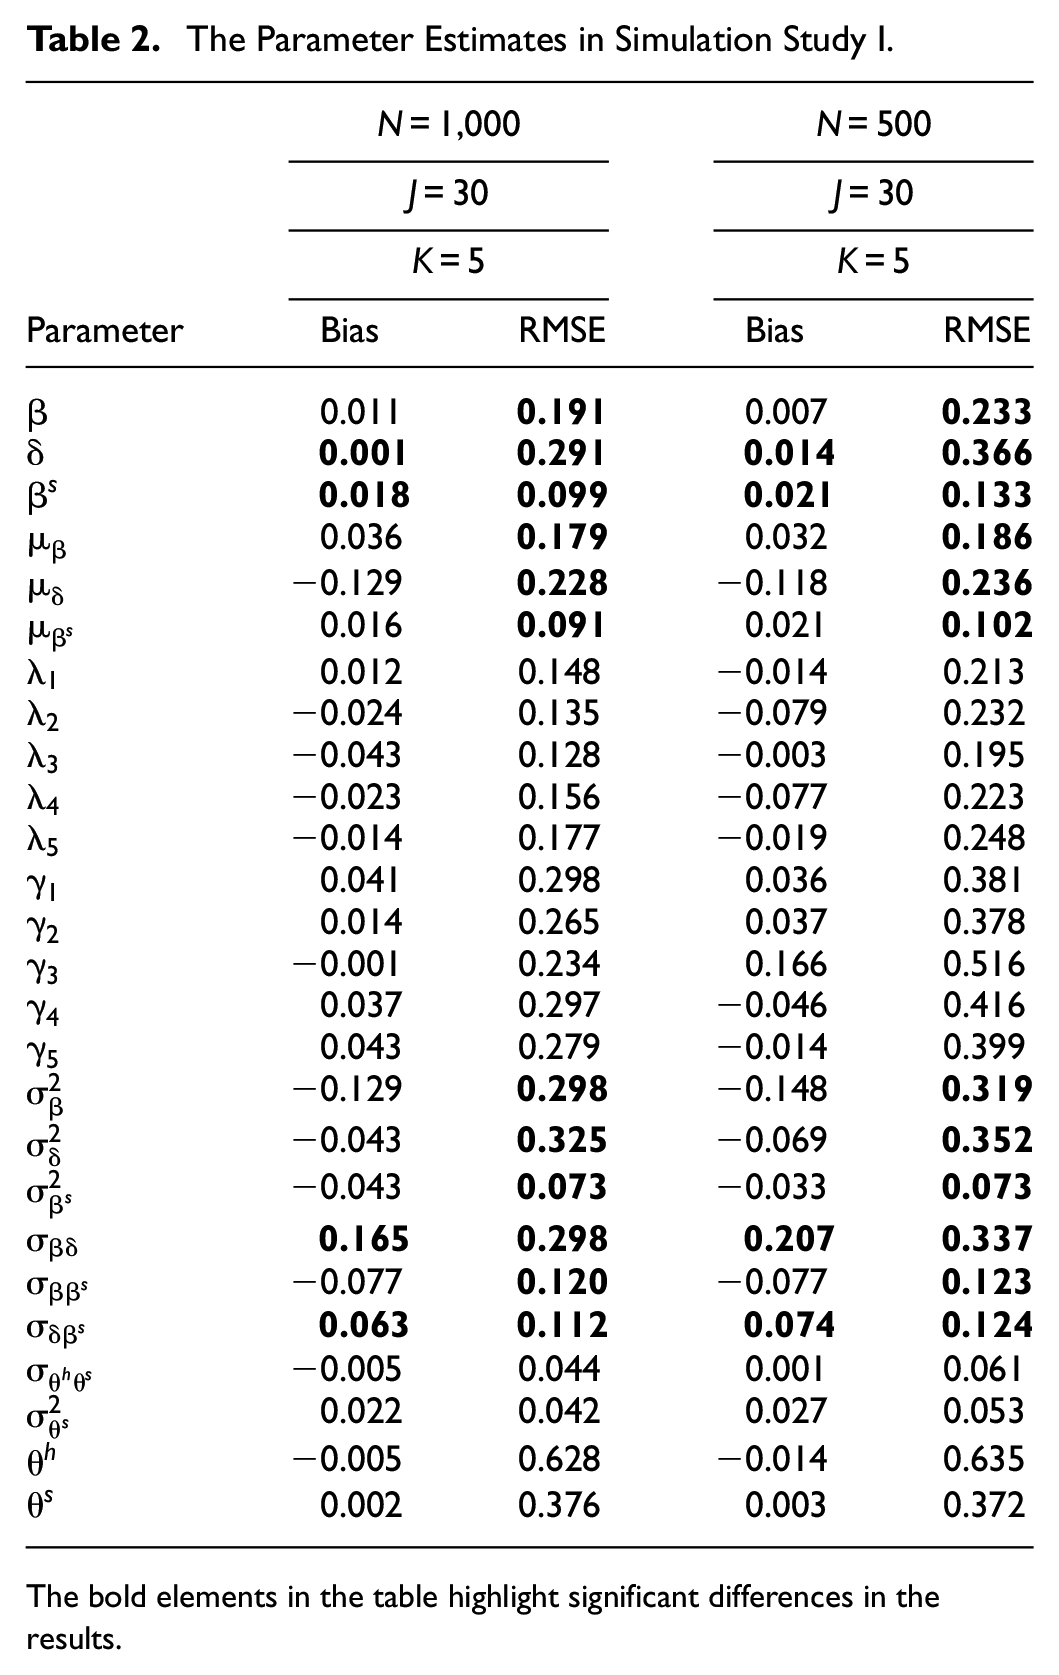
The bold elements in the table highlight significant differences in the results.
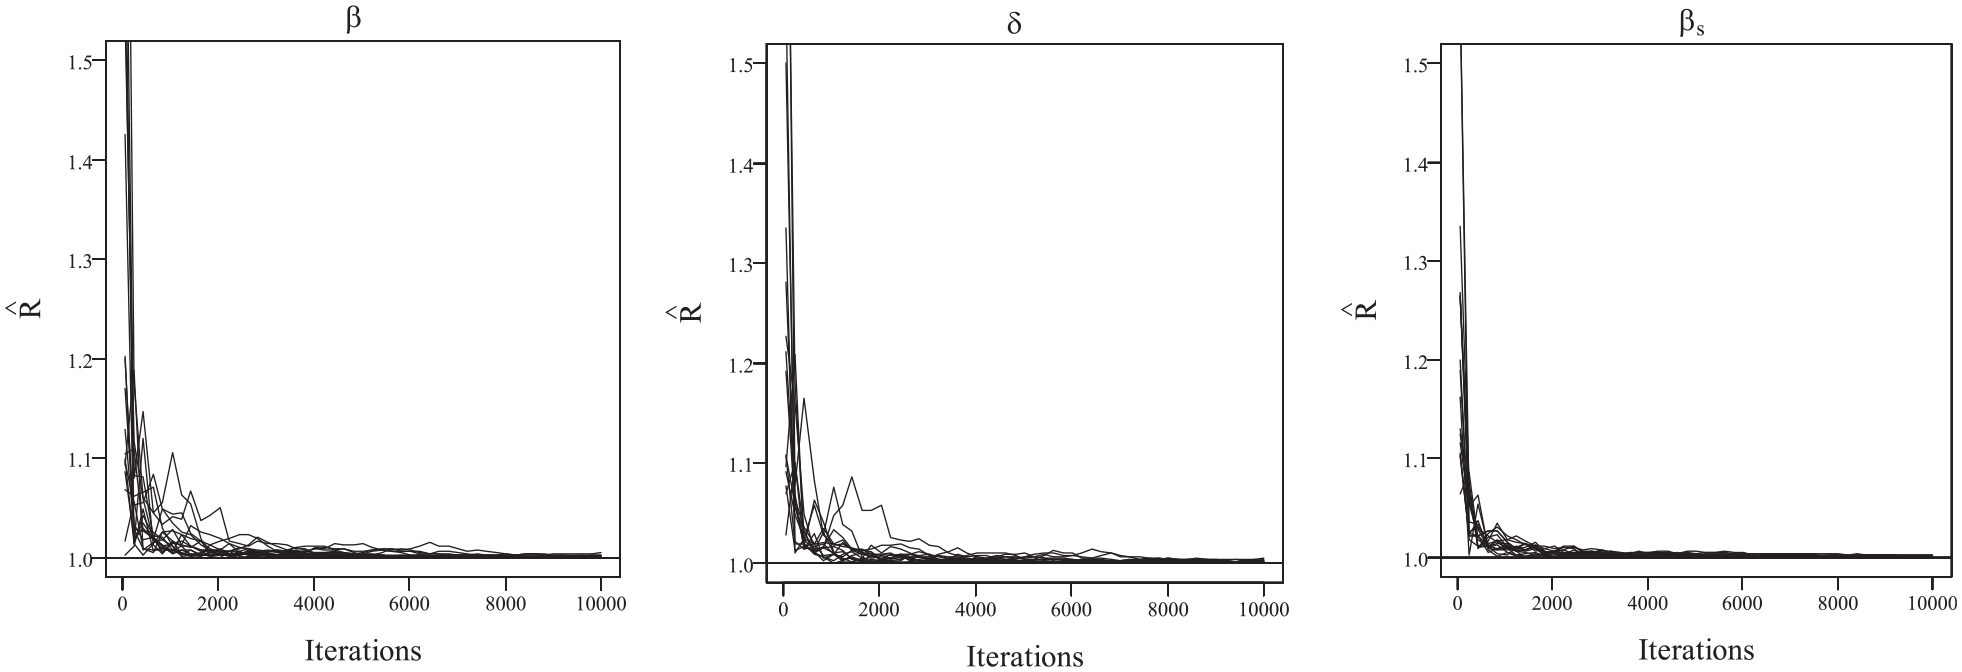
The trace plots of PSRF values in simulation study I.
In simulation study I, our findings indicate: First, a larger sample size provides a more robust dataset that captures individual responses comprehensively, thereby enhancing the precision of item parameter estimates. For instance, the bias and RMSE for item parameters were significantly reduced when the sample size was increased to 1,000. Second, when focusing on attributes, ACCR reflects the accuracy of classifying each attribute, while PCCR measures the overall accuracy of pattern classification. Our analysis revealed that as the sample size increased, both ACCR and PCCR values improved. For detailed results, please refer to Table 4. These findings emphasize the significance of sample size in improving the precision of item parameter estimation and enhancing the accuracy of attribute classification.
Simulation Study II
The aim of simulation study II was to investigate the parameter recoveries of different attributes under two conditions: (a) 500 examinees, 20 items, five attributes; and (b) 500 examinees, 20 items, three attributes. In both cases, the correlation between
Table 3 shows the bias and RMSE values for the parameters. The ability parameter
The Parameter Estimates in Simulation Study II.
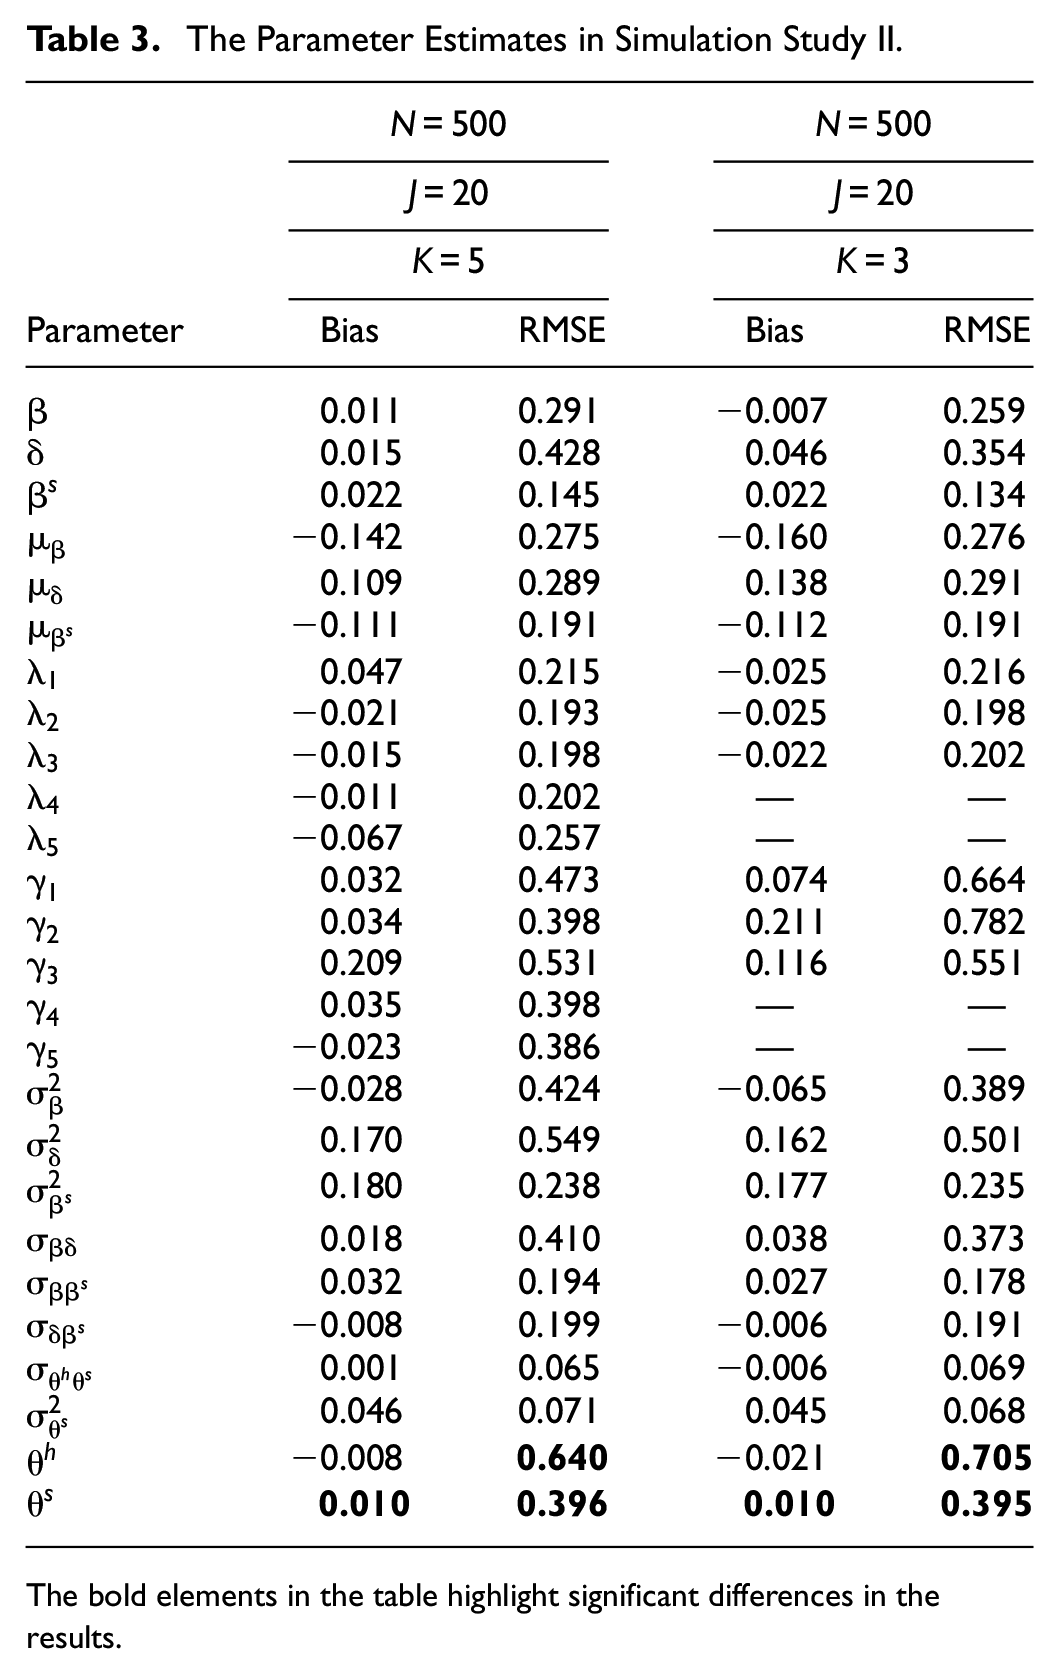
The bold elements in the table highlight significant differences in the results.
ACCRs and PCCRs in Simulation Studies I and II.
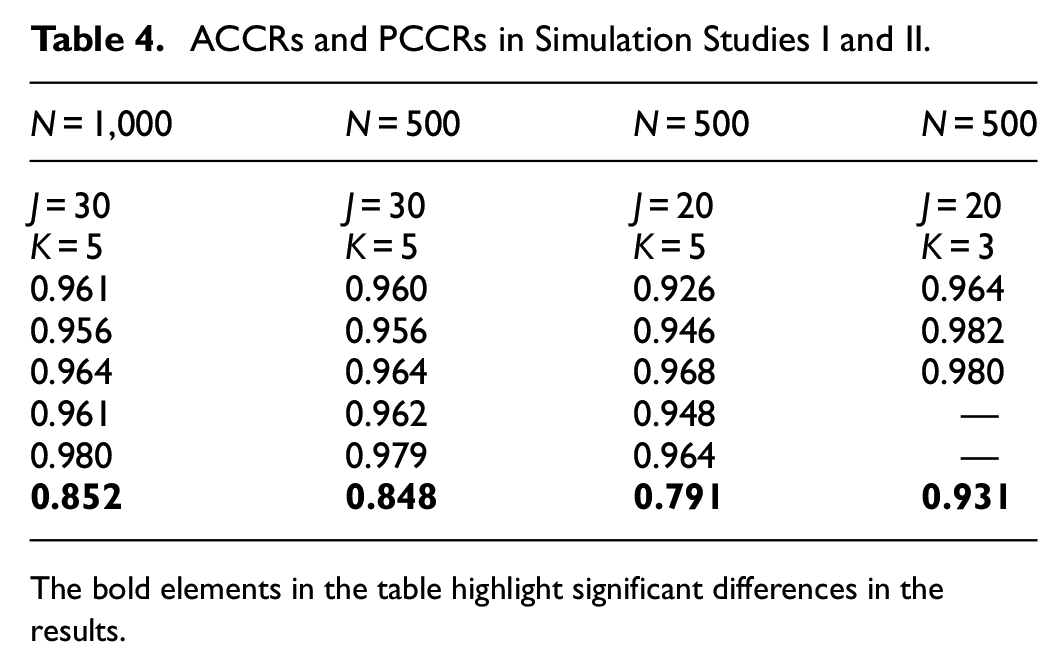
The bold elements in the table highlight significant differences in the results.
In summary, a larger sample size and longer item length resulted in improved ACCR and PCCR recoveries. Conversely, when the number of examinees or the item length was reduced, both ACCRs and PCCRs decreased. Note that these changes became more apparent when the test length was decreased.
Simulation Study III
Simulation study III aims to investigate the parameter recoveries under different skipping proportions and correlation coefficients. We considered three models: the NMAR, MAR, and HO-DINA models. Two skipping proportions were considered: 12% (low) and 25% (high). In addition, three correlations of
For the conditions with a low skipping proportion, Tables 5 and 6 show the bias and RMSE values for the parameters, including person, item, and attribute parameters of the three models, based on the different correlations between
The Bias of Parameter Estimates in the Models With Low Skipping Proportions and Different

Note. NMAR = not missing at random model; MAR = missing at random model; HO-DINA = higher-order DINA model.The bold elements in the table highlight significant differences in the results.
The RMSE of Parameter Estimates in the Models With Low Skipping Proportions and Different

Note. NMAR = not missing at random model; MAR = missing at random model; HO-DINA = higher-order DINA model.The bold elements in the table highlight significant differences in the results.
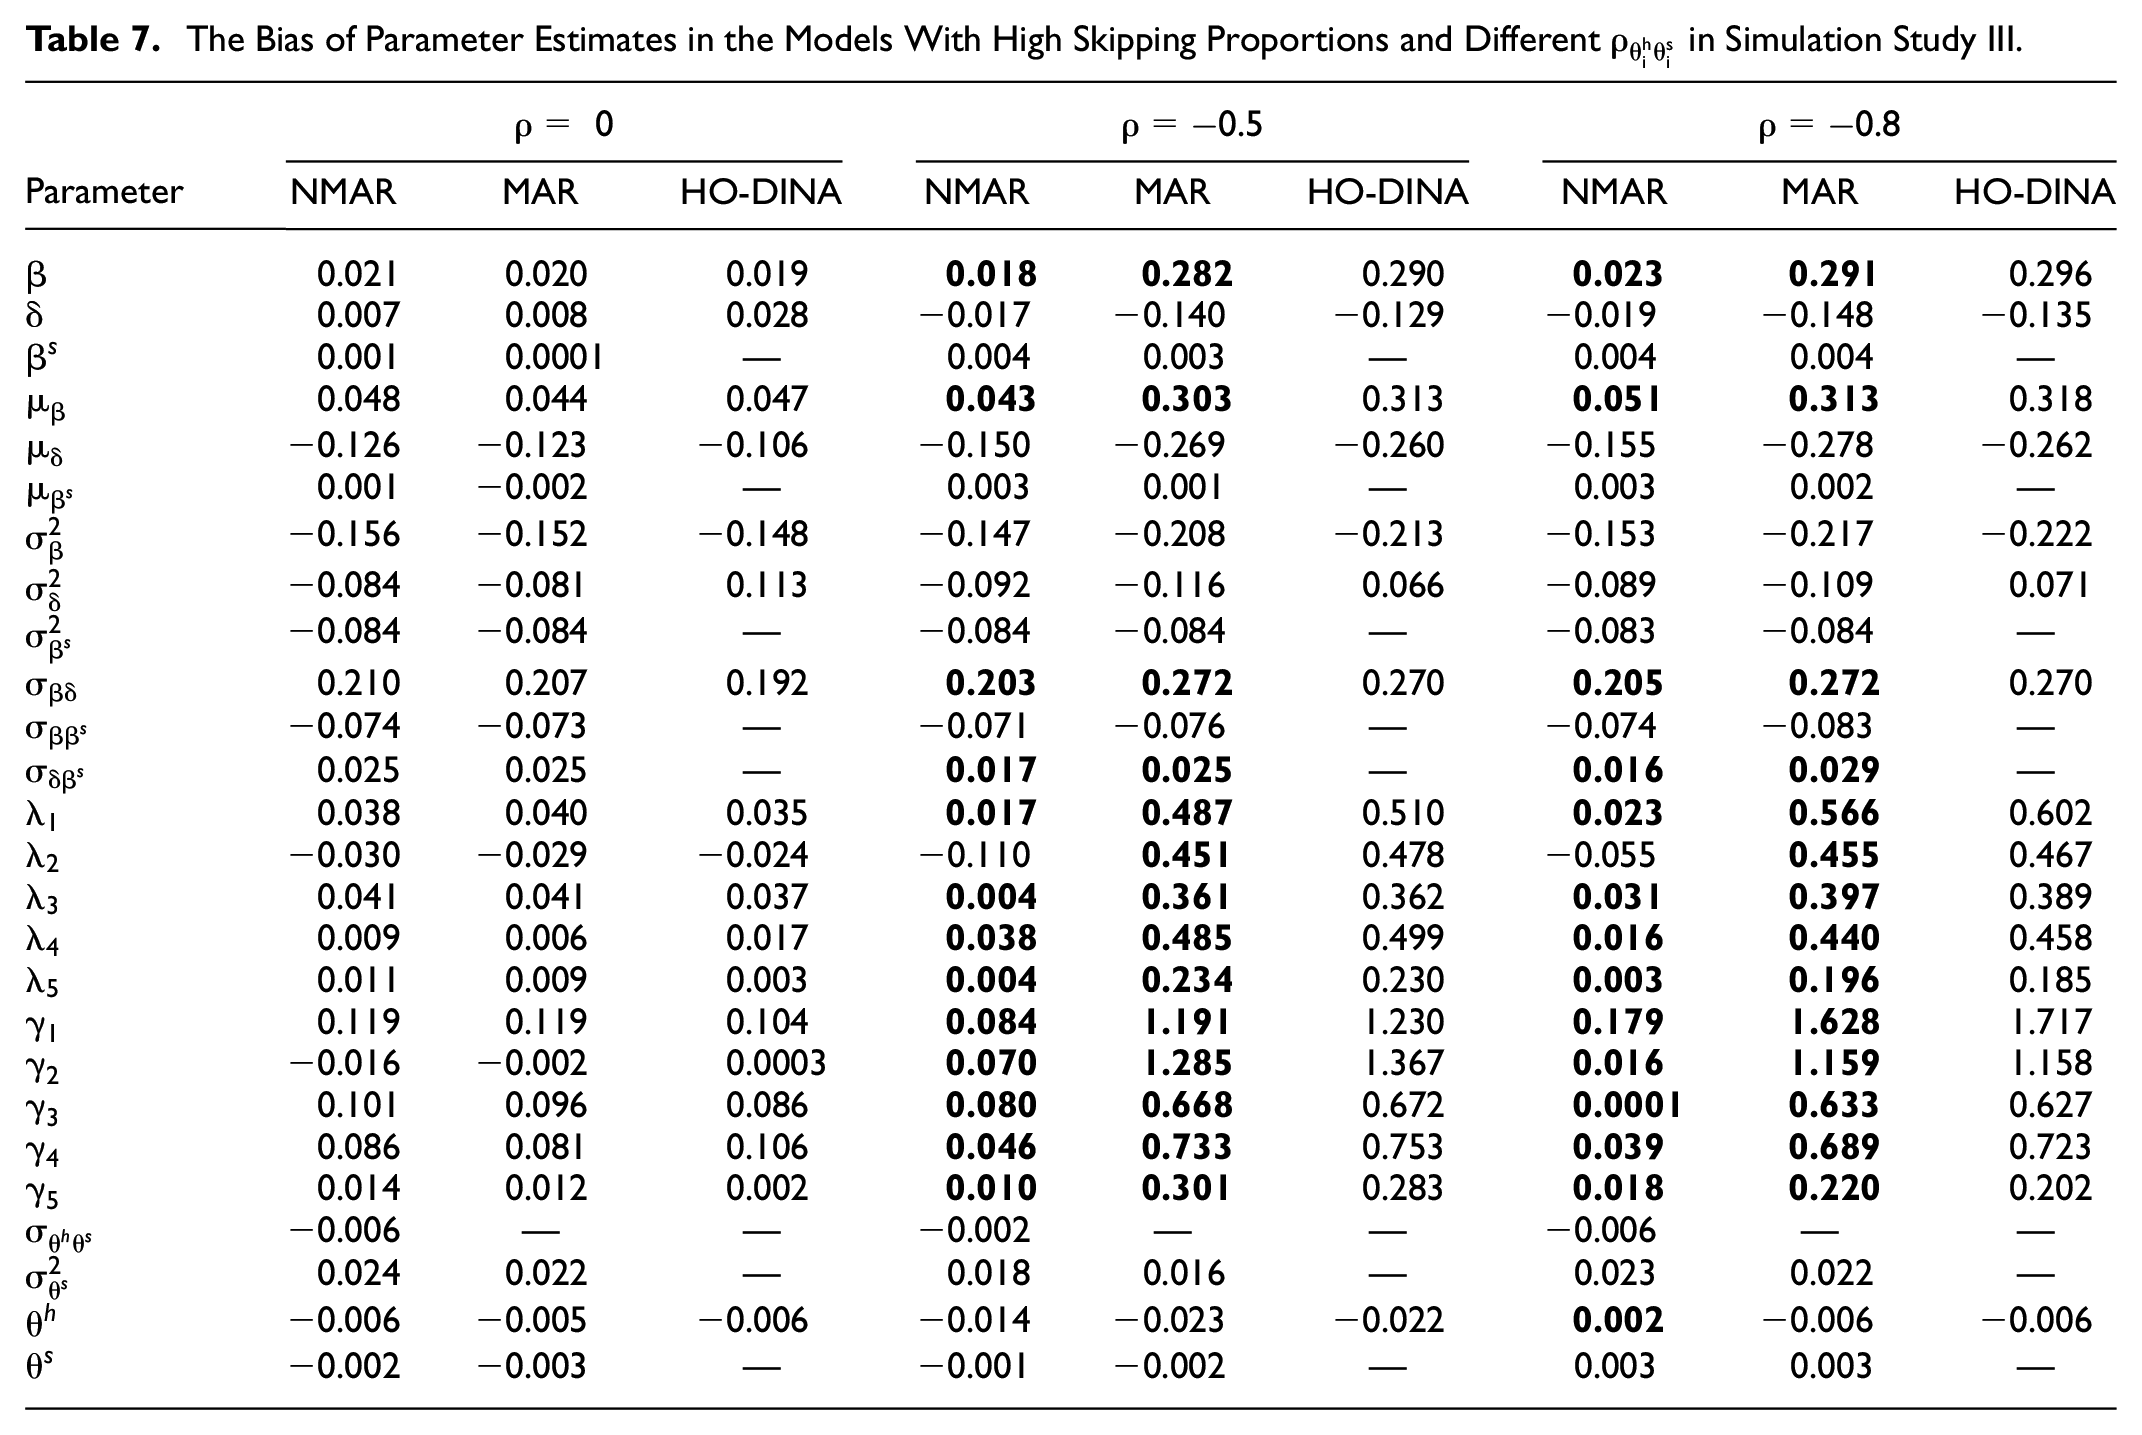
For the conditions with a high skipping proportion, as presented in Tables 7 and 8, we observed similar results to those observed in conditions with low skipping proportions. Across both scenarios, the NMAR model consistently outperformed the other two models, particularly in the accuracy of person and item parameter estimates. Attribute parameter estimation also displayed notable differences among the three mechanism models, highlighting the NMAR model’s superior performance.
The Bias of Parameter Estimates in the Models With High Skipping Proportions and Different
The RMSE of Parameter Estimates in the Models With High Skipping Proportions and Different

The bold elements in the table highlight significant differences in the results.
Figures 3 and 4 show the bias of attribute parameters

Bias of parameter estimates about

Bias of parameter estimates about

RMSE of parameter estimates about

RMSE of parameter estimates about
Figure 7 presents the ACCRs and PCCRs in the NMAR and MAR models under six simulation conditions: low and high skipping proportions, as well as low, medium, high correlations between
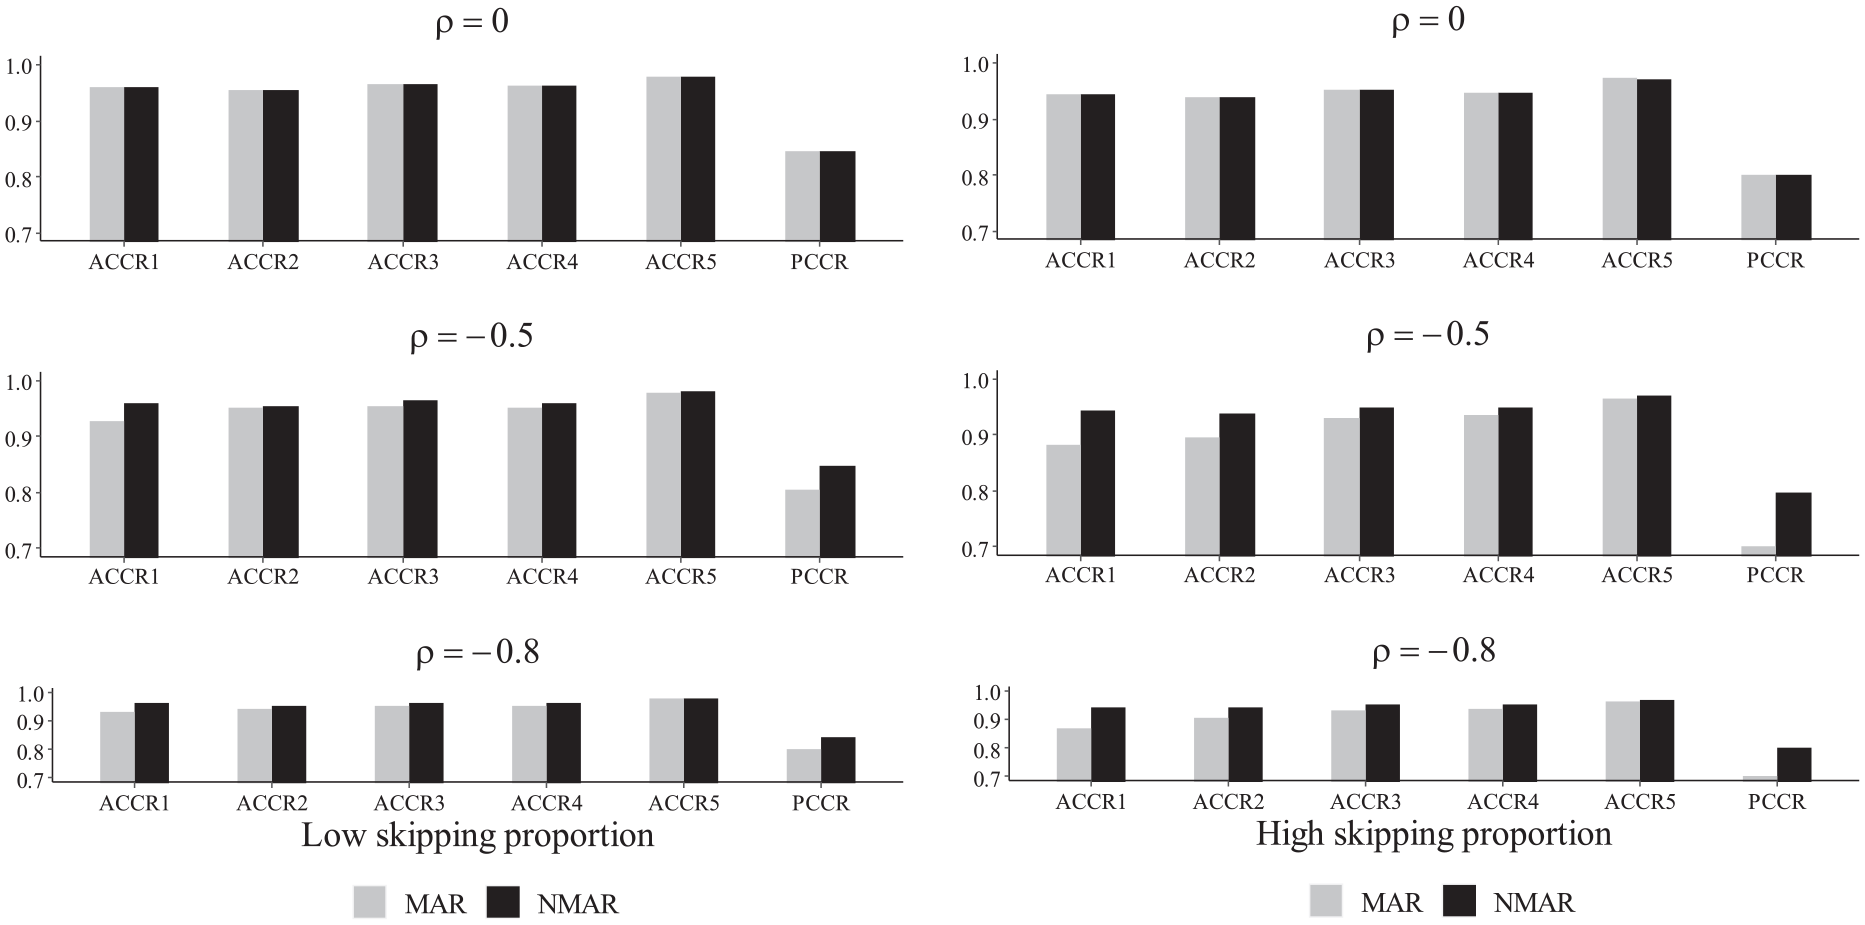
The ACCRs and PCCRs for MAR and NMAR models in simulation study III.
In brief, our results consistently indicate that the NMAR model outperforms both the MAR model and the HO-DINA model, regardless of whether the skipping proportion is high or low, or whether the person correlations are strong or weak. Furthermore, across all scenarios, the NMAR model consistently achieves higher ACCRs and PCCRs compared to the other models. This highlights that the NMAR model excels in delivering more precise parameter estimation and attribute profiles.
Simulation Study IV
In simulation study IV, our aim was to conduct the model selection using Bayesian model assessment criteria, namely, DIC and LPML, based on the six conditions from simulation III. We used 500 examinees who answered 30 items with five attributes. The model selection results are shown in Table 9. There were no significant differences in DIC and LPML among the models when
Model Selections Under Different
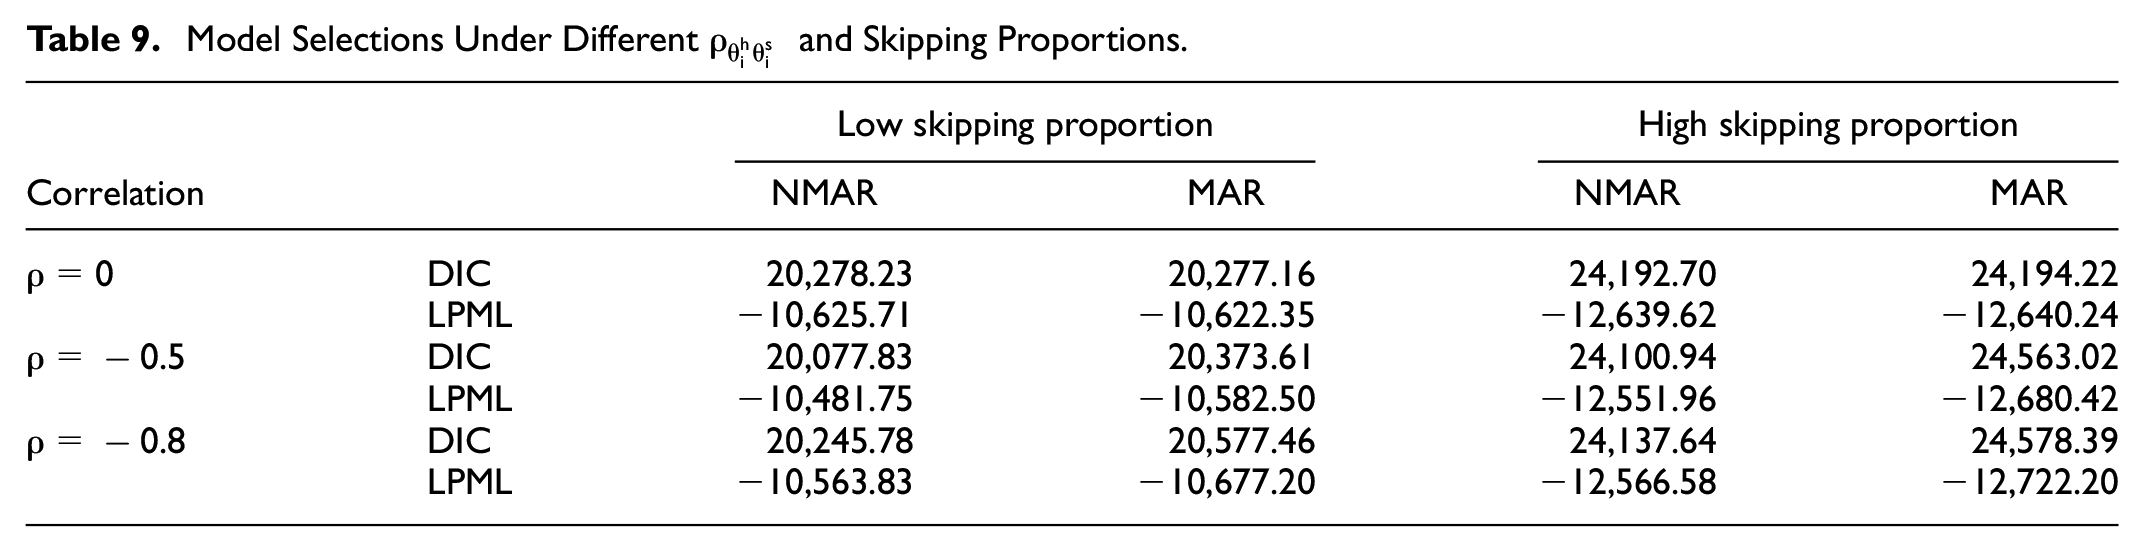
In conclusion, the results demonstrate that under various conditions, the NMAR model provides a better fit to the data compared to the MAR model, as evidenced by DIC and LPML values.
Empirical Example
We analyzed the data from the computer-based PISA 2018 mathematics cognitive test in Albania. According to the 2018 PISA mathematics assessment framework, four attributes belonged to mathematical content knowledge: change and relationship
The Q Matrix in the Real Data.

Tables 11 and 12 show the parameter estimates and standard deviations of the person, item, and attribute parameters. The results indicate that the estimated correlation coefficient between the higher-order ability and skipping ability parameter
Estimates and Standard Deviations of the Parameters for the Real Data.

Note. Est. = estimated value; SD = standard deviation of the posterior distribution.
Estimates and Standard Errors of the Item Parameters for the Real Data.
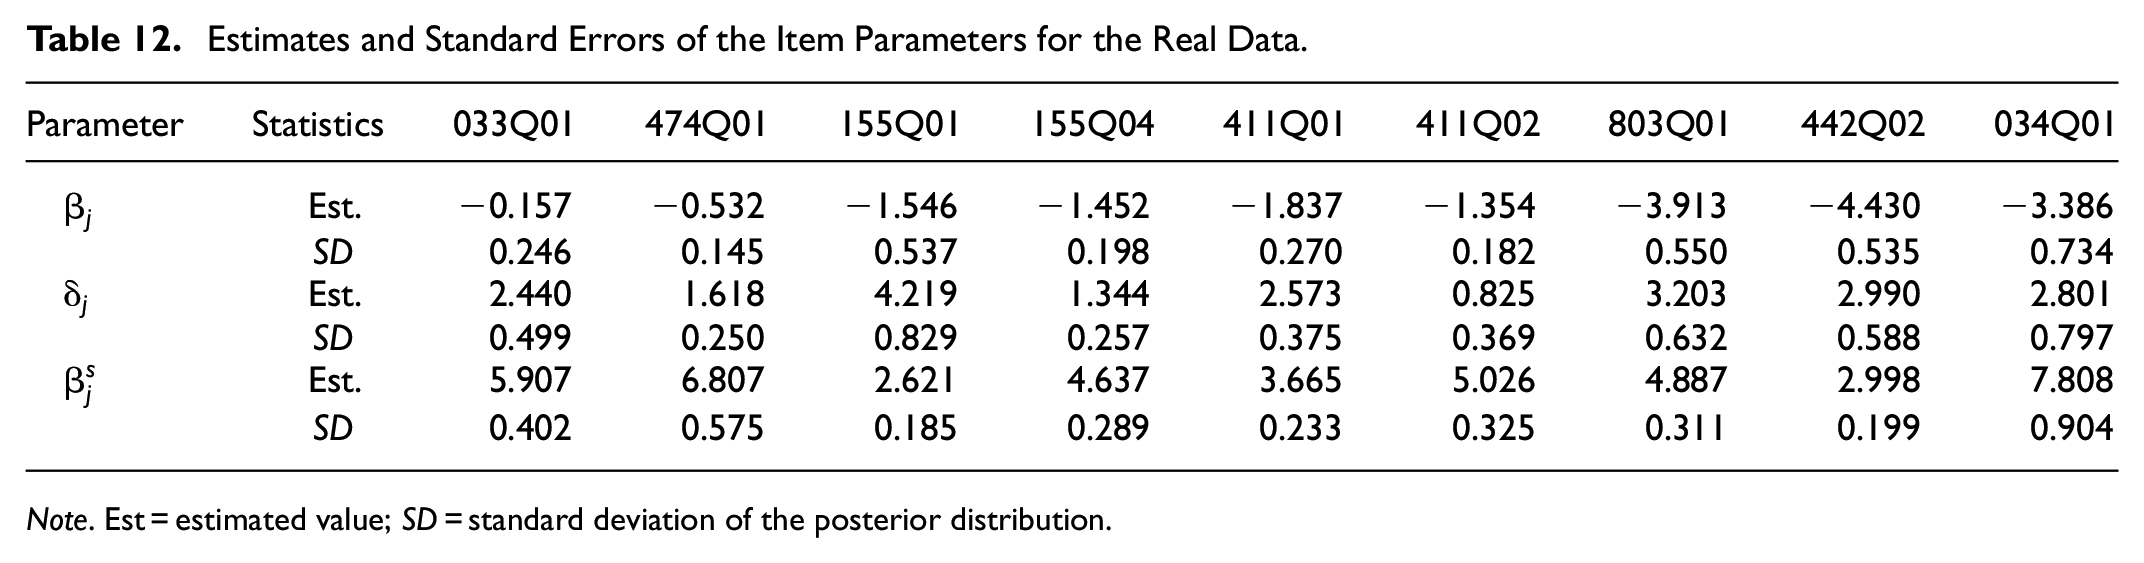
Note. Est = estimated value; SD = standard deviation of the posterior distribution.
Discussion
This study addresses the prevalent issue of item-level missing data in cognitive diagnostic assessments, where examinees skip certain items. Such missing data poses a risk of providing inaccurate diagnostic feedback and may lead to biased outcomes when compared to those with complete data. Therefore, this study aims to develop a missing data model for skipped items, ultimately providing more accurate cognitive feedback for examinees. This not only facilitates a deeper comprehension of individual cognitive processes but also furnishes more robust data support for educational policies and practices.
Our proposed model combines the DINA model, which captures responses, and the 1PLM, which represents the missing indicator model. A bivariate normal distribution for person parameters and a multivariate normal distribution for item parameters were used to capture the relationships between these two models in a higher-level framework. Our model not only strives for more precise knowledge structures derived from diagnostic feedback but also sheds light on examinees’ response behaviors, offering valuable insights into their cognitive processes.
We employed the Bayesian MCMC algorithm to estimate the model parameters. Through comprehensive simulation studies, we found our model consistently yielded more accurate parameter estimates compared to other methods. These simulation studies also facilitated an in-depth evaluation of the model’s performance, considering various missing mechanisms, proportions of skipped items, and correlations between higher-order ability and potential skipping tendency. Under these diverse simulation scenarios, our model consistently demonstrated reliable estimation accuracy. Furthermore, the HO-DINA model, which characterizes examinees’ cognitive attributes, further enhanced the accuracy of our parameter estimates. Notably, we observed substantial improvements in ACCRs and PCCRs, specifically, ACCRs and PCCRs were significantly higher in the NMAR model, indicating that our model better fits non-ignorable missing data mechanisms. To demonstrate the practical applicability of our model, we successfully applied it to the PISA 2018 computer-based test.
While this study offers valuable insights, it comes with certain limitations, suggesting potential directions for future research. Firstly, it’s essential to consider time constraints as a factor contributing to item skipping. Secondly, we have not explored other potential reasons for skipped items in cognitive assessments. Future research should delve into these additional factors. Lastly, cognitive assessments frequently exhibit various types of item nonresponses, including not-reached and skipped items. Future research could refine our model to address these diverse missing data scenarios.
Conclusion
In this study, we introduced a novel model to address skipped items in cognitive diagnostic assessments, combining the missing data model with the item response model under a cohesive hierarchical structural framework. By leveraging the Bayesian MCMC algorithm, robust parameter estimation results are obtained.
Extensive simulations demonstrated the superior performance of our model across a range of scenarios, consistently producing highly accurate parameter estimates. Notably, our model exhibited a significant advantage in ACCRs and PCCRs when compared to the NMAR and MAR models, particularly in the presence of non-ignorable missing data.
The validation of our model using the 2018 PISA mathematics dataset further highlights its practical effectiveness. Our research has profound implications for cognitive diagnostic assessments, offering a transformative approach that addresses skipped items comprehensively. It lays the foundation for potential advancements in the field, promising more accurate and insightful assessments in the future.
Supplemental Material
sj-docx-1-sgo-10.1177_21582440241288005 – Supplemental material for Modeling Skipped Items in Cognitive Diagnostic Assessments
Supplemental material, sj-docx-1-sgo-10.1177_21582440241288005 for Modeling Skipped Items in Cognitive Diagnostic Assessments by Lidan Liang, Jing Lu, Jiwei Zhang and Guanghui Cheng in SAGE Open
Footnotes
Appendix: Details of the MCMC Algorithm for the Proposed Model
Let
Following Patz and Junker (1999), a M-H algorithm is employed, and the acceptance rate
and
and
and
and
the posterior distribution is
where
and
and
and
and
and
and
and
Acknowledgements
The authors are greatly indebted to the Editor, Associate Editor and three reviewers for their valuable comments and suggestions.
Correction (October 2024):
Article updated to correct the affiliation of Jiwei Zhang from 1 to 2 in the affiliation section.
Declaration of Conflicting Interests
The author(s) declared no potential conflicts of interest with respect to the research, authorship, and/or publication of this article.
Funding
The author(s) disclosed receipt of the following financial support for the research, authorship, and/or publication of this article: This research was supported by the general projects of National Social Science Fund of China on Statistics (Grant No. 23BTJ067).
Data Availability Statement
Supplemental Material
Supplemental material for this article is available online.
References
Supplementary Material
Please find the following supplemental material available below.
For Open Access articles published under a Creative Commons License, all supplemental material carries the same license as the article it is associated with.
For non-Open Access articles published, all supplemental material carries a non-exclusive license, and permission requests for re-use of supplemental material or any part of supplemental material shall be sent directly to the copyright owner as specified in the copyright notice associated with the article.