
Abstract
An increasing number of studies have shown that several factors other than food and drink itself, such as design of packaging, cutlery and plateware, slightly but significantly affect taste/flavor perception of food and drink. This study aimed to broaden the knowledge by investigating the influence of the color of the plateware both on expectation and perception of chocolate taste/flavor by applying a between-participants design. Participants (48 Japanese university students) were presented with four different chocolates, and rated their expected (pre-tasting) and perceived (post-tasting) taste/flavor of the chocolates. While half of the participants were presented with the chocolates on red platewares, the other half on black platewares. The results showed that, whereas the chocolates were expected as more bitter when presented on the red plateware than the black plateware, they were perceived as sweeter when tasted from the red plateware than the black plateware. The observed discrepancy between pre-tasting expectation and post-tasting perception cannot be simply explained by sensation transference (i.e., expectation assimiliation), which would have predict that both expected and percieved sweetness would be enhanced in the red plateware condition. Possible explanations and practical implications are also discussed.
Plain language summary
This study aimed to investigate the effect of the color of plateware on taste perception of chocolates. Participants were asked to taste and evaluate chocolates either from a red or black plateware. Even though the chocolates were expected as more bitter when presented on the red plateware, they were perceived as sweeter when tasted from the red plateware than the black plateware.
Introduction
Taste/flavor perception of foods and drinks is generally believed to be determined by gustatory and olfactory processing of their physical and chemical properties. However, recent evidence from the broad domain of sensory science and psychology has proved that this belief is not valid. Taste/flavor perception of foods and drinks is significantly affected by contextual and multisensory factors that surround us when we eat and drink, such as the order of tasting (Kamenetzy, 1959; Sakai et al., 2001), background music (Fiegel et al., 2014; Wang et al., 2017), prices (Plassmann et al., 2008), brand information and brand logos (Allison & Uhl, 1964; McClure et al., 2004; Onuma et al., 2014), and exercise of choice (Onuma & Sakai, 2019). Therefore, to fully understand the nature of taste/flavor perception of foods and drinks, the influence of contextual and multisensory factors should be elucidated (Spence, 2015).
From this viewpoint, some researchers have investigated the influence of the color of the plateware on taste/flavor perception. For instance, one of the earlier study has shown that a salty-taste popcorn served in a red bowl was perceived sweeter than when served in a white bowl, whereas a sweet-taste popcorn served in a blue bowl was perceived saltier than when served in a white bowl (Harrar et al., 2011). Other studies have also shown that the color of plateware or cups modulated taste/flavor perception of hot chocolate beverages (Piqueras-Fiszman & Spence, 2012), fruit-flavored carbonated beverages (Mielby et al., 2018), strawberry mousse (Piqueras-Fiszman et al., 2012), café latte (Van Doorn et al., 2014), specialty coffee (Carvalho & Spence, 2019), and so on.
While there are several suggested explanatory mechanisms for these findings from a recent review (Spence, 2018), one plausible explanation can be made in terms of sensation transference; what people think or feel about one attribute of a stimulus often transfers to another attribute of the stimulus (Cheskin, 1957; Spence, 2019b). For instance, Kampfer et al. (2017) asked their participants to taste and evaluate chocolate (Study 1) and soda (Study 2) products, with the weight of product packages being manipulated. The result showed that the perceived flavor intensity was enhanced when the participants tasted the product from the heavier package compared to when they tasted from the lighter package. Interestingly, the enhanced flavor intensity had a positive indirect effect on overall flavor (i.e., quality) evaluation and willingness to pay for the product. These results indicate that the perceived heaviness of product package was transferred to the perceived intensity of the flavor, which in turn favored the quality evaluation of the product.
In the case of sensation transference by color, associations between colors and taste/flavor attributes play a crucial role. One of the most consistent findings is that the color red is associated with the sweet taste. O’Mahony (1983) asked participants to match four basic taste terms (i.e., bitter, salty, sour, and sweet) with colors and found that the color red was reliably matched with the term sweet. The red-sweet association has been continuously replicated by the subsequent studies (Koch & Koch, 2003; Tomasik-krótki & Strojny, 2008), although in Wan et al. (2014) the color pink was more reliably matched with the term sweet. More recently, Saluja and Stevenson (2018) tested the color-taste association by using real taste stimulus, not taste terms. In their experiment participants were required to sample five basic taste solutions and select their best matching color from a color wheel. The results showed that the sweet taste was consistently matched with the color red and pink, again supporting the red-sweet association.
The color-associated taste property can be transferred to the perceived sweetness of food or drink. Johnson and Clydesdale (1982) asked their participants to taste and rate colored sucrose solutions with varying concentrations of colorant and sucrose, and revealed that the color red linearly enhanced the sweetness perception of the solution. This result indicates that the red-associated sweetness expectation can be transferred to the actual sweetness. Similar result can be observed even when the color-taste association was elicited by stimuli other than food or drink itself. For instance, Harrar et al. (2011) have demonstrated that a popcorn served in a red bowl was perceived sweeter than when served in a white bowl. This result indicates that when individuals see the red colored background (e.g., bowl or plateware), sweet taste expectation would be automatically activated because of the red-sweet associations, and then the expectation would be transferred to the evaluation of actual sweet taste of food or drink, leading to the sweetness enhancement.
As described above, scientific evidence demonstrating the influence of the color of the plateware on taste/flavor perception has been growing over the years. However, there is still a need for further research for the following reasons. First, the majority of the previous studies examining the color influence focused solely on post-tasting taste/flavor perception (Harrar et al., 2011; Mielby et al., 2018; Piqueras-Fiszman et al., 2012; Piqueras-Fiszman & Spence, 2012; Van Doorn et al., 2014), but the study elucidating the role of pre-tasting expectation on the color influence is relatively sparse (c.f. Carvalho & Spence, 2019). Since sensation transference is the phenomenon where pre-tasting expectation elicited by the containers is transferred to post-tasting perception of food itself (Spence, 2019b), not only post-tasting rating but also pre-tasting rating should be also carefully investigated.
Second, the majority of the previous studies have investigated the influence of the color of the plateware in a within-participants design, where the same participants were asked to taste and evaluate the same (but putatively different) foods/drinks from different platewares (e.g., Harrar et al., 2011; Mielby et al., 2018; Piqueras-Fiszman et al., 2012; Piqueras-Fiszman & Spence, 2012; see also Spence, 2018). The researchers might have opted for a within-participants design, rather than a between-participant design, since it enabled researchers to examine the influence of the plateware directly. Researchers can be sure that their results are due to their experimental manipulation (i.e., plateware), not to individual differences among participants. However, it should be noted that such design is ideal for researchers but quite unnatural for participants; in our daily lives, we rarely taste and compare the same foods/drinks from different platewares at the same time. If participants cannot detect any taste/flavor difference among putatively different foods/drinks, they would inevitably pay attention to the plateware, which is the only salient difference there (Spence & Velasco, 2019). Therefore, to precisely understand the influence of the color of the plateware on taste/flavor perception, further research not only with the within-participants design but also with the between-participants design is needed.
Based on these motivations, the present study aims to investigate the influence of the color of the plateware both on expectation and perception of taste/flavor by applying a between-participants design. In this experiment, participants were presented with a variety of chocolates and rated their expected and perceived taste/flavor. Half of the participants were presented with the chocolates on the red plateware, whereas the other half on the black plateware. As described above, it has been established that the color red is reliably associated with a sweet taste (Koch & Koch, 2003; O’Mahony, 1983; Saluja & Stevenson, 2018; Tomasik-krótki & Strojny, 2008; Wan et al., 2014). Furthermore, in the Japanese market the product packages of sweet milk chocolates are usually colored red (and sometimes brown), whereas those of bitter dark chocolates are often colored black. This custom in the market might have strengthened the association between the color red and a sweeter taste (and an association between the color black and a less sweet taste) among Japanese consumers, especially in the context of chocolate consumption. These red-sweet associations would be activated when the chocolates are presented with the red plateware. Therefore, in the present study it was hypothesized that the chocolates would be expected and perceived as sweeter when presented on the red plateware compared to when presented on the black plateware.
Methods
Participants
This experiment included 48 Japanese university students (19 females and 29 males;
Materials
Four different chocolates available on the Japanese market (“Look4 chocolate collection” FUJIYA Co., LTD., Tokyo, Japan) were presented as taste stimuli. The chocolates deferred in their cacao concentration: 27%, 40%, 55%, and 70%. Depending on the experimental conditions, the chocolates (7 g each) were presented either on red or black small silicone cups (53 mm diameter with 23 mm height, TATSUMIYA Co., LTD., Ishikawa, Japan) (Figure 1).

In the experiment, participants were presented with the four different chocolates (from left to right, chocolate with 27%, 40%, 55%, and 70% cacao concentration) placed either (a) on the red silicone cups in the red plateware condition or (b) on the black silicone cups in the black plateware condition.
Procedure
In the beginning, participants were given a cover story: the experiment aimed to investigate Japanese consumers’ attitudes and preferences for chocolate products. After a brief explanation of the procedure, the participants were asked to rate how much were they hungry at that time with a 100 mm visual analog scale (VAS) printed on the paper questioner. The scale was anchored “very full” on the left and “very hungry” on the right. Then, participants were asked to rate how much did they like chocolate products in general (i.e., chocolate preference) and how often did they consume chocolate products in their daily lives (i.e., consumption frequency) on 7-point scales.
Once the initial assessment had been completed, the participants were presented with one of the four chocolates placed on either the red or the black silicone cups, depending on the experimental condition. The participants were asked to expect its liking, sweetness, bitterness, and odor intensity, and rate them on a 100 mm VAS on the paper questioner (pre-tasting rating). Then, the participants were asked to taste the chocolate, and rate its liking, perceived sweetness, bitterness, and odor intensity (post-tasting rating). The scale for liking was anchored “do not like at all” on the left and “like very much” on the right. The scales for sweetness, bitterness, and odor intensity were anchored “not at all” on the left and “very strong” on the right. This procedure was repeated for the four chocolates. The order of presentation of the chocolates was fully counterbalanced across the participants. Each tasting was separated by about 3 min, including mouth rinsing with mineral water (“ILOHAS,” Coca-Cola (Japan) Company, Ltd., Tokyo, Japan).
After the tasting sessions, participants were required to verbally report anything special they had felt or noticed during the experiment. After this, they were informed of the real purpose of the investigation. However, no one reported that they had noticed the true purpose of this experiment.
Data Analysis
To obtain the participants’ pre- and post-tasting ratings, the length (mm) from the left edge of the VAS to a mark participant had made measured for each evaluation. In total, 1,536 observations were obtained (48 participants × 2 phases of rating × 4 chocolates × 4 rating attributes). Following Leys et al. (2013), median plus or minus 2.5 times the Median Absolute Deviation (MAD) method was used for outlier detection. More specifically, the MADs for each subgroup of rating data among the experimental conditions, phases of rating (i.e., pre- vs. post-tasting), and the variety of chocolates were calculated and used. As a result, 30 (13 pre- and 17 post-tasting rating) and 21 (7 pre- and 14 post-tasting rating) observations were excluded as outliers in the red and black plate conditions, respectively.
All data obtained in this study were analyzed using statistical software R [Version 4.1.2; R Core Team (2020)]. To properly treat multiple sources of random variation, linear mixed models were adopted (Judd et al., 2017). Together with the fixed factor, the plate color (i.e., the red plate vs. black plate condition), several random factors were specified. First, to consider variability caused by participants recruited and samples used, the ID of the participants and the identity of the chocolate samples were both set as random intercepts. Second, to consider response variability caused by the participants’ chocolate preference and consumption frequency, these variables were both specified as random intercepts. Moreover, participants’ response toward each chocolate sample could vary according to the extent of their chocolate preference and consumption frequency, hence the identity of the chocolate samples was also specified as random slope for both chocolate preference and consumption frequency. Lastly, considering the possibility that the participants’ hunger state before the participation could change their responses toward the chocolate samples, the participants’ rating of hunger state was specified as random intercept. The linear mixed modeling was performed using the lmer function in the lmerTest package (Kuznetsova et al., 2017). The estimated marginal means of each rating were calculated using the emmeans function in the emmeans package (Lenth, 2020).
Based on recent criticisms of the dichotomous interpretation of the result in conventional “significance” testing (Amrhein et al., 2019; Amrhein & Greenland, 2022), in this study, the estimated effects of the fixed factors were evaluated comprehensively by multiple statistics. We calculated the test statistic, t-value, and the probability, p-value, of obtaining the test statistics under the null hypothesis for the point estimates, and estimated the 95% confidence interval (95% CI) for the effect size. Furthermore, we calculated the counternull value: an effect size supported by the same amount of evidence as the null value (i.e., no mean difference) (Rosenthal & Rubin, 1994). The counternull value reminds us of the fact that the assertion that the obtained effect size is not significantly different from zero is no more true than the assertion that the obtained effect size is not significantly different from the counternull value (Rosenthal & Rubin, 1994). These calculations and estimations were performed using the conf_dist function in the pvaluefunctions package in software R (Infanger, 2021). Following the literature, this study reported estimated coefficient of the color effect with its p-value on various test hypotheses including the null hypothesis (i.e., the coefficient is 0), and the counternull value in the subsequent section.
Results
Chocolate Preference and Consumption Frequency
To exclude the possibility that there was a base-line group difference of attitude toward chocolate products, chocolate preference and consumption frequency were measured and compared. As can be seen in Table 1, there was no difference for chocolate preference and consumption frequency between participants in the red and black plate conditions, indicating that the subsequent results cannot be simply attributed to the group difference other than the manipulation of the color of plateware.
Mean (±SE) of Chocolate Preference and Consumption Frequency Between Participants in the Red and Black Plate Conditions.

Pre-Tasting Rating
To examine the effect of the color of the plateware on taste/flavor expectation of the chocolates, estimated marginal means of the pre-tasting ratings were calculated (Table 2).
Estimated Marginal Means (±SE) of Pre-tasting Ratings in the Red and Black Plate Conditions.

Statistics obtained from the linear mixed modeling are shown in Table 3, and their p-value functions are shown in Figure 2. The most evident difference observed here was for the bitterness rating: the expected bitterness rating for the red plate condition was 9.17 point higher than for the black plate condition (95% CI: [0.66, 17.68],
Results of the Linear Mixed Modeling Evaluating the Fixed Effect of the Plate Color (the Effect of Red Plate Condition Against the Black Plate Condition) in the Pre-tasting Rating.


P-value functions of the estimated coefficient of the red plate condition in the pre-tasting rating. The top values of the curves represent point estimates of the fixed effect. The vertical lines show the null value (i.e., true effect = 0). The circles with values represent the counternull values. The dashed horizontal lines show the conventional “significance” threshold (i.e., p = .05), and the area above shows 95% CI of the estimated mean difference.
Post-Tasting Rating
To examine the effect of the color of the plateware on taste/flavor perception of the chocolates, estimated marginal means of the post-tasting ratings were calculated (Table 4).
Estimated Marginal Means (±SE) of Post-tasting Ratings in the Red and Black Plate Conditions.

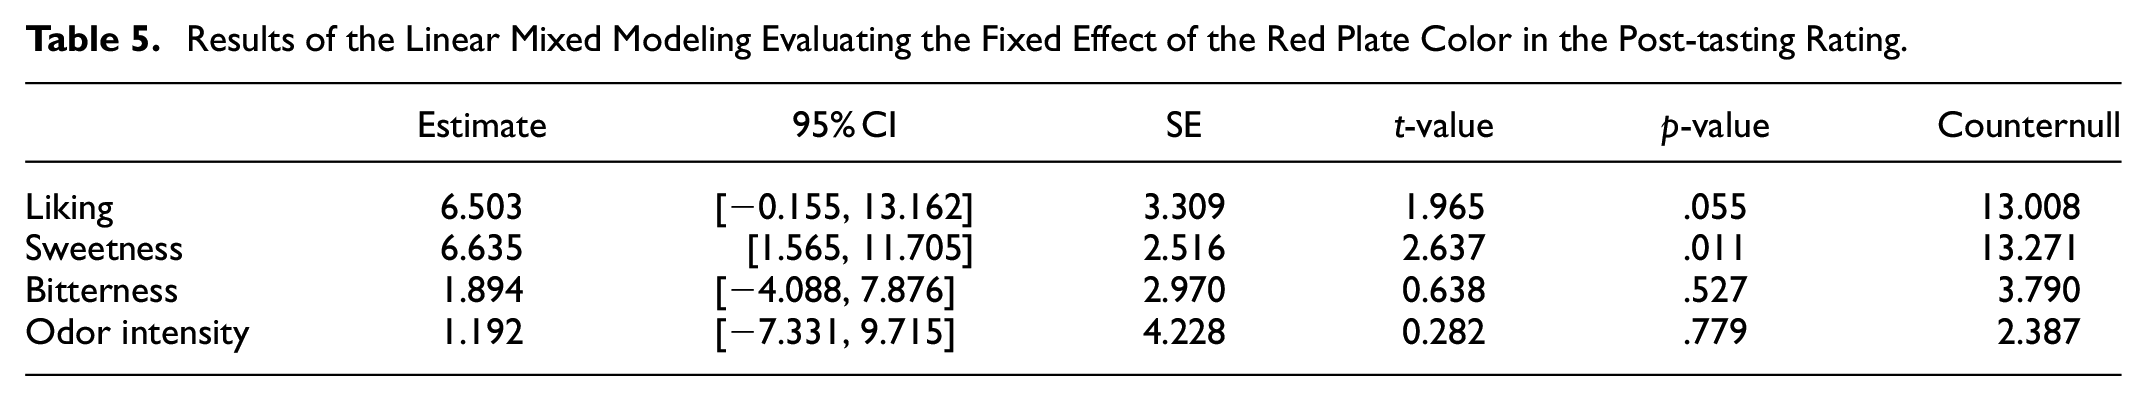
Statistics obtained from the linear mixed modeling are shown in Table 5, and their p-value functions are shown in Figure 3. The most evident difference here was for the sweetness rating, being 6.64 point higher for the red plate condition than for the black plate condition (95% CI: [1.56, 11.70],
Results of the Linear Mixed Modeling Evaluating the Fixed Effect of the Red Plate Color in the Post-tasting Rating.

P-value functions of the estimated coefficient of the red plate condition in the post-tasting rating. The top values of the curves represent point estimates of the fixed effect. The vertical lines show the null value (i.e., true effect = 0). The circles with values represent the counternull values. The dashed horizontal lines show the conventional “significance” threshold (i.e., p = .05), and the area above shows 95% CI of the estimated mean difference.
Discussion
The results demonstrated that, as predicted by the previous studies showing the red-sweet association (Koch & Koch, 2003; O’Mahony, 1983; Saluja & Stevenson, 2018; Tomasik-krótki & Strojny, 2008; Wan et al., 2014), the chocolates were perceived as sweeter when tasted from the red plateware than the black plateware. However, when it comes to the expectation rating prior to tastings, the results were opposite; the chocolates were expected as more bitter when they were presented on the red plateware than the black plateware. This discrepancy between expectation and actual perception could not be simply explained by sensation transference, where specific taste/flavor expectation activated by plateware transfers to the actual taste/flavor perception (Spence, 2019b).
Regarding the pre-tasting rating, it was hypothesized that the chocolates would be expected as sweeter when they were presented on the red plateware than the black plateware because the color red is known to be associated with sweet taste (Koch & Koch, 2003; O’Mahony, 1983; Saluja & Stevenson, 2018; Tomasik-krótki & Strojny, 2008; Wan et al., 2014). However, this hypothesis was not supported; rather, the opposite results were obtained showing that the chocolates were expected as more bitter and less sweet when they were presented on the red plateware. It is possible that the brownness of the chocolates was intensified when the chocolates were placed on the lighter, red plateware compared to when the chocolates were placed on the darker, black plateware, as a result of color contrast (Jameson & Hurvich, 1959). Similar result was found in Piqueras-Fiszman et al. (2012); a strawberry mousse served on a white (lighter) plate was rated as having more intense flavor than the identical mousse served on a black (darker) plate. Therefore, in this study, the greater contrast in the red plate condition might have intensified the dark brown color of chocolates, resulting in that the chocolates were expected as more bitter and less sweet than in the black plate condition.
After tasting, on the other hand, the chocolates were rated as sweeter when tasted from the red plateware than the black plateware. One possible explanation for this oppositely directed change can be made from expectation disconfirmation (Cardello & Sawyer, 1992). Cardello and Sawyer (1992) asked their participants (in Experiment 2) to taste and evaluate a pomegranate juice while manipulating the participants’ sensory and hedonic expectation about the juice. Their results showed that, when the participants had been manipulated to expect the juice as very bitter, the juice was perceived as less bitter compared to when such expectation had not been made. This indicates that the violated sensory expectation can shift the actual perception toward the unexpected direction. In the present study, given that the chocolates were expected to be more bitter (and less sweet) than usual because of their intensified dark brown color in the red plate condition, the participants’ expectation might have been violated to some extent (i.e., less bitter/more sweet than expected). Such “positive surprise” could have highlighted the perception of the unexpectedly less bitter (and much sweeter) taste of the chocolates, and it may have resulted in sweetness enhancement and increased liking in the red plate condition. However, even if the expectation disconfirmation was the case, it is still unclear why the post-tasting bitterness rating did not decrease whereas the post-tasting sweetness rating increased.
Another, and more intriguing, possibility is that plateware color exerts multiple and different influences according the time course of food consumption. In the present study, when participants rated their expectations prior to tasting, the chocolate was placed on a colored plate. This means that the participants made their pre-tasting ratings while looking at chocolates on the plate. However, after tasting, the chocolate was no longer left on the plate (note that all the participants ate the chocolates by a single bite because of its small size), and the plate might have been the only visually salient stimulus there. At this moment, there was no color contrast between the chocolates and the background plate color; thus, the red color of the plateware might have anchored participants’ attention to the red-associated sweetness of the chocolates they were tasting. To elucidate this possibility, future research could examine color influence by manipulating whether the colored plate would remain or be removed after the consumption of food stimuli. In any cases, the present findings suggest that future research could broaden our knowledge of the plate color influence by carefully investigating the effect on expectation and perception according to the time course of consumption.
It is worth remembering that these results cannot be explained by the experimenter expectancy effect or task demands, since the participants in this study were exposed to either of the red or black plateware (unlike a typical within-participants design where participants are exposed to both of them). Thus, it was hard for them to realize the real research purpose (i.e., the influence of the color of the plateware). Noteworthy, the result here is obtained in a more naturalistic setting compared to the previous studies applying the within-participants design (Carvalho & Spence, 2019; Harrar et al., 2011; Mielby et al., 2018; Piqueras-Fiszman et al., 2012; Piqueras-Fiszman & Spence, 2012). Unlike the previous within-participants studies, which allowed their participants to pay attention to the plateware unusually, the present study had the participants just focus on the chocolates themselves. Therefore, the influence of the color of the plateware observed here can be thought of as having more ecological validity.
Practical Implications
As a practical implication for the domain of food industry, the findings of the present study can contribute to developing a strategy for making healthier foods and drinks without compromising their taste/flavor properties. Although there has been a globally growing requirement for a reduction in daily sugar consumption, merely reducing the sugar content of food products leads to decreased consumer acceptance (van Raaij et al., 2009). One possible way to resolve this contradiction is properly designing the color of the package or container so that such undesirable changes caused by sugar reduction are compensated in consumers’ brain. For instance, here in the present study, chocolates were perceived sweeter and liked more when they were served on a red colored container. This finding indicates that sugar-reduced foods can be better served on a package or container which is designed to enhance sweetness perception in the brain. Future research should further investigate strategies to enhance preferable but sometimes unhealthy taste/flavor quality, not only sweetness but also saltiness and fatty taste, by carefully designing several contextual factors existing in our eating environment.
Limitations and Future Directions
It should be noted that the present study has some limitations. First, although one of main contributions of this study was to elucidate the color influence with the between-participant design, the sample size was relatively small (24 participants for each group) compared to the related studies (Carvalho & Spence, 2019; Harrar et al., 2011; Johnson & Clydesdale, 1982; Kampfer et al., 2017; Mielby et al., 2018; Piqueras-Fiszman et al., 2012; Piqueras-Fiszman & Spence, 2012; Van Doorn et al., 2014). Given that the sample size met the minimum requirement of 20 observations per cell for psychological experiments (Simmons et al., 2011), this did not significantly undermine our findings. However, increasing the number of participants would enhance the validity and generalizability of the results. Second, the participants recruited in the present study were university students, which indicates that their response might have been to some extent homogeneous (Peterson, 2001). Since the color-taste/flavor association relies on prior eating experiences and associative learning (Spence, 2019a), it is worth investigating whether the color influence would be found in broader populations, not only in young university students. Third, the present study examined the color influence only on the two basic taste properties (i.e., sweetness and bitterness) and overall odor intensity. However, chocolate products have more than just sweet and bitter tastes, and they also have more complex matrix of flavor such as fruity, spicy, floral, cocoa and so on (Engeseth & Ac Pangan, 2018). It would be of greater practical importance for future research to elucidate the color influence on a broader range of basic taste and flavor which can be found in chocolates. For instance, our preliminary study (unpublished data) revealed that Japanese consumers associated the color tan with a nutty flavor. One can predict that the expectation and perception of nutty flavor would be enhanced when chocolates are presented on tan-colored plateware or packages. All these limitations should be addressed in future research.
For future research, it would be interesting to examine the role of individual differences on the color influence. For instance, Zampini et al. (2008) have shown that individual’s taste sensitivity can have a modulatory effect on how much individuals are affected by food color cue; flavor identification responses of participants with lower taste sensitivity (non-tasters) were significantly affected by the color of flavored solutions, whereas those of participants with higher taste sensitivity (supertasters) were not affected. Their results indicate that individuals with higher taste sensitivity can be less affected by the color of plateware because their gustatory sensation is more dominant and less susceptible to sensory inputs from other modalities, such as vision. Nevertheless, it is still unknown whether the taste sensitivity modulates the effect of the plateware color as it does the effect of the color of food/drink itself, therefore this point would be investigated in future.
Conclusions
The present study aimed to investigate the effect of the color of plateware both on the pre-tasting expectation and the post-tasting perception. The results showed that, as hypothesized by previous findings, the chocolates were perceived as sweeter when tasted from the red plateware than the black plateware. However, regarding the pre-tasting expectation, the chocolates were expected as more bitter when presented on the red plateware, which cannot simply be explained by sensation transference. Further empirical studies are still needed to disentangle the discrepancy between the color influence on expectation and perception.
Footnotes
Acknowledgements
The author would thank Mr. Shougo Izumi for his assistance in conducting the experiment.
Declaration of Conflicting Interests
The author declared no potential conflicts of interest with respect to the research, authorship, and/or publication of this article.
Funding
The author received no financial support for the research, authorship, and/or publication of this article.
Data Availability Statement
The data of this study are available from the corresponding author upon reasonable request.