
Abstract
China needs high-quality economic development while environmental problems are intensifying. The deteriorating resource and environmental situation have caused serious hindrances to economic and social development. Therefore, we decided to explore the primary causes of environmental pollution and resource waste and provide efficient solutions for future ecological management and environmental optimization. Our study is based on panel data of inter-provincial regions in China from 2011 to 2020 and uses a three-stage
Plain language summary
China needs high-quality economic development while environmental problems are intensifying. The deteriorating resource and environmental situation have caused serious hindrances to economic and social development. Therefore, we decided to explore the primary causes of environmental pollution and resource waste and provide efficient solutions for future ecological management and environmental optimization. Our study is based on panel data of inter-provincial regions in China from 2011 to 2020 and uses a three-stage DEA model to evaluate the level of environmental efficiency, the trend of change and its variability among regions under the same environment, which accurately and objectively reflects the true level of environmental efficiency of each region in China. The results found that: (1) The adjusted environmental efficiency levels of the inter-provincial regions in China change significantly. (2) Without the influence of external environmental factors and random error factors, the real environmental efficiency among provinces in China is significantly unbalanced. (3) There is a significant influence of external environmental variables on the actual environmental efficiency. Therefore, to further improve the level of environmental efficiency in China, it is imperative to encourage a wider range of market accessibility; optimize the industrial structure; learn from excellent development experiences; reasonably increase capital investment in environmental management; and improve the environmental awareness of enterprises.
Introduction
“Environmental efficiency” was first introduced in 1992 by the Global Governance and Sustainable Economic Development Forum (GGSEDF) and is used to evaluate the environmental impact of economic development (Song et al., 2013). It is calculated as the ratio of the economic value of products and services that meet human needs to the carrying capacity of the Earth’s environment and can provide quantitative environmental information to decision-makers.
During 2000 to 2020, with the increasing world population and economy scale, the total global energy consumption increased from 394.47 EJ (1 EJ = 1 trillion joules) to 556.63 EJ, up 41%. This dramatic expansion in the scale of energy is also contributing to greenhouse gas emissions, generating 8.5 billion tons of CO2 emissions over the same time, an increase of nearly 36%. Compared to year 2000, China’s total energy consumption has more than tripled and has surpassed that of the U.S. as the world’s largest energy consumer since 2009 (International Energy Agency, 2021). In 2020, China’s total energy consumption is already nearly twice than the U.S. and accounts for 26% of total global consumption. Although China continues to suffer from epidemics, energy consumption has rebounded rapidly as it opens its borders.
Over the past few decades, China has achieved remarkable social and economic development, with an annual
We believe that in the face of the deteriorating resource and environmental situation, it is necessary to effectively measure the environmental efficiency of China’s inter-provincial regions, measure the authenticity, changing trends, and variability of environmental efficiency, analyze the influencing factors of environmental efficiency, explore the primary causes of environmental pollution and resource waste, and provide efficient solutions for future ecological management and environmental optimization.
In recent years, environmental efficiency evaluation methods have been greatly enriched and expanded. However, statistical methods for further analysis of assessment results are rare. This not only leads to the problem of measuring the reliability of assessment values but also reduces their actual mining value. We collected environmental and economic data from different provinces in China between 2011 and 2020, and then used a three-stage
Theoretical Background
There are six well-known methods for measuring environmental efficiency. Previous studies used a nonlinear programming approach in the form of hyperbolic curves for data analysis, but the limitations of nonlinear programming made the operation extremely cumbersome, and the method was dubbed the hyperbolic method. Subsequently, the input method was proposed to perform data analysis with non-desired outputs as input variables (Atakelty & Veeman, 2001). The Investment Conversion method (Scheel, 2001) uses the inverse of the non-desired output as the desired output for data analysis. The conversion vector method (Seiford & Zhu, 2002) multiplies the non-desired output by −1 and then finds a conversion vector to ensure that the converted data are positive. the
Environmental issues have long been of concern to countries, such as studying the impact of competitiveness, bargaining power, and contract selection on environmental sustainability in Pakistan’s agricultural water market (Razzaq, Xiao, Zhou, Anwar, et al., 2022; Razzaq, Xiao, Zhou, Liu, et al., 2022). As some developed countries ahead of China have passed the stage of enhanced industrial development and entered the stage of environmental and economic joint development, these countries have engaged in environmental efficiency research earlier. Some studies use a microeconomic perspective, such as sectors and firms (Dirik et al., 2019; Park et al., 2018), but more at the macro level of countries, regions, and economies (Chen et al., 2019; Iram et al., 2020). Eighteen Central and Eastern European countries were examined, and the analysis found a negative effect between economic development and overall environmental quality (Saud et al., 2020). Fukuyama et al. (2020) used the two-stage network production model to measure the environmental efficiency of Japan and study the relationship between environmental efficiency and happiness in Japan. Twum et al. (2021) used the super-efficiency
In recent years, due to the increasing public awareness of the environmental problems caused by pollution, there have been many research papers on environmental efficiency assessment. Bai et al. (2018) used the hyper-efficiency
Based on the relevant literatures, we summarize as follows: (1) The current research on real environmental efficiency basically remains at the stage of analysis of theories and influencing factors. (2) Most of the literature on environmental efficiency in China uses the traditional
However, since the outputs of
Methodological Framework
The traditional
Stage 1: Efficiency Analysis of Traditional
At this stage, the

A traditional

Stage 2:
Data Adjustment
The values of stage 1 were obtained based on the traditional
Assuming the existence of


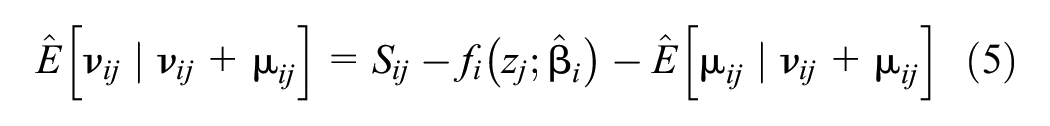
After finding the estimated values of each parameter and the estimated amounts of

Stage 3:
Efficiency Analysis After Adjustment
The adjusted output data in stage 2 are substituted without changing the rest of the data, and the
Variables and Data Sources
Input and Output Variables of the
Method
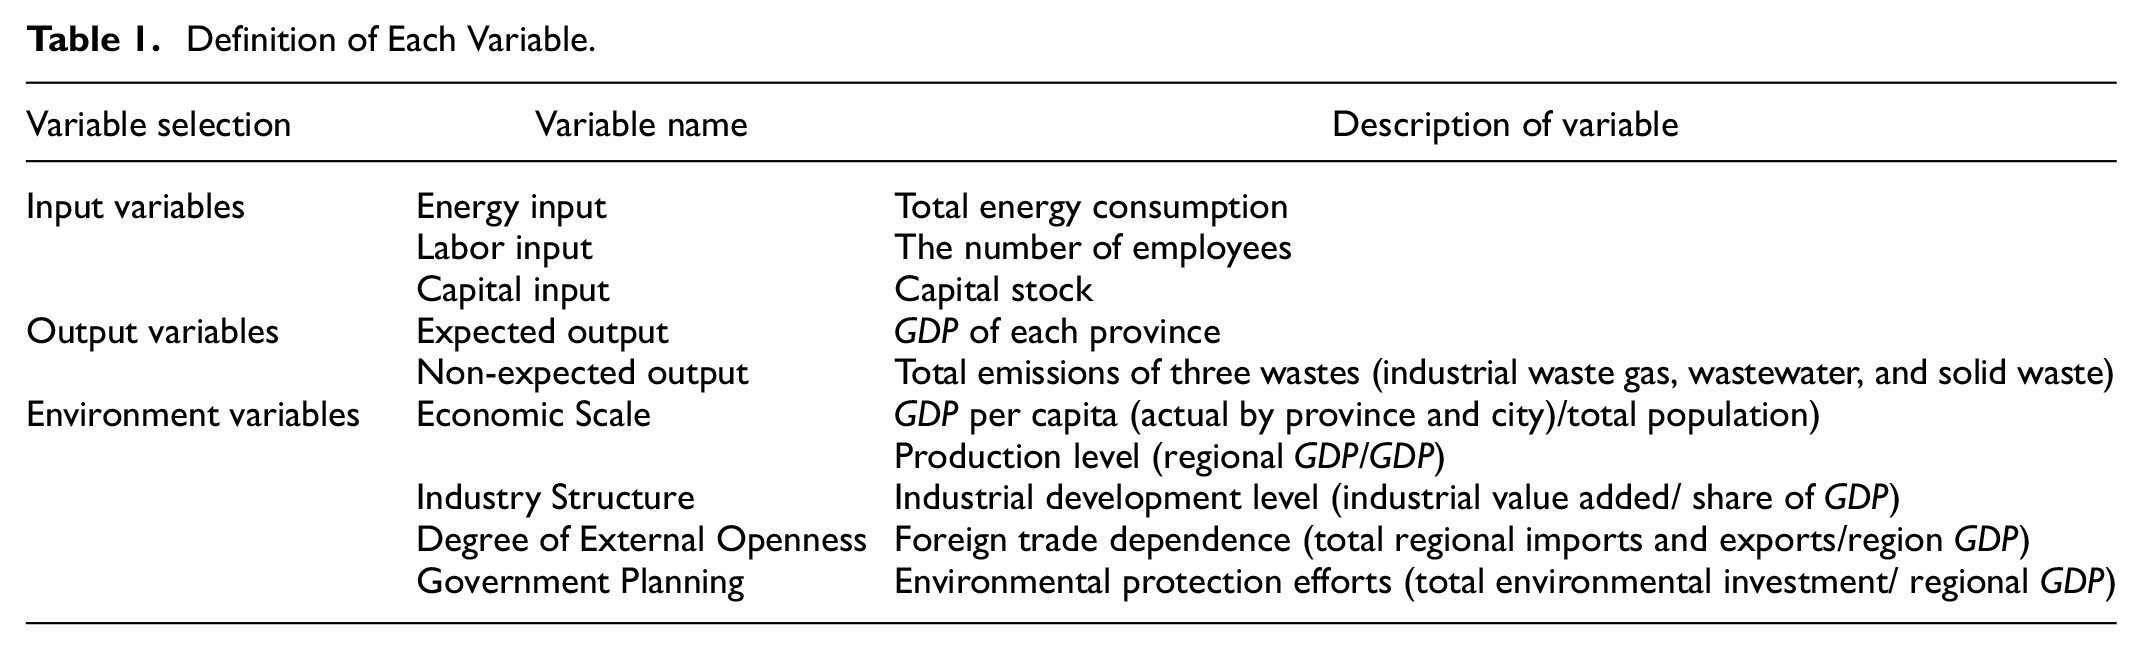
For the construction of environmental efficiency indicators, it is necessary to consider the influence of external environmental factors while following economic efficiency. If the environmental factors are ignored, there will be deviations in the environmental efficiency values in the analysis, and it is very likely to overestimate the environmental efficiency. Therefore, after referring to the existing literature and combining the purpose of this paper, we finally adopt the three input factors and two output factors to quantitatively measure the environmental efficiency of China.
In the past, when measuring the environmental efficiency of China’s provincial panel data, the input variables usually selected are energy input, labor input, and capital input, which have been proved to meet the selection conditions of variables. Therefore, these three variables are also selected as input variables in this paper. Energy input: Based on the current situation of energy consumption in China, the proportion of coal consumption to total energy consumption has been decreasing, so it was decided to use the total energy consumption of each province over the years as the data source. Labor input: To make the labor force measurement index more effective, this paper selects the number of employees in each province over the years to measure. Capital input: The capital stock is selected as the capital input indicator, obtained based on the treatment of perpetual inventory method (Zhang, 2008), and the capital stock of China’s inter-provincial regions from 2011 to 2020 is obtained with 2010 as the base period.
By drawing on past results in related fields, the
Exterior Environmental Variables of Provincial Energy Efficiency
Energy efficiency in Chinese provinces is influenced not only by internal inputs and outputs but also by external factors. To meet the requirements of the “separation hypothesis” and to consider the factors that have a significant effect on environmental efficiency, this paper examines the possible effects on environmental efficiency from four aspects: economic scale, industrial structure, openness to the outside world, and government planning, considering the existing research results and the actual situation of China’s economic development.
The economic scale is explained by the
Definition of Each Variable.
Data Sources and Processing
According to the purpose of the study and the characteristics of the selected analysis software, we select the environmental panel data from 2011 to 2020. Due to the incomplete data information on Tibet and Hong Kong, Macao, and Taiwan, this paper focuses on the environmental efficiency of 30 provinces and cities in China during 2011 to 2020, and the indicators of environmental variables are obtained from the China Statistical Yearbook, China Environmental Statistical Yearbook, China Energy Statistical Yearbook, statistical yearbooks of provinces and cities, and China Economic Database.
The differences in the units of measurement of the indicators selected in this paper may affect the accuracy of the results to some extent, so a dimensionless approach (Lozano & Soltani, 2018) was used to unify the data and reduce the repercussion. Table 2 shows the results obtained after the standardization of input, output, and environmental variables. It can be found that the extreme differences between the indicators are large, which indicates that there is a serious imbalance between the input, output, and environmental variables among the inter-provincial regions in China, and therefore the data from this sample can be used to measure environmental efficiency.
Descriptive Statistics Results.

Provincial Energy Efficiencies Assessment Results
The First Stage: Traditional
Model Results
The
Inter-Provincial Regional Environmental Efficiency in the First Stage.


Note.
The results are shown in Figures 1 to 3. Without considering environmental variables and stochastic factors, the average level of integrated efficiency shows a fluctuating decreasing change between 2011 and 2020, and the annual scale efficiency in China exceeds 0.8. In 2016, China’s environmental integrated technical efficiency, pure technical efficiency, and scale efficiency are 0.694, 0.786, and 0.884, respectively. While in 2020, the integrated technical efficiency, pure technical efficiency, and scale efficiency in 2020 are 0.654, 0.759, and 0.872, respectively, and the overall performance of each aspect is slightly reduced.

China’s comprehensive environmental technical efficiency curve in the first stage, 2011 to 2020.

China’s environmental pure technology efficiency curve in the first stage, 2011 to 2020.

China’s environmental scale efficiency curve in the first stage, 2011 to 2020.
However, the traditional
The Second Stage:
Regression Results
The slack variables of the three input variables (energy input, labor input, and capital input) calculated in the first stage were used as the explanatory variables, and the regional
Regression Results.

Indicates a significant level of 10%.
Indicates a significant level of 5%.
Indicates a significant level of 1%.
Analyze the effect of the external environment on input relaxation variables. When the regression result is positive, it indicates that the increase of the value of the environmental variable is the reason for the increase of the input relaxation variable or the decrease of output, leading to an intensification of waste and a negative impact on environmental efficiency. When the regression result is negative, it indicates that the increase in the value of the environmental variable is the reason for the decrease of the input relaxation variable or the increase of output, thus forming savings and bringing a positive influence to environmental efficiency. According to Table 4 of the regression analysis results, some of the test results have different degrees of significant effects, and the following is a specific analysis of the environmental variables that have significant effects.
Economic Scale. The effect of
Industrial Structure. The effect of industrial structure on the slack variables of energy input and labor input is negative, and the effect on the slack variables of capital input is positive, and the significant level of regression coefficient of slack variables of capital input reaches 1%. It means that the impact of industrial structure on the redundancy of energy input and labor input is not significant, which is consistent with the current situation that energy and labor dominate the industrial industry in China at this stage, but because China is at the stage of technological innovation development, the capital input utilization efficiency is not high, and the expansion of the industrial industry will lead to the waste of capital input, which will have a negative impact on environmental efficiency.
Degree of External Openness. The effect of the degree of external openness on the slack variables of energy, labor, and capital input is negative, and the regression coefficients are significant at 1%. It means that the increase in foreign openness will reduce the redundancy of energy, labor, and capital inputs and achieve savings, which will bring a positive impact on environmental efficiency. The reason is that China’s processing trade is still in the stage of rapid development, and the increase in the degree of openness to the outside world accelerates energy consumption and requires a large amount of labor and capital, thus bringing positive effects on environmental efficiency.
Government Planning. The effect of government planning on the slack variable of energy input is positive, and the effect on the slack variables of labor input and capital input is negative, and the regression coefficients are significant at 1%. It means that the government’s investment in environmental management has a great influence on the changes of the three input slack variables, and environmental protection is obviously lagging behind environmental pollution, and only when the environmental pollution becomes very serious will the government increase the investment in environmental management, leading to the phenomenon of passive management. And the government pays more attention to the end-end treatment of environmental pollution, while there is negligence in the front-end aspects such as improving energy efficiency.
In summary, environmental factors and random error factors are different for different regions, which causes deviations in the performance of environmental efficiency in external inter-provincial regions. Therefore, it is necessary to adjust the variables in the first stage and calculate the real environmental efficiency on the premise of having the same external environment.
The Third Stage:
Model Results After Adjusting Input
The original output data and the adjusted input values were evaluated again for
Inter-Provincial Regional Environmental Efficiency in the Third Stage.
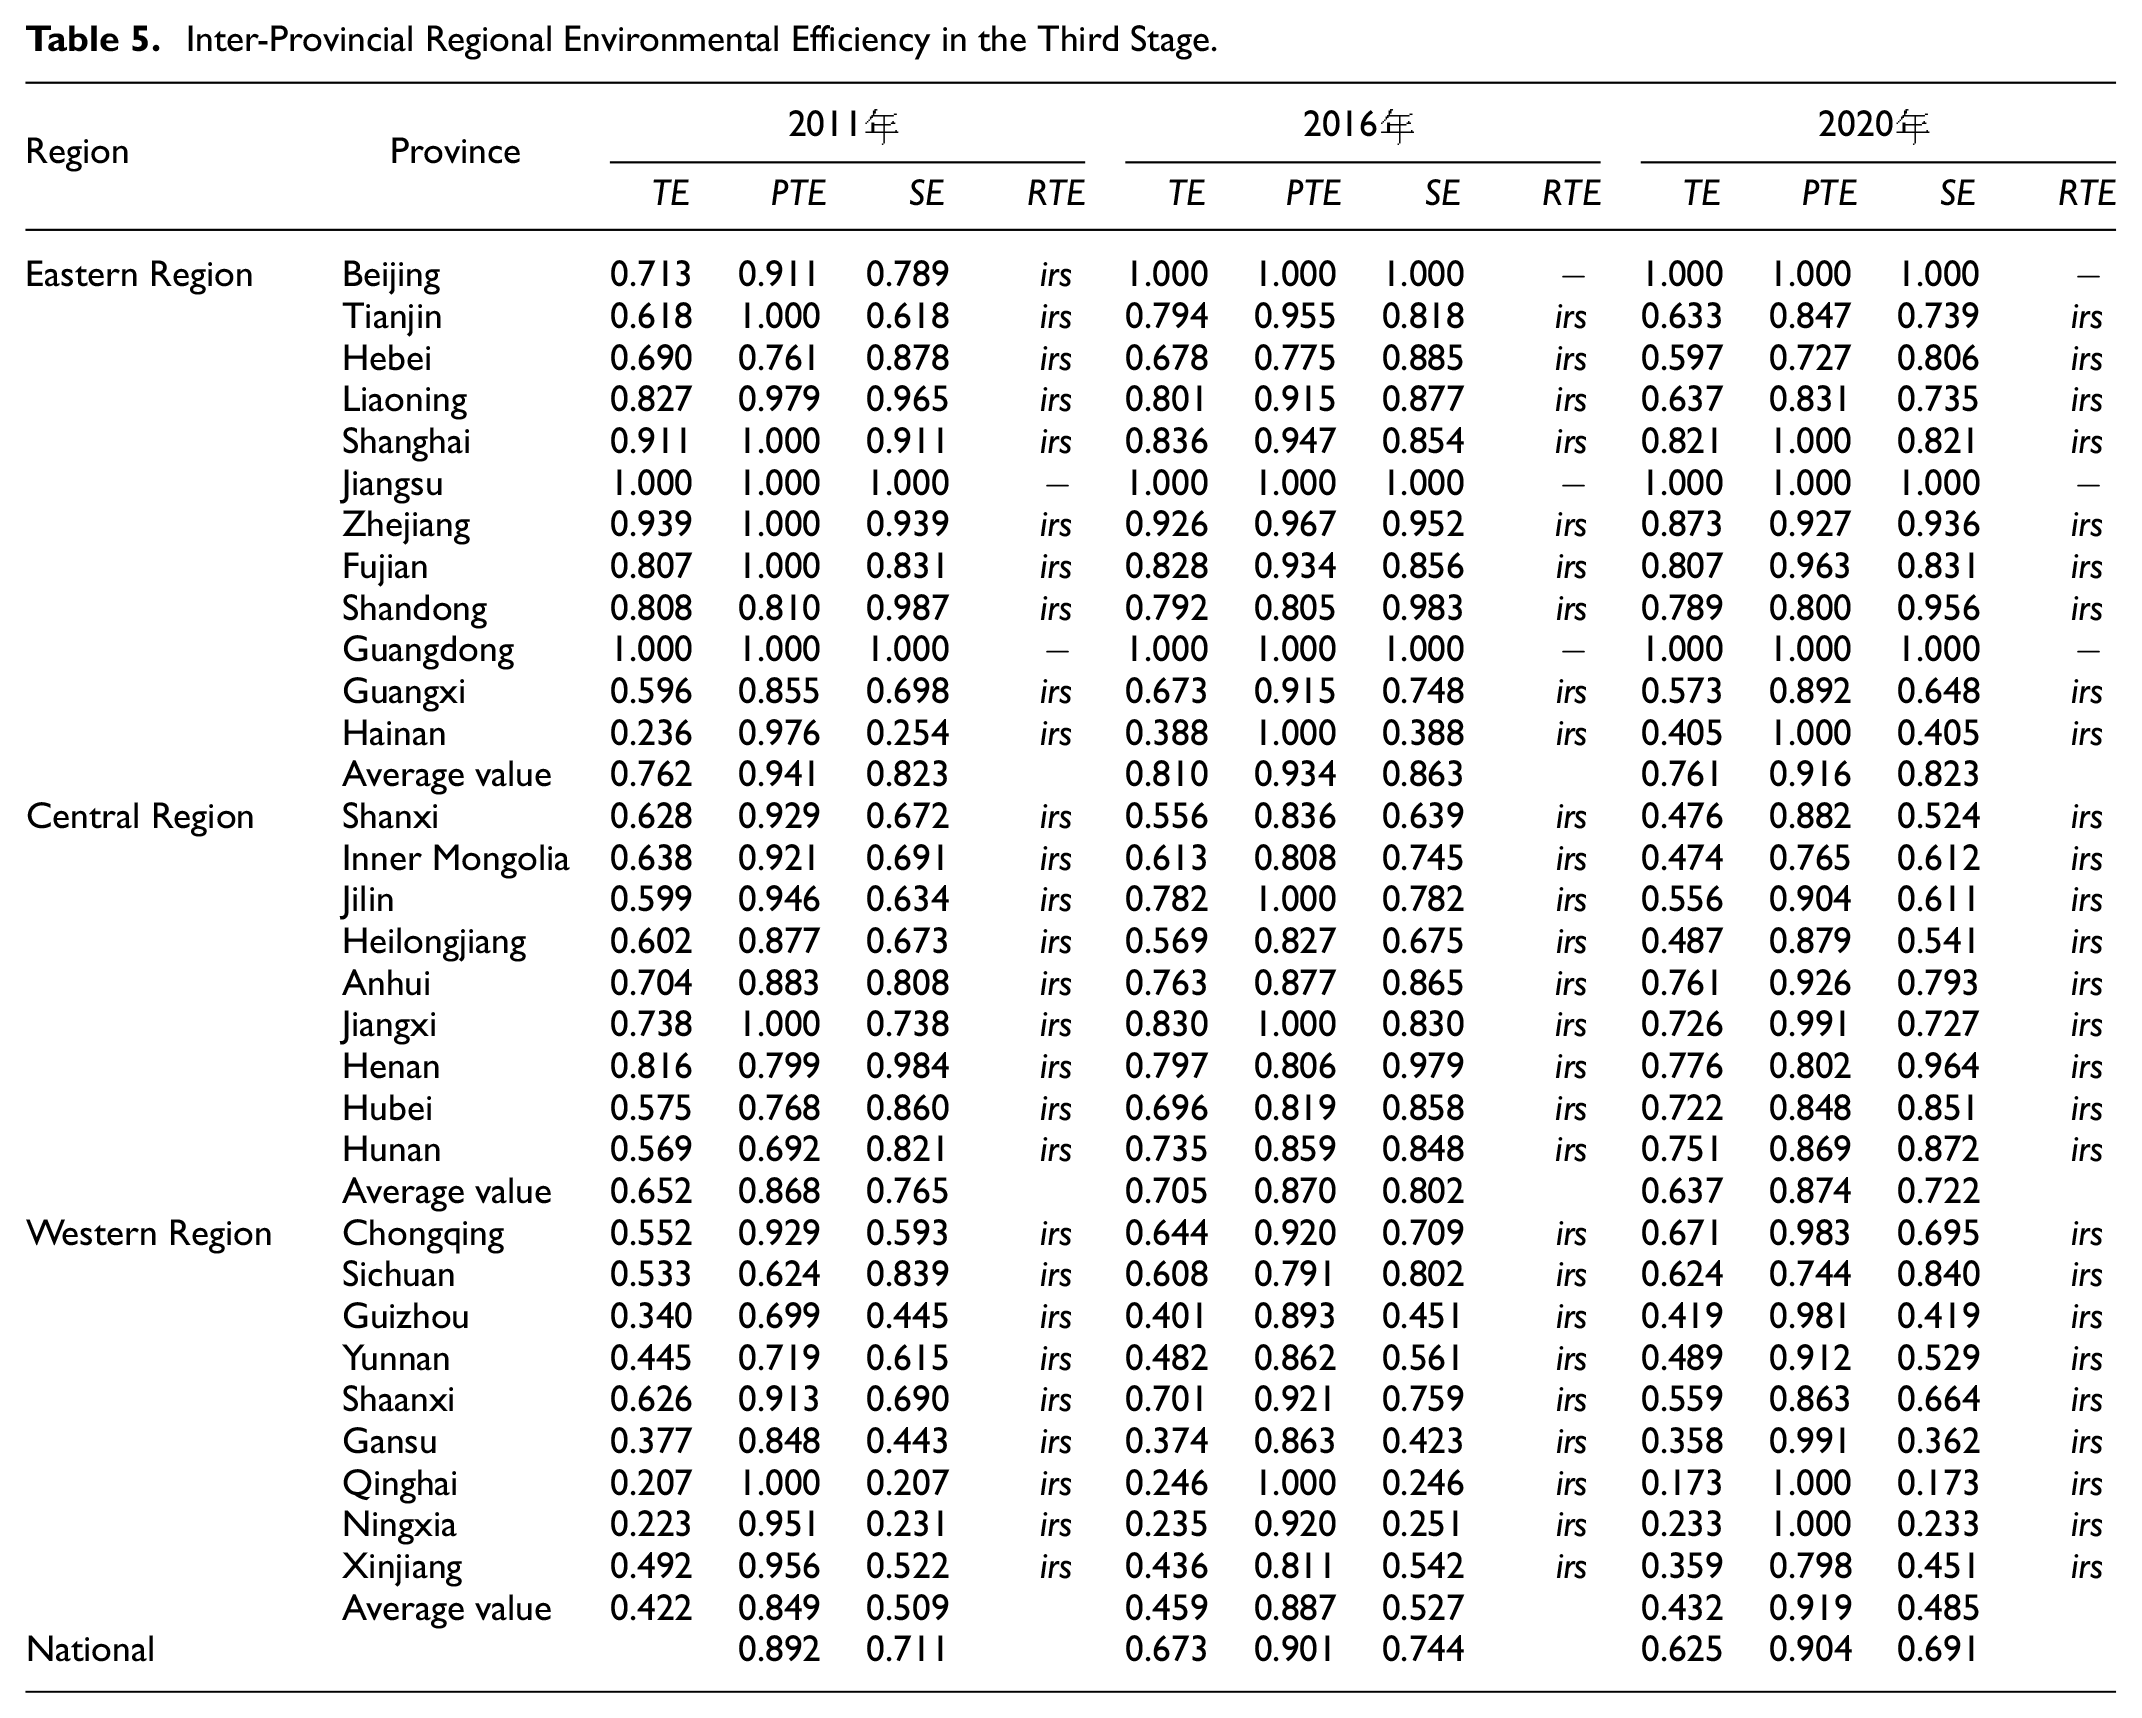
The results are shown in Figures 4 to 6. Under the consideration of environmental factors and random error factors, the average comprehensive efficiency of China during 2011 to 2020 shows a trend of rising and then declining, with the highest value of 0.673 in 2016. The adjusted average pure technical efficiency of China all shows a significantly higher level, all above 0.9 since 2014. After adjustment, China’s average scale efficiency is significantly lower than its pure technical efficiency, and China’s average scale efficiency shows a stable trend. Although it is lower than the value before adjustment, the gap between the two is gradually decreasing. This phenomenon implies that the lack of scale efficiency level is the main reason limiting the improvement of environmental efficiency level.
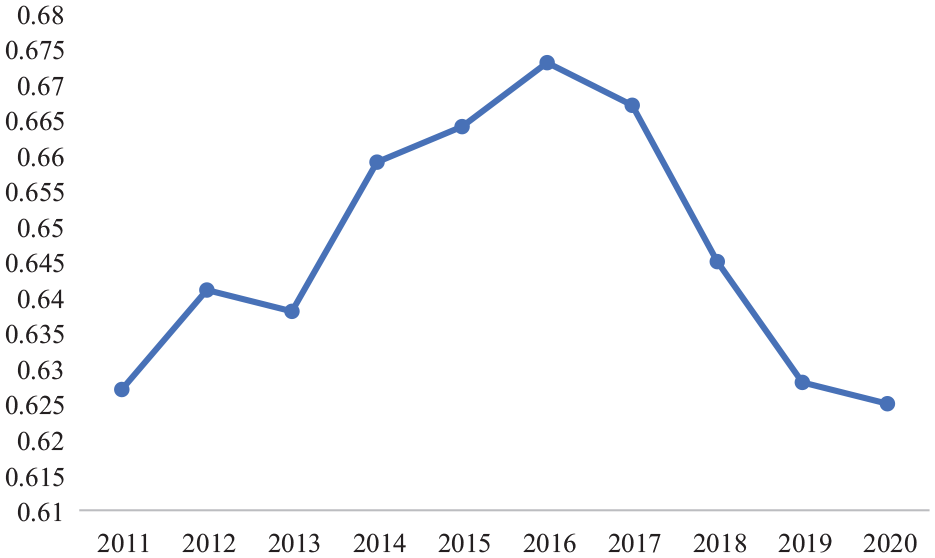
Integrated technical efficiency curve of China’s environment in the third stage, 2011 to 2020.

China’s environmental pure technical efficiency curve in the third stage, 2011 to 2020.

China’s environmental scale efficiency curve in the third stage, 2011 to 2020.
Comparative Discussion of Provincial Regional Environmental Efficiency
Three stage efficiency analysis
By comparing the results of the analysis of the first stage and the third stage, it can be found that, in the first stage, the average pure technical efficiency level in the central and western regions fluctuates down, the average pure technical efficiency level in the eastern region fluctuates up, and the technical efficiency in the east stays higher than that in the central and western regions. The scale efficiency levels in all three regions are higher than the pure technical efficiency levels, and the changes are smaller, indicating that the low pure technical efficiency is the key reason for the improvement of environmental efficiency in Chinese provinces and cities, rather than being influenced by the scale efficiency levels. At the inter-provincial regional level. From 2011 to 2020, 24 provinces in China have an average integrated efficiency of more than 0.5, and 6 provinces are less than 0.5, with Beijing, Shanghai, and Guangdong maintaining an average integrated efficiency of 1 and being at the frontier of China’s efficiency. Tianjin, Zhejiang, and Jiangsu all had an average comprehensive efficiency of more than 0.9, while Guizhou, Yunnan, Gansu, Qinghai, Ningxia, and Xinjiang all had an average comprehensive efficiency of less than 0.5, with Gansu at the bottom. In terms of average scale efficiency, the average scale efficiency of more than half of China’s provinces is higher than 0.9, and 12 provinces are inefficient under different conditions. In terms of pure technical efficiency, the average pure technical efficiency of Hainan and Qinghai reached 1, indicating that they are located at the technological frontier of China, followed by Ningxia.
After eliminating the interference of environmental factors, random error, and management efficiency together, we found that the ranking of comprehensive overall efficiency, pure technical efficiency, and scale efficiency of Chinese provinces are all shown as East > Central > West. After adjustment, only Jiangsu and Guangdong’s integrated efficiency value has always remained at 1 every year, Beijing is also at 1 after 2015. The provinces with a larger level of decline in the average integrated efficiency value are Tianjin, Shanghai, Hainan, Inner Mongolia, Qinghai, and Ningxia, while those with a certain level of increase in the average integrated efficiency value are Hebei, Liaoning, Shandong, Shanxi, Heilongjiang, Henan, Hubei, Hunan, Chongqing, Sichuan, and Yunnan. This means that only Jiangsu and Guangdong are always on the frontier of China’s environmental efficiency, while the rest of the provinces have not yet reached the frontier of China’s environmental efficiency, and there is much room for upward mobility. The average pure technical efficiency of Beijing, Tianjin, Shanghai, Hainan, and Ningxia shows a decreasing trend, and the average pure technical efficiency of all provinces except Jiangsu and Guangdong has improved, especially the average pure technical efficiency of Shanxi, Heilongjiang, and Gansu has increased by more than 0.3. The scale efficiency of most provinces is lower than the pure technical efficiency of the same period, and they are in the ranks of increasing scale gain after adjustment, and only very few of them keep the scale as a result, most provinces can still choose to achieve environmental efficiency improvement by expanding the scale of factor inputs.
Bootstrap Method to Compare the Efficiency of the Environment Before and After the Adjustment
According to purely statistical principles, it is difficult to confirm the asymptotic distribution of the
Comparison of Average Values and Confidence Intervals of Comprehensive Technical Efficiency of Three Major Regions in China Before and After Adjustment.

Comparison of Average Values and Confidence Intervals of Pure Technical Efficiency in Three Major Regions of China Before and After Adjustment.

Comparison of Average Values and Confidence Intervals of Scale Efficiency of the Three Major Regions in China Before and After Adjustment.
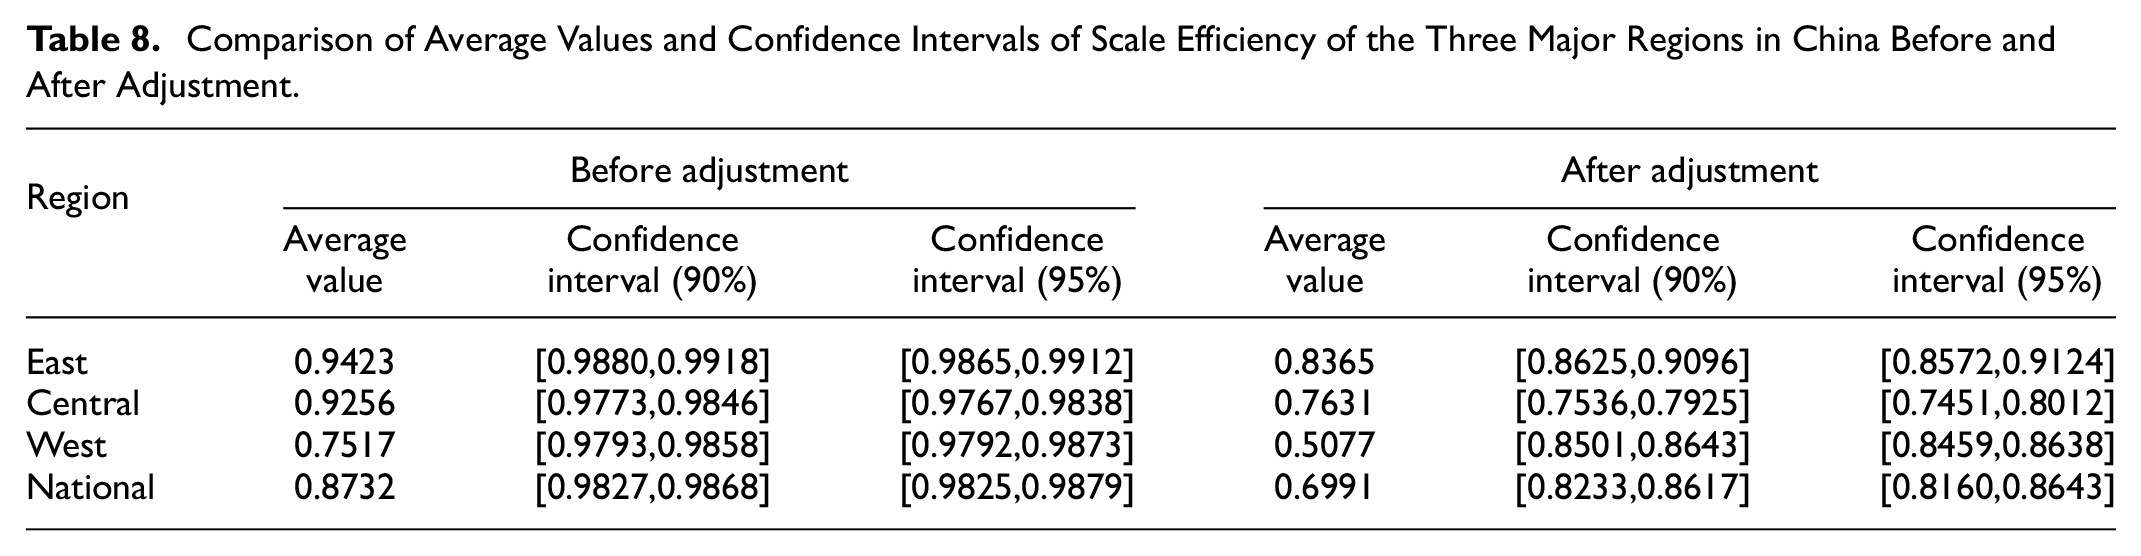
According to the Tables 6, 7, and 8 above, it is easy to find that the average value of pure technical efficiency has been adjusted to increase significantly, while the average value of scale efficiency has decreased significantly, then the adjusted average value of China’s environmental comprehensive technical efficiency shows a slight decrease. The specific changes in the three major regions (East, Central, and West) are as follows.
Eastern region: Excluding the effects of random error factors and environmental factors, the average environmental comprehensive efficiency changes significantly at 90% and 95% confidence intervals. The average pure technical efficiency increased from 0.876 9 to 0.9362, which was underestimated, while the average scale efficiency decreased from 0.9423 to 0.8365, which was overestimated. As a result, the regional average comprehensive efficiency dropped from 0.8238 to 0.7815, which was overestimated. Based on the magnitude of the change, it is found that the level of pure technical efficiency is the main manifestation of environmental variables acting on environmental efficiency in the eastern region.
Central region: Excluding the effects of random error factors and environmental factors, the average environmental comprehensive efficiency is basically unchanged at the 90% and 95% confidence intervals. The average pure technical efficiency increased from 0.7132 to 0.8706, which was underestimated, while the average scale efficiency dropped from 0.9256 to 0.7631, which was overestimated. As a result, the regional average comprehensive efficiency increased slightly from 0.6610 to 0.6654, and the overall change was not obvious. Based on the magnitude of the change, it is found that both the pure technical efficiency level and the average scale efficiency level make the environmental variables affect the central region’s environmental efficiency.
Western region: Excluding the effects of random error factors and environmental factors, the average environmental comprehensive efficiency decreases at 90% and 95% confidence intervals. The average pure technical efficiency increased from 0.6991 to 0.8851, which was underestimated, while the average scale efficiency decreased from 0.7517 to 0.5077, which was overestimated. As a result, the regional average comprehensive efficiency dropped from 0.5023 to 0.4471, which was overestimated. It is also obtained that the level of pure technical efficiency is the main manifestation of the effect of environmental variables on environmental efficiency in the Western region.
Nationwide region: Excluding the effect of random error factors and environmental factors, the average pure technical efficiency increased significantly from 0.7631 to 0.8851 at 90% and 95% confidence intervals, while the average scale efficiency dropped from 0.8732 to 0.6991. As a result, the average comprehensive efficiency of China dropped from 0.6623 to 0.6313, which was due to the obvious effect of environmental variables on the comprehensive environmental efficiency level of the three major regions of the East, Central, and West.
In summary, the real environmental efficiencies of the three major regions in China are all affected by environmental variables to varying degrees and are mainly influenced by pure technical efficiency.
Conclusions
The theoretical significance of our study is that the study of environmental efficiency provides scientific guidance for promoting China’s economic development, and our study enriches the content and perspective of environmental efficiency research and lays down new evaluation ideas and directions for exploring the evaluation of economic development. Based on the availability of data, the environmental efficiency of 30 provinces, cities, and autonomous regions is measured and evaluated. The regional characteristics and differences of environmental efficiency in each region are obtained. This provides a provide good inspiration for improving economic development and environmental efficiency.
The practical significance of our study is that the study of environmental efficiency helps to analyze and understand the characteristics and development rules of environmental efficiency among different regions and provides a reference basis for China to formulate environmental protection policies according to local conditions. We constructed China’s environment evaluation index system, measured China’s environmental efficiency scientifically from the perspective of input and output, and analyzed the regional environmental variability in China. Through the study, it is found that the key elements of China’s environmental efficiency are further improvement of the industrial structure, strengthening the integration of resource circulation and industrial chains between regions, and the environmental development of the western region driven by the east and central regions.
After adjustment, the level of environmental efficiency in China’s inter-provincial regions, excluding the external environment’s influence and random error, varies considerably. The average integrated efficiency and scale efficiency in each year are underestimated at a certain level, with a larger decrease in scale efficiency and an increase in pure technical efficiency after adjustment and remain at a higher level overall. From the results of the third stage, most inter-provincial regions in China have an increasing trend of scale each year, and very few provinces and cities have constant scale payoffs. The random and environmental factors do interfere with the measurement of environmental efficiency, so it is necessary to select a three-stage
The real environmental efficiency of China’s inter-provincial regions is clearly unbalanced in space. Environmental efficiency is ranked from high to low in the three major regions, as eastern, central, and western. From the inter-provincial regions, the environmental efficiency of economically developed regions such as Beijing, Shanghai, Jiangsu, Zhejiang, and Guangdong is considerable, while the environmental efficiency of economically less developed regions such as Guizhou, Ningxia, Gansu, and Xinjiang has a certain gap in comparison, indicating that environmental efficiency is closely linked to the industrial structure of the regions where it is located.
External environmental variables have a significant effect on real environmental efficiency. The rise of real
Recommendations
Therefore, according to the real environmental efficiency of China’s inter-provincial regions, the following four suggestions are made:
1. Encourage a wider range of market accessibility. Each region should implement more and more active opening-up strategies, optimize the system and mechanism of external opening, step up efforts to attract foreign investment, improve the degree of dependence on foreign trade, improve the degree of regional economic opening, strengthen and deepen the degree of openness to the outside world. It is significant to encourage industrial enterprises to “go global,” expand overseas markets, seize international development opportunities, and introduce advanced production technologies from abroad.
2. Optimization and upgrading of industrial structure. The government needs to focus on energy conservation and emission reduction in the industrial sector, and transform and upgrade the energy consumption structure. Efforts should be made to change the dominant situation of primary energy consumption, adopt clean energy, and accelerate the development of high-tech industries. Efforts should be made to promote the sound and coordinated development of the industrial structure, and gradually realize the readjustment of the secondary industry to the tertiary industry. And with the help of international exchange and labor flow, accelerate industrial transfer.
3. Learn from the excellent experiences and reduce regional differences. Given the difference in development positioning between Beijing and Shanghai and other provinces, the regions with a slightly backward economy cannot complete the major adjustment of industrial structure faster. Therefore, it is necessary to strengthen inter-regional cooperation, promote technological progress and play the leading role of highly efficient regions by studying and learning from the excellent experiences of economy-developed areas. All places should establish the awareness of coordinated development, set up a mechanism for green development cooperation, and direct the multiple factors of production that flow between regions.
4. Reasonably increase the capital investment in environmental management. Change the environmental management model of pollution first and then treatment to the environmental management method of source treatment and whole process control. It is very necessary to improve the efficiency of resource utilization through the implementation of various policies, increase the investment in pollution emissions and strengthen the control of pollution emissions. At the same time, we support the innovative technology development model of enterprises to fundamentally improve the efficiency of resource utilization.
5. The improvement of environmental efficiency depends not only on government policies, but also on the environmental awareness of enterprises. Enterprises should continue to improve their scientific and technological innovation capabilities, strengthen environmental pollution control efforts, and apply science and technology to achieve energy Utilization efficiency, and thus achieve the reduction of pollution emissions. Enterprises with a level of innovation should integrate their own resources and technology resources and technology to develop advanced production models and the efficiency of waste utilization. Some traditional enterprises that lack innovation, should actively introduce advanced technologies. Traditional companies that lack innovation, should actively introduce advanced technologies and learn from other companies’ environmental protection mechanisms.
Limitations and Future Research
There are some limitations in our study. Firstly, various external environmental factors exist in the research and analysis of environmental efficiency. Based on the difficulty of existing research and data acquisition, this study only selects variables from four aspects. We hope to establish an objective and comprehensive linkage in future studies to reasonably select indicator data and study their influence weights in depth. Our study starts from the regional perspective, and future studies can also analyze from the industry perspective, such as agriculture, food industry, manufacturing industry, etc., and conduct comparative analysis within and between industries to explore the intrinsic influence path and formation mechanism, etc.
Footnotes
Acknowledgements
The authors gratefully acknowledge the institutional support provided by the China (Hangzhou) cross-border e-commerce school, Hangzhou cross-border e-commerce association, The Inamori Kazuo Research Center, Hangzhou Highstore Co.,Ltd and Supmea Automation Co., Ltd.
Declaration of Conflicting Interests
The author(s) declared no potential conflicts of interest with respect to the research, authorship, and/or publication of this article.
Funding
The author(s) disclosed receipt of the following financial support for the research, authorship, and/or publication of this article: The research was funded by Zhejiang Province philosophy and social science project (24NDJC139YB); China Social Science Key Fund (23&ZD037); China Scholarship Council (202009545007); by special fund for basic research expenses of Zhejiang provincial universities: XT202207.
Ethical Approval
The authors declare no animal and human studies.
Data Availability Statement
The data of this study are available on request from the corresponding author.