
Abstract
This research aims to develop a reliable and validated fan typology scale and to examine whether the perception of the quality of a sports event differs according to fan typology. In the first stage of the research, the scale was developed using quantitative research methods. Exploratory Factor Analysis (EFA) was applied to 339 fans, and Confirmatory Factor Analysis (CFA) was used on 260 fans. Analysis results show that the structure of the tested scale provides valid and reliable evidence, and the structure consists of 35 items gathered under seven dimensions. After the development of the scale, in the second stage of the research, the relationship between the typologies of the fans and the quality perceptions of the sports event was examined. While Gençlerbirliği and Ankaragücü supporters using the Eryaman Stadium constituted the universe of the research, the sample of the study consisted of 502 fans selected by criterion sampling method. A two-stage hierarchical cluster analysis was used to reveal the fan typology. In addition, the research questions were tested using the t-test, ANOVA, and χ2. It was determined that four types of fans emerged: “hooligan,”“fanatic,”“classical,” and “social.” In addition, it was determined that the perceptions of event quality differed significantly according to the fan’s typologies. In this direction, it can be said that football clubs should develop different communication strategies to improve the perception of all fan types.
Keywords
Introduction
Today, with the acceleration of the professionalization and commercialization process, sports have become something beyond games and medals and become an industry (Lefever, 2012, as cited in Sarol, 2019). As sports became an industry, there was an increase in both product diversity and the number of businesses. In addition to the rise in the number of companies, the ease of communication with the development of technology has increased consumer awareness. This has increased competition in sports fields and in other businesses, and this competition has made it inevitable for sports businesses to improve the quality of sports services.
Increasing the quality of sports businesses is a result of the evolution of the concept of fandom. The concept of the fan, an element that provided more spiritual contribution in the past, has become the most crucial source of income for clubs in today’s sports industry, and this has caused a change from fan to customer (Akşar, 2008). Taylor (1971) stated that with this change, former working-class fans with a subcultural football consciousness centered on the local team, masculinity, active participation, and victory were transformed into “real” middle-class fans based on socialization, spectacle, skill, and performance (as cited in Giulianotti, 2002). With this orientation towards the customer, fans have become a mass that is expected to make financial contributions rather than moral contributions (Talimciler, 2008). For this reason, in today’s sports marketing, the idea that fans support their team under all circumstances has lost its power, and the understanding that fan satisfaction is important has developed (Durusoy, 2000). In this context, football clubs have started to increase fan satisfaction without ignoring different expectations (Salman, 2008).
One of the areas where fan satisfaction needs to be increased is in sports services based on viewing with the participation of a large number of fans. When the studies on spectator-based sports services are examined, it has been determined that only the match score is not enough for the event to be of high quality and that the perception of quality consists of many elements such as accessibility, design, interaction quality, food and beverage services, seating, direction signs, cleaning, scoreboard, game quality, and entertainment (Çimen et al., 2022; Gençer, 2005; Kelley & Turley, 2001; Ko et al., 2011; Wakefield et al., 1996; Yoshida & James, 2011)
However, these studies on the quality of sports events were developed or measured based on a single fan type. The fans’ frequency and enthusiasm for team-related behaviors vary (Raney, 2013; Vallerand et al., 2008). For example, a fan may be loyal to the team but not go to the stadium or the match but not blindly loyal. S/he does not buy products, but s/he may follow the team intensively on social media (Salman, 2008). These differences may cause fans’ quality expectations and perceptions to change. For this reason, sports clubs need to classify fans according to specific characteristics and develop separate communication strategies for emerging fan typologies.
Sports management researchers have conducted many studies in recent years on the behaviors of sports fans and the typologies created by these behaviors. In some of these typology studies, typologies were developed based on behavioral features (Park et al., 2021; Salman, 2008; Taşmektepligil et al., 2015; Wann & Branscombe, 1990), and in others, both behavioral and motivational features (Hunt et al., 1999; Kearney, 2003; Quick, 2000; Sutton et al., 1997; Yetim et al., 2023). Some of the typologies created are compilations (Giulianotti, 2002; Hunt et al., 1999; Kearney, 2003; Quick, 2000; Sutton et al., 1997), and some are studies conducted using measurement tools (Park et al., 2021; Taşmektepligil et al., 2015; Wann & Branscombe, 1990). In these studies conducted with measurement tools, many dimensions, such as product use, score sensitivity, follow-up, and information gathering, are generally represented within other dimensions with a limited items and are not designed as a separate dimension. In addition, it was determined that the studies on team commitment leveled commitment as low, medium, and high (Mahony et al., 2000; Matsuoka, 2001; Wann & Branscombe, 1990). However, even if fans exhibit similar behaviors or have the same level of commitment to the team, they can be represented in different typologies. In line with these inferences, there was a need to develop a valid and reliable measurement tool that comprehensively addresses fan behavior. The development of the measurement tool will make an essential contribution to the literature.
Additionally, determining the quality perception of fan typologies through the measurement tool will enable sports clubs to apply different communication strategies. This is because the perception of quality may differ from fan to fan. The perception of the quality of a fan with low commitment to the team may be different from that of a fan with high commitment. By measuring the quality perception according to typologies, sports clubs can increase the quality perception of fans with low team loyalty or reinforce the high-quality perception. Otherwise, quality studies based on a single fan type may be incomplete and insufficient, which may cause fans whose expectations are not met to move away from the stadium and the team. In this context, determining whether quality perceptions change according to fan typologies will directly affect the strategies of sports clubs. In this respect, the study’s results are important in contributing to the literature and affecting the communication efforts of sports clubs.
Based on this, this research aims to develop a reliable fan typology scale with validity evidence and to examine whether the perception of the quality of a sports event differs according to fan typology.
Conceptual Framework
Fan Typology
Fans can support and consume their team without gaining any financial benefit from the team they support (Bozgeyikli et al., 2018). Understanding the interests and behaviors of fans has become an essential issue for sports club managers as fans make significant contributions to clubs materially and morally. Studies conducted to make sense of these interests and behaviors show that the frequency of fans’ behavior and interest in the team may vary and that there are differences among fans regarding some characteristics. In studies conducted in the literature, elements covering the dimensions of “Product Use” (Hunt et al., 1999; Quick, 2000; Sutton et al., 1997; Wann & Branscome, 1990), “Sensitivity to the score” (Hunt et al., 1999; Mahony et al., 2000; Quick, 2000; Salman, 2008; Wann & Branscome, 1990), “Following” (Kearney, 2003; Salman, 2008; Sutton et al., 1997), “Watching Behavior” (Dwyer et al., 2016; Salman, 2008), “Violent tendency” (Dwyer et al., 2016; Hunt et al., 1999; Park et al., 2021), “Information Collection” (Hunt et al., 1999; Kearney, 2003; Park et al., 2021; Wann & Branscombe, 1995), “Belonging” (Matsuoka, 2001; Salman, 2008; Sutton et al., 1997), and “Superstition” (Brevers et al., 2011; Dwyer et al., 2016) were used as features that distinguish fans from each other.
These differences, used as distinguishing features, lead to the formation of fan types. Many studies divide fans into typologies (Fillis & Mackay, 2014; Hunt et al., 1999; Kearney, 2003; Quick, 2000; Sutton et al., 1997; Wann & Branscombe, 1990). Some of these studies explained typologies according to team commitment. Fans with low commitment to their team are defined as fair-weather-friend, those who only support the team, and constant, while those with high commitment are defined as conservative, evangelist, committed to death, loyal, fanatic, and hooligan (Fillis & Mackay, 2014; Hunt et al., 1999; Park et al., 2021; Salman, 2008; Wann & Branscombe, 1990). In addition to team commitment, typologies have been created based on motivational elements. Typologies have been created by naming fans whose primary motivation is relieving stress, socializing, and having fun as social, social devote and theater audiences (Fillis & Mackay, 2014; Kearney, 2003; Quick, 2000; Sutton et al., 1997). In addition, fans’ love for sporting performance, athletes, and sports were also used to form typologies (Kearney, 2003; Quick, 2000).
Quality of Event in Spectator Sports
Although it is perceived as an indispensable element for sports businesses to provide quality service today, this awareness does not come quickly in the football industry, which attracts large fan bases to stadiums. Football clubs see fans as individuals who support their team regardless of the circumstances (Salman, 2008). However, scientific studies (Halıcı & Çimen, 2021; Ko et al., 2011) show that fans have quality expectations.
However, some factors increase the importance and difficulty of providing quality service in sports events. One of these factors is that sports clubs compete with other entertainment sectors. In addition to the high competition within sports enterprises or clubs, they also have to compete with other entertainment sectors, such as cinema and theater, since one of the most essential sports functions is the entertainment element. The fact that competitions are played on weekends and many events occur simultaneously makes the job of sports clubs especially difficult. For sports clubs to stand out in this competition, there has been a need to highlight the entertainment elements of football. This view was confirmed by Halıcı and Çimen (2021), and in the study, fans stated that they had expectations for entertainment elements to be brought to the fore in stadiums.
Another critical factor affecting sports clubs’ efforts to provide quality service is the result-oriented focus on spectator sports. Scientific studies reveal that the score is an essential element in evaluating the quality of the event. For example, Sutton et al. (1997) stated that the focused fan group, one of the fan types they introduced, is sensitive to the score. Although this fan group makes financial investments such as product use for their team, they stated that their behavior is directly related to the team’s success; therefore, unsuccessful results may reduce the fans’ loyalty. In parallel with these findings, Wann and Branscombe (1990) also stated that a match’s outcome may be the main factor determining team loyalty. However, it is not possible for sports club managers to control the score directly.
Despite these difficulties in improving the quality of the event in spectator sports, sports managers need to focus on the elements they can directly control that will increase the fans’ perception of quality, apart from the uncontrollable or partially controllable elements, such as competition results or performance (Ko et al., 2011). By increasing the quality of the elements they can control, sports managers can ensure that fans enjoy the event even when the score or game performance is negative (Kuenzel & Yassim, 2007; Wakefield & Sloan, 1995; Zhang et al., 2014).
In the studies conducted on the quality of the event in spectator sports, it was determined that the competition score alone is not sufficient for the event to be of high quality and that the perception of quality consists of many elements (Gençer, 2005; Kelley & Turley, 2001; Ko et al., 2011; Kuenzel & Yassim, 2007; Wakefield et al., 1996; Zhang et al., 2014). These elements include many dimensions, such as accessibility, design, interaction quality, food and beverage services, seating, direction signs, cleanliness, scoreboard, game quality, and entertainment.
Methodology
This research aims to determine whether football fans’ quality perceptions of sports events change according to their typology. In this direction, the first stage of the study aimed to develop a valid and reliable scale that reveals the typology of football fans.
First Research Group (Scale Development)
Criterion sampling, one of the purposeful sampling methods, was to select the research group created to develop the scale. In this context, the participants who will participate in the research were required to follow any of the teams in the Turkish Football Super League in the season 2021 to 2022 and have watched the match of this team at the stadium at least twice in the season 2021 to 2022. In the light of these criteria, a total of 599 people were reached during the development process of the scale, taking into account the opinions in the literature that the sample size should be five or ten times the number of items (Bentler & Chou, 1987; Ding et al., 1995) and that the data set should not be less than 300 (De Vellis, 2017; Nunnally & Bernstein, 1994; Worthington & Whittaker, 2006). Within the scope of the research, an application was first made to 339 people for exploratory analysis and then to 260 people.
Second Research Group
In the second stage of the research, the situation between the typologies and quality perceptions of Gençlerbirliği and Ankaragücü fans using Eryaman stadium was tried to be determined. In this regard, the population of the research consists of Gençlerbirliği and Ankaragücü fans who use Eryaman stadium. In line with the findings from Passolig, an electronic ticketing system, it was determined that 30,000 fans of Gençlerbirliği and 79,000 fans of Ankaragücü had a Passolig card as of October 2022. In order to determine the sample size, the sample size chart specified by Çıngı (1994) was utilized. One hundred universe unit size is represented by at least 383 units with 95% probability. In addition, a power analysis was performed through the G*Power 3.1 analysis program.As a result of the analysis conducted with a confidence interval of 0.05, 95% power, and small effect size concerning the tests to be applied within the scope of the study, it was determined that a group of at least 408 people was sufficient for the analyses. Considering the possibility of participants dropping out of the study or giving incorrect or incomplete answers, the number of samples was increased by 20%, and it was decided to include at least 490 participants. Criterion sampling, one of the purposeful sampling methods, was used to ensure that the sample represented the population qualitatively and quantitatively. Criterion sampling was preferred in line with the purpose of the study, as it allows for a more in-depth examination of the research (Bütün & Demir, 2014). In this context, the participants to participate in the research were required to have watched their team’s match at the stadium at least three times in the seasons 2021 to 2022 and 2022 to 2023. Individuals who attended 1 or 2 matches were required to have attended at least three matches due to the possibility of not being able to make sufficient observations about the stadium, affecting the perception of quality. Based on these results, 502 fans were included in the study, and relevant analyses were carried out.
Data Collection
This study was initiated due to the application made to the University Ethics Commission, and receiving approval that there was no ethical objection. The scale, created to collect information regarding the research questions, was applied to the research group face-to-face and electronically. Participants were informed by the instructions in the survey form and by the researchers. Participants participated in the research voluntarily.
Data Collection Tools
The data collection tool prepared to evaluate the research questions consists of three sections. The first section includes the personal information form, the second section includes the “Fan Typology Scale,” and the last section includes the “Sports Events Quality Scale.”
Fan Typology Scale
Within the scope of the study, a valid and reliable scale was developed to reveal the typology of football fans. The methods used in the scale development process are explained in detail.
Creating Trial Items
In developing the “Fan Typology Scale,” all scales and items of the relevant question pools examined and described in the national and international literature were examined. Additionally, qualitative interviews were conducted with ten fans through an unstructured interview form during the article writing. Data were collected from the researchers through the question, “What do you think about your level of commitment to the team you support? What kind of behavior do you exhibit?” The online conversations were recorded. Article writing was started in line with the literature and qualitative study results. In the first stage of the article writing process, 69 items were written.
Obtaining Expert Opinions
After creating the test items, consulting experts tried to content validity. In this context, eight academicians from the field of sports sciences and two from the field of measurement and evaluation, who have studied in the field of sports marketing, were asked to evaluate the items. In line with the feedback from experts, the items were re-examined, and four items were removed from the pool. Some items were corrected in line with the suggestions. In line with these suggestions, a pilot study was started with 65 items representing eleven dimensions.
Conducting a Pilot Study
After editing the trial scale, 65 items in the draft scale were rated on a 5-point Likert type. The scale items were arranged with degrees formed by the expressions “Always,”“Often,”“Occasionally,”“Rarely,” and “Never.” Criterion sampling was used to select the research group for the pilot study. In this regard, the scale was applied face to face to 20 sports sciences faculty students who were fans of a football team and watched at least three matches at the stadium in the season 2021 to 2022. At the end of the pilot study, a pool of 65 items attributed to 11 dimensions (Product Use, Sensitivity to the score, Following, Watching Behavior, Violent tendency, Watching Motivation, Having Information, Emotional Commitment, Advertisement, Match Watching, and Finance) was reached.
Giving the Final Shape to the Scale
In line with the analyses made after the preliminary applications, the final form of the scale included 35 questions and seven dimensions (Product Use, Sensitivity to the score, Following, Watching Behavior, Violent tendency, Information Collection, and Belonging). The results of the analyses are presented in the findings section.
Sports Events Quality Scale
“Sports Events Quality Scale,” developed by Çimen et al. (2022), was used to measure football fans’ perceptions of event quality. The scale consists of 42 items in total, combined into ten sub-dimensions, which are design (6 items), buffet (4 items), output (6 items), performance (4 items), employee-fan interaction (4 items), access to the facility (5 items), in-facility access (4 items), seat (3 items), fan-fan interaction (3 items), and entertainment (3 items). The relevant study stated that the factor loadings of the items varied between 0.46 and 0.96 as a result of EFA. It was noted that the sub-dimensions explained approximately 73% of the total variance. As a result of CFA, it was stated that the RMSEA value of the current structure was 0.055; other goodness-of-fit indices were at an acceptable level; the Cronbach’s alpha values of the sub-dimensions ranged between .821 and .933. The sports events quality scale was rated on a 5-point Likert type (Strongly Agree—Strongly Disagree) to determine each participant’s perception of quality.
Data Analysis
During the development process of the fan typology scale, a cross-validation study was conducted to test its construct validity. Firstly, the measurement tool’s construct validity was tested in this context. Construct validity shows the degree to which the test can accurately measure an abstract concept in the context of the behavior to be measured. Construct validity determines how accurately the questions are prepared to measure the specified characteristics (Büyüköztürk, 2023). Exploratory factor analysis was applied to 339 football fans to examine construct validity. Exploratory factor analysis was applied to 339 football fans to examine construct validity. The suitability of the data set for EFA was interpreted by examining the Kaiser-Meyer Olkin (KMO) coefficient and Bartlett Sphericity tests. From these results, which were examined in conjunction with the criterion values suggested by the literature (Field, 2013, >0.60), the KMO coefficient was calculated as 0.869 and was decided to be at a sufficient level. Bartlett Sphericity test results, which show that the data come from a multivariate normal distribution (Çokluk et al., 2014), were found to be significant (x2 = 5,068.70; df = 595; p < .000). After determining the suitability of the data for factor analysis, the scale was applied to 260 football fans to determine the suitability of the obtained dimensions in the data obtained from different samples. Confirmatory factor analysis (CFA) and reliability analyses were calculated based on the data obtained from football fans. After Fan Typology Scale was developed, measurement tools were applied to 502 fans to determine whether the quality perception changed according to the fan typology. The data obtained from the fans was transferred to the relevant analysis programs without any intervention. Missing, erroneous, or extreme data in data sets were handled with data review and cleaning methods. No participant-related errors were found in the data collected both electronically and face-to-face. After determining the normal data distribution, descriptive statistics were calculated to determine the fans’ perceptions of the event quality. Two-stage hierarchical cluster analysis was used to reveal the fan typology. A two-stage hierarchical clustering analysis is a hybrid clustering technique formed by combining the non-hierarchical clustering techniques “k Means” and the hierarchical techniques “Ward’s Smallest Variance” (Ceylan et al., 2017). Dalmaijer et al. (2022) stated that each cluster should have at least 30 participants. In this context, it was determined that the data collected from 502 fans was sufficient to apply the two-stage hierarchical clustering analysis. Research questions were tested with t-test, ANOVA, and chi-square analyses.
Findings
This section of the research includes the findings regarding the “Fan Typology Scale,” while the next section includes the findings regarding typologies and quality perception.
Stage 1 (Scale Development)
Exploratory Factor Analysis (EFA)
In this context, EFA was carried out with a data set of 339 people on a scale of 11 dimensions and 65 items. The suitability of the data set for EFA was interpreted by examining the Kaiser-Meyer Olkin (KMO) coefficient and Bartlett Sphericity tests. From these results, which were examined in conjunction with the criterion values suggested by the literature (Field, 2013, >0.60), the KMO coefficient was calculated as 0.869. It was decided to be at a sufficient level. Bartlett Sphericity test results, which show that the data come from a multivariate normal distribution (Çokluk et al., 2014), were found to be significant (x2 = 5,068.70; df = 595; p < .000). After determining the suitability of the data for factor analysis, EFA results were examined. Item statistics were examined with the criteria of loading on more than one factor, overlapping values (.10), and not loading on any factor (<0.30), and the processes were repeated until the most appropriate structure was reached. As a result of this process, it was understood that 30 items on the scale did not meet the criteria. It was determined that the remaining 35 items in the scale form were collected under seven factors with eigenvalues above 1 (Table 1).
Variance Rates Explained by FTS Items.

It was determined that 35 items in the fan typology scale explained 59.240% of the total variance. It can be considered sufficient in multi factor designs if the variance explained is between 40% and 60% (Çokluk et al., 2014). In this regard, the scale’s variance rate, consisting of 35 items with seven dimensions, is at an acceptable level (Table 2).
Factor Load Values of FTS Items.

Tabachnick and Fidel (2013) state that items with factor load values of 0.45 and above are highly explanatory, and accordingly, it was determined that all items in the scale are essential explanators of the dimension to which they belong.
The corrected item-total correlation coefficients of the items in the fan typology scale were also calculated. In line with the information obtained, it was determined that the explanatory nature of the scale items was at medium and high levels. The correlation coefficients between the components of the structure obtained as a result of EFA and between these components and the entire scale were calculated. When the results of the correlation analysis were examined, it was understood that there were no significant relationships between some factors, the related factors were low and moderately related to each other, and these values varied between .165 and .497. In light of all these findings, it can be said that the Fan Typology Scale has a valid structure.
Confirmatory Factor Analysis (CFA)
After Confirmatory Factor Analysis (CFA), it was determined that all items in the FTS had significant t values in their respective dimensions and the entire scale. It was determined that all items in the scale were valid and significant for the feature to be measured. No modifications were made to this structure.
Standardized lambda and standardized regression coefficients were calculated during the model calculation stage, and the results are shown in Table 3.
Standardized Lambda and Standardized Regression Coefficients.

The obtained values show that the items of the scale developed in the scope of the research have a medium and high level of explanatory ability in the dimensionsto which they belong.
When the goodness of fit indices of the model were examined as a result of CFA, it was determined that the RMSEA value was 0.061. When the criterion threshold of this value in the literature is examined, it is stated that a value of 0.08 and below is a good fit, and a value equal to 0.010 is a poor fit (Brown, 2015; Harrington, 2009). In line with this information, as a result of the first level CFA, it was concluded that the RMSEA value of the model was among the acceptable values, and the structure had a good fit. Other goodness of fit indices were also examined within the ranges suggested by the literature as criterion values (Brown, 2015; Tabachnick & Fidel, 2013; Thompson, 2004), and it was concluded that some of the values indicate good fit for the model (SRMR, NFI, GFI, AGFI). Some indicate perfect fit (χ2/df, CFI, IFI, NNFI).
Cronbach’s alpha reliability coefficient was calculated to determine the reliability of the answers given by the participants to the scale developed within the scope of the research. It can be seen that the reliability coefficients of the answers given by the participants ranged between 0.555 and 0.834, and the reliability coefficients of the participants who took part in the second application where confirmatory analyses were made ranged between 0.751 and 0.908. When the data were examined based on Kalaycı’s (2009) alpha coefficients, it was determined that the reliability of the answers given to the scale was high (Table 4).
AVE and CR Values of FTS.

It shows that the AVE values of the dimensions vary between 0.51 and 0.62, and the CR values vary between 0.79 and 0.88. It is recommended in the literature that the AVE value should be over 0.50 (Fornell & Larcker, 1981). The CR value should be over 0.70 (Hair et al., 2014). As a result of two analyses, it was observed that AVE and CR values were between acceptable values.
In light of all these findings, it was concluded that the items in the scale, the sub-dimensions, and the overall scale are reliable. In line with both validity and reliability analyses, it can be said that the fan typology scale is a valid and reliable measurement tool.
Cluster Analysis
A two-stage cluster analysis was used to determine the fan typology. This analysis examined how many clusters the dimensions of product use, sensitivity to the score, watching behavior, violent tendency, information collection, belonging, and following were collected. When the coefficients were examined, the Euclidean difference, which shows the distance between the cluster coefficients of 502 participants, revealed four clusters. Based on expert opinion, these clusters were named hooligan, fanatic, classical, and social (Table 5).
Fan Typology Avarages.
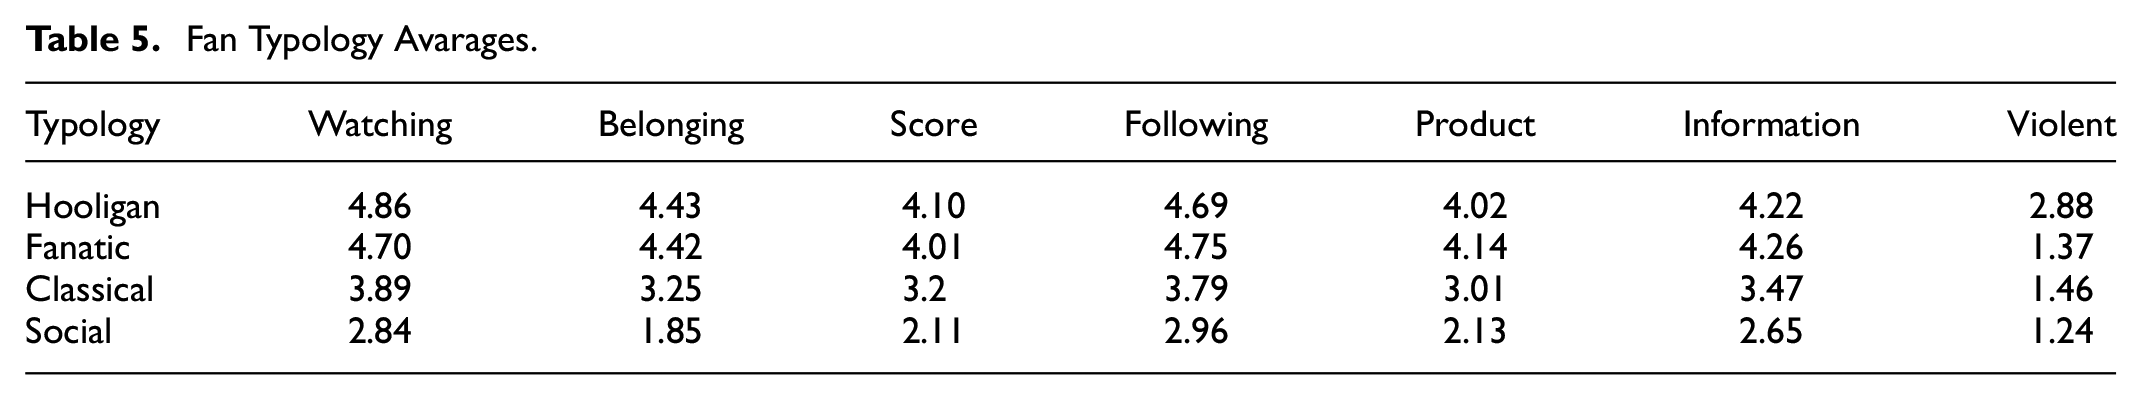
It was determined that the averages of hooligan and fanatic fans were higher than those of classical and social fans, and the factor differentiating hooligan fans from fanatic fans was the averages of violent tendencies. Descriptive statistics for the typology distribution of the fans participating in the research are shown in Figure 1.

Distribution of fans according to typologies.
When the distribution of fan groups according to typologies was examined, it was determined that most (46.6%) were fanatics, and most minor (8.4%) were social fans.
When Table 6 is examined, it is determined that fan typologies differ according to most of variables. Fanatic and hooligan fans with high loyalty to their team have higher averages in fan behavior variables other than club membership and second-team support variables. The motivation of classical and social fans, who are less committed to the team, to spend time with friends, entertainment, and watch matches for the players they are interested in is higher than other fan groups.
Distribution of Fan Typologies According to Variables.

*Turkish Lira.
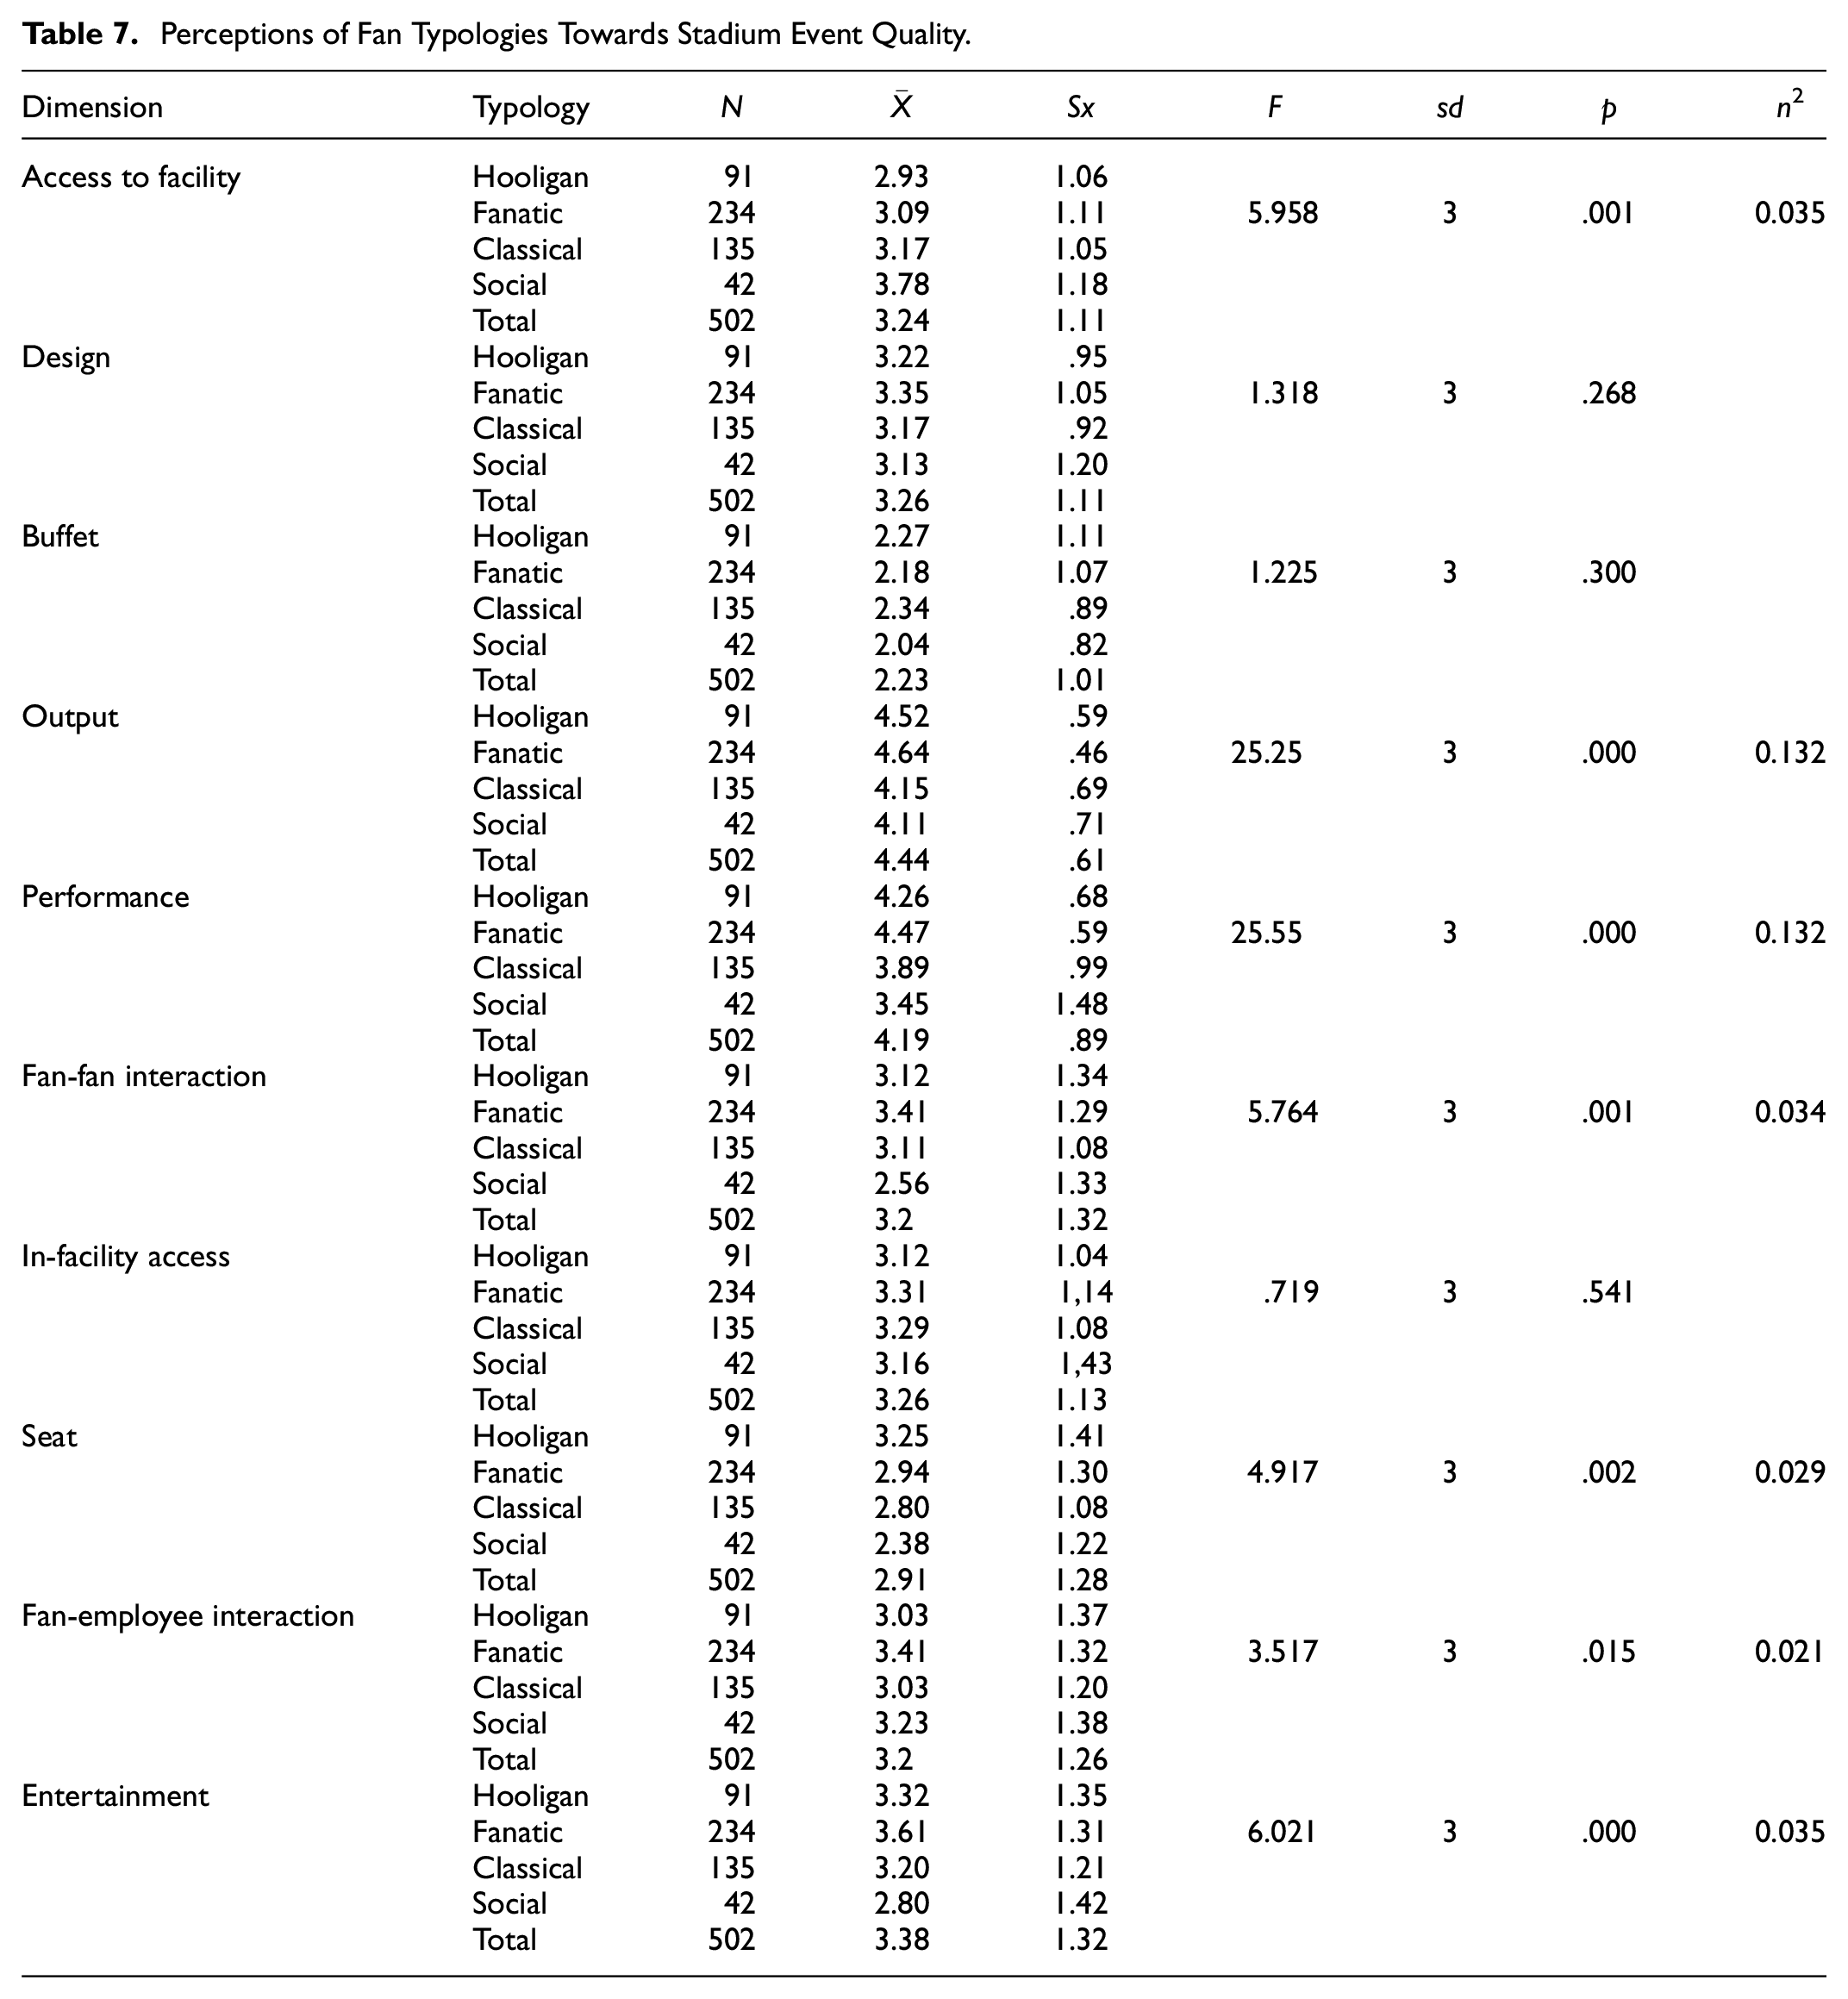
Fan typologies’ perceptions of output, performance, facility access, fan-fan and employee-fan interaction, seating, and entertainment quality differ significantly. The lowest averages belong to the dimensions “facility access,”“seating,” and “buffet” (Table 7).
Perceptions of Fan Typologies Towards Stadium Event Quality.
Discussion
The scope of the research is primarily aimed at developing a valid and reliable measurement tool that can divide fans into typologies. The analyses in this direction determined that the scale comprises 35 items grouped under seven dimensions. The item statistics obtained from EFA and the goodness of fit indices obtained as a result of CFA, in light of the literature, show that the scale has a valid and reliable structure, and it was determined that this structure explained 59.240% of the fan typology. Product use, following, watching behavior, information collection, belonging, tendency to violence, and sensitivity to the score dimensions that constitute FTS are similar to the studies conducted in the national and international literature (Dwyer et al., 2016; Hunt et al., 1999; Mahony et al., 2000; Sutton et al., 1997). However, most of these studies, these dimensions were not designed as separate dimensions, represented within other dimensions with a limited number of items. The dimensions of “tendency to violence,”“sensitivity to the score, ““following, “ and “belonging” have been used as separate dimensions in limited studies (Dwyer et al., 2016; Wann & Branscombe, 1990; Salman, 2008).
In order to answer the question of how many typologies the fans are gathered under, a two-stage hierarchical clustering analysis was conducted. As a result of the analysis, four fan clusters were obtained. It was determined that the first and second-cluster fans had the highest averages in the dimensions of belonging, sensitivity to the score, watching behavior, following, product use, and information collection. The factor distinguishing these fans with high team loyalty from each other was the averages in the violent tendency dimension. For this reason, the first cluster was named “hooligan” because the literature (Hunt et al., 1999; Dunning, 2000; Spaaij, 2006) defines hooligan as a group of fans who have a strong loyalty to their team but have a tendency to violence. The second cluster, which has a low tendency to violence, high averages in all other dimensions, and a high commitment to its team, is called “fanatics,” as defined by Hunt et al. (1999). These fan groups also have higher averages and percentages than other fan groups in terms of watching a match, watching a match at the stadium, owning a season ticket, being a member of a fan group, supporting their hometown team, and going to away matches.
The third cluster ranked third in all scale dimensions except violent tendency and in the majority of demographic and fan behavior variables. While fan types with these characteristics are defined in the literature as “focused fans” (Sutton et al., 1997) and “those who support the team in good times” (Salman, 2008), this group was named “classic fans” in our study.
The fourth cluster has the lowest averages in all dimensions and the majority of variables. The most determining factor of this cluster, whose loyalty to the team is lower than other fan clusters, is the motivation to watch matches. The primary motivation of this group is to have fun, spend time with friends, and watch players they are interested in. For this reason, this fan group is called “social fans,” which is used in the literature to describe fans with similar characteristics (Kearney, 2003; Sutton et al., 1997).
As a result, four fan typologies were obtained from the study. Among these typologies, it was determined that the loyalty of fanatic and hooligan fans with similar averages was high, the loyalty of classical fans was medium, and the loyalty of social fans was low. When the literature was examined, it was determined that typology or studies on team commitment were studies that listed team commitment sequentially as “low,”“medium,” and “high” (Funk & James, 2001; Salman, 2008; Sutton et al., 1997; Wann & Branscombe, 1990). However, this study has two typologies with high team commitment. These results are significant as they show that fans can be represented in different typologies even if they exhibit similar behaviors or have the same loyalty to the team. Shuv-Ami and Toder Alon (2020) also state that the fact that fans’ loyalty to the team is similar does not mean they will show the same behaviors. Researchers base this situation on social and personal identity theory. He stated that personal identity-oriented fans may react differently to the same stimulus than social identity-oriented fans. For example, a referee’s wrong decision may cause social identity-oriented fans to express their opinions about the referee loudly by using the support of other fans. In contrast, personal identity-oriented fans may be very upset about this situation but may not show aggression.
Within the scope of the research, the question “Does the quality perception of sports events differ according to four fan typologies?” was tested. As a result of the analyses, there was a significant difference between the typologies in seven of the ten dimensions constituting the quality perceptions of the sports event (Seat, access to the facility, performance, output, fan-fan interaction, fan-employee interaction, and entertainment). These results show that quality perceptions may vary according to fan typologies. For this reason, it is essential to examine the studies on the fans’ perception of quality according to typologies. Otherwise, quality studies conducted without dividing into typologies may give erroneous results. For example, when we take the fans as a single group without dividing them into typologies, it is determined that the average performance quality perception of the fans is 4.11.
In contrast, when the averages are examined according to the typologies, it is determined that the performance average of the social fans is 3.45 (Table 6). It was also found that the situation regarding entertainment and fan-supporter behavior was similar. Based on these results, it can be said that more detailed results can be achieved with quality studies carried out according to typologies.
When quality perceptions were examined according to typologies, it was determined that the averages of fanatic and hooligan fans with high team loyalty in all dimensions except employee-fan, buffet, and access to the facility were higher than the classical and social fans (Table 6). There are studies in the literature that support this conclusion (Al-Wasel, 2016; Salman, 2008). The higher perception of the quality of hooligan and fanatic fans with high loyalty to the team can be related to the expectations of the fan groups. For example, the high sensitivity of hooligan and fanatic fans to the score may have caused these fans to prioritize the score and performance and to have low expectations for quality elements such as other seats, access to facilities, and entertainment. In line with this view, Mahony and Moorman (2000) concluded that “high identity” fan behavior will be less affected by service characteristics. A fan who participated in Halıcı’s (2018) study explained this: “The quality of the game on the field is very important for me to say that I watched a quality match. It doesn’t affect me whether the water is hot or cold. What I see on the field is quality for me.” Therefore, low expectations may have caused the perception of quality to be high.
When evaluated for classical and social fans, it can be seen that the primary motivation of these fan groups, which are less sensitive to the score, is socialization and entertainment. As stated by Fillis and Mackay (2014), it has been determined that fans with high socialization motivation will stop going to matches or give up their season tickets if their socialization needs are not met, regardless of the team’s status. Therefore, these fan groups can participate in different events to meet their entertainment and socialization needs. Considering the monthly income average, these fans, who also have the opportunity to diversify their activities, may have increased their expectations by comparing the service they received from different events with the stadium services. High expectations may also have caused the perception of quality to be lower than others. In this regard, measuring the fans’ expectations in quality perception measurements is essential.
These results show that fan typologies may have different perceptions and that sports clubs should be aware that there is no single type of fan and should try to increase their perception of quality by developing different strategies for all fan types. These results support Fillis and Mackay’s (2014) view that all fans should not be treated as a homogenous structure, and different strategies should be created. Providing quality service in line with the fans’ expectations can increase the participation of classical and social fans, whose loyalty to the team is low, in the competitions. Theodorakis et al. (2001) also found that participants with low and medium levels of team identification will increase their desire to attend more matches as the service quality increases. In addition, although the perception of quality increases as loyalty to the team increases, as the research results show, the quality perception of hooligan and fanatic fans with high loyalty is not satisfactory. Therefore, although Theodorakis et al. (2001) do not agree with this view, the participation of highly committed fans in competitions may decrease due to low service quality, as Brown et al. (1993) stated.
In addition, with the right strategies for these fan typologies, there may be a transition from social fans to classical, classical, and hooligan fans to fanatical fans. Fillis and Mackay (2014) expressed a similar view, stating that there may be transitions between fan typologies and that there may be an evolution from ordinary follower to fan, from socially committed fan to committed supporter.
As a result, it was determined that fans consist of different typologies, that violent tendency, information collection, product use, following, sensitivity to the score, belonging, and watching behavior dimensions are the factors that determine the typologies; and that the quality perceptions of the fans towards the sports event vary according to the typologies. For this reason, it can be said that sports clubs should analyze fans, divide them into typologies, and develop different communication strategies to ensure all fan’s satisfaction.
Limitations
The “Fan Typology Scale” was developed for football fans. The construct should be retested to determine whether the proposed conceptual framework is applies to other team sports events. The developed scale designed for fans watching the match in the stadium. However, different types of fans may be loyal to their team at different levels, even if they do not watch the match in the stadium. For this reason, future studies can reveal fan types without looking for criteria for watching matches in the stadium. In this study, fans’ perception of quality was measured. However, measuring expectations and perceptions in future studies may provide more detailed results.
Implications for Clubs
Based on these results, the following recommendations can be made:
When looking at the strategies that can be applied to typologies, reinforcement strategies can be applied to fanatic and hooligan fan groups already highly committed to the team. For example, since fanatic and hooligan fans are the fans who watch the most matches and go to away games the most, notable organizations can be made by the club for both home and away matches to ensure the continuity of these habits. The fact that access to the facility is low in the quality perception of these fans shows the importance of measures that will provide access to the stadium for these fans. Another situation where continuity must be ensured is product use. In order to encourage these fans, whose product use is high, to use more products, even though their average monthly income is lower than other fans, discounts can be applied on products depending on their attendance at the match. Marketing team products in combination with match tickets can also increase product usage by these fans.
For these fans who are highly committed to the team, events that bring team players and fans together, such as signing days and opening training sessions to fans, can be planned. In addition, considering that hooligan and fanatic fan groups have a high follower average, social media and YouTube channels should be used effectively. In this regard, exciting events can be organized, such as fun competitions for team players and coaches and a question-answer event where players answer the questions of the fans, as done by the Vakıfbank Volleyball Team (Fanatik, 2021), which received an award in the “Social Media Management” category at the International Mercury Excellence Awards.
The high average of information collection of these fan groups shows that the fans have information about the team’s establishment, current situation, and past successes. Especially considering that these fans are highly sensitive to the score, it may be essential to emphasize past successes in periods when the scores are negative.
The most crucial difference between fanatic and hooligan fans, who have high loyalty to their team, is the violent tendency of hooligan fans. Violent incidents may cause sports clubs to suffer financial losses, stadiums to be closed, and other fans to stay away from stadiums due to security risks. For this reason, sports clubs need to conduct scientific studies and give educational seminars to reveal the reasons for the hooligan fan group’s tendency toward violence. In addition, considering that negative scores are one of the reasons why hooligan fans engage in violent behavior, highlighting the elements of entertainment and socialization may make these fan groups less affected by the score. With the precautions taken and the training provided, this fan group can be transformed into fanatic fans by reducing their tendency towards violence. It may be essential to develop strategies based on empathy that will enable fans to understand the feelings of athletes in activities to be carried out for violent fans. For example, the Roma football team brought a fan who criticized Cengiz Ünder for a missed position on social media to the stadium. The fan who experienced the same position he criticized expressed his regret at the end of the event.
Social and classical fans, whose loyalty to the team is lower than other groups, can be expressed as fan groups that need to be acquired by the clubs. These fan groups are sensitive because they have a low support rate for their hometown team and a high support rate for the second team. Emotional detachment from the team can be pretty easy if expectations are not met. Therefore, it can be recommended for sports managers to focus on service quality perceptions for these fans other than the core product, such as score and performance. The low sensitivity of these fan groups to the score increases the importance of other factors that determine the quality of the event. Therefore, increasing the perception of events’ quality can increase these fans’ participation in the match.
The averages of the social and classical fan groups’ perceptions regarding the entertainment dimension, one of the quality perceptions of the event, are lower than the others. Failure to meet expectations regarding socialization and entertainment motivations may negatively affect fans’ participation in competitions. Pre-match and halftime events can be organized to increase the involvement of this fan group, whose match viewing average is low compared to other fan groups. For example, before the match, playgrounds can be placed around the stadium; a concert can be held, setting up fan zone areas to bring athletes and fans together before the match, or quiz events can be held with the participation of fans, as is done during the halftime of many basketball matches.
Participating in competitions with family or friends is vital for social and classical fan groups. For this reason, family incentives can be given, especially during ticketing processes. In addition to family incentives, children’s areas can be set up in certain stadium parts so families with children can attend the competition, as Başakşehir FK has done. In addition, these fans can also participate in competitions for the players they are interested in. Therefore, the inclusion of star players in the team and the participation of these players in social events can increase loyalty.
Scientific studies are needed on the reasons for classic and social fans’ low average product usage. Although the average monthly income of fans with high team loyalty is lower than others, their product usage is high, which may be because these fans use products to support the team rather than the quality or benefit of the product. However, although the average monthly income of classical and social fans is higher, the lower product usage may be associated with the high-quality expectations of these fans. Therefore, improving the product quality for these fan groups may also increase use. Special hospitality packages can be made for these fan groups whose average monthly income is higher than others. These packages include events that will provide unique experiences for the fans, such as being picked up from the match by VIP vehicle, meals, and meeting with the players before the match.
The average information collection of social and classical fans is lower than that of others. Therefore, creating informative content for these fan groups before the matches, such as the importance of the match and past achievements, can contribute to increasing the level of knowledge. In order to improve the information average, events can be held during the halftime of the competition to reward legendary football players or coaches who have served the team. In addition, considering that the entertainment motivation of these fans is higher than the others, the creation of interactive learning environments such as games, quizzes, and competitions before the competition or between halftime in order to increase the average knowledge can contribute to the increase of the average knowledge by making learning fun.
Footnotes
Acknowledgements
We would like to thank Gazi University Academic Writing Application and Research Center for proofreading the article. We would like to thank Ayfer Sayın for supported the analysis of the study.
Declaration of Conflicting Interests
The author(s) declared no potential conflicts of interest with respect to the research, authorship, and/or publication of this article.
Funding
The author(s) received no financial support for the research, authorship, and/or publication of this article.
Ethical Approval
This study was initiated due to the application made to the Gazi University Ethics Commission, with the decision dated 27.12.2022 and numbered 22, and receiving approval that there was no ethical objection.
Data Availability Statement
The raw data supporting the conclusions of this article are available on request to the corresponding author.
Author’s note
This study was developed from the doctoral thesis.