
Abstract
Older adults play a significant role in society. They make valuable contributions to their families, communities, and economies. However, their mental health is often overlooked, and this can have consequences for their functioning, the societies in which they live, and those who depend on them. Social support’s beneficial role on mental health is well studied. However, the mechanism of social support’s beneficial role is often debated, with a wide range of studies showing varying result. This paper aims to contribute to understanding older adults’ mental health drivers in the Norwegian context, in particular focusing on the stress buffering effect of social support on negative life events’ effect on mental health. Data from the third wave of the Norwegian study on the life course, aging and generation study (NorLAG) were used, focusing on those aged 67 or over. Multiple regression analyses showed no evidence for the buffering effect of social support.
Background
The world’s population is aging at a fast rate. The number of older adults is expected to double from now until 2050, constituting nearly 22% of the global population (WHO, 2017). Already 20% of those considered older adults suffer from a mental health or neurological illness (WHO, 2017). When combined with the increasing elderly population, this is expected to pose significant societal and scientific pressures on communities to cope with these diseases’ burden. The pressure posed by these health conditions is further consolidated by the fact that mental health conditions are under-reported by those affected and further underdiagnosed by healthcare professionals (WHO, 2017). Furthermore, unattended or poorly treated mental health illnesses are known to intensify their disease burden further, that is, they worsen an individua’s social functioning, functional ability, and health problems. Together they lead to increased consumption of healthcare, hospital admissions, and increased mortality, as well as higher costs for healthcare services (Klug et al., 2019).
Similar findings have been reported in the Norwegian context. It is reported that over the period of 1 year, between 16% and 22% of adults will experience a mental health illness, such as anxiety and depression (NIPH, 2016b). This is represented in the number of visits to healthcare facilities, wherein 2015, 10% to 15% of the adult population sought help from their family doctor due to mental health illness. Research shows that 50% of those suffering from one mental health illness will also suffer from one more illness within the year. Further, other data reveals that many with a mental health illness will not seek medical assistance (NIPH, 2016b).
Government data reveals that the consumption of prescription drugs for treating mental health illness has been relatively constant over the last decade, with drug usage increasing with Age. For example, older adults consume more anxiolytics than other age groups.
(NIPH, 2016b). More specifically older adults, recent studies from Norway and other EU countries show the prevalence of mental health symptoms amongst older men and women is 12% for 60 to 64 years old, between 10% and 15% for 60 to 80-year-olds, and 21% for those aged between 86 and 90. Other studies show the prevalence of mental health symptoms increasing in the current older generation compared to previous older generations, that is, symptomology increased from 12% to 21% from 1995 to 2006 (NIPH, 2016a). Thus, the relevance of older adults’ poor mental health becomes evident when considering the significant number of the affected population and the costs incurred to society in managing their illness. Furthermore, we do not completely understand mental health problems, and this paper thus seeks to gain a deeper comprehension of the mental health of older adults.
Negative Life Events (NLEs)
NLEs are stressful events with significant negative implications for a person’s psychological well-being (Carlson, 2014). As observed in a study by Cleland and colleagues, the most common life events having significant adverse effects on mental health were severe negative health outcomes, relationship problems, and the passing of a loved one (Cleland et al., 2016). Further, their study found that NLEs had a more significant effect on mental health than positively perceived life events and that the magnitude of the adverse effects was similar (Cleland et al., 2016). Despite these findings, we should not overestimate NLE’s effect on mental health since, in a meta-analysis based on 25 studies, Kraaij et al. (2022) found only modest associations between NLE and mental health, measured by a depressive symptom questionnaire. However, due to the study design’s nature, causal inferences could not be made. One potential explanation for the limited effect of NLEs on mental health lies in the stress, support, and buffering hypothesis formulated by Cohen and Willis (1985). In short, this hypothesis assumes that the social network can buffer the effect of a stressor on mental health. Therefore, this study aims to better understand the associations between NLEs and mental health by examining the moderating role of social support on the association between NLEs and mental health.
Previous Studies on the Stress-Buffering Effect of Social Support
In recent decades, the focus on social support’s role in mental health has increased. Popularized by Cohen and Wills, their review titled “Stress, social support, and the buffering hypothesis” examined the relationship between social support and psychological well-being. Specifically, they examined if a protective buffering effect was present in shielding persons from the possible deleterious impacts of stressful life events; or if it was due to the direct favorable role of social support through the direct-effect hypothesis (Cohen & Wills, 1985). Overall, their results showed a mixture of social support’s buffering role and the direct benefit of social support. They posited that functional aspects of social support (i.e., emotional support) are more likely to be related to a stress-buffering effect because of its ability to meet the stressor’s demands (Cohen & Wills, 1985). This contrasts with structural aspects of social support, which they contend is more likely related to a direct beneficial effect on mental health because of its ability to utilize broader social resources (Cohen & Wills, 1985).
Similarly, mixed results have been seen in more recent studies, for example, the cross-sectional study by Cruza-Geta et al. on older adult Hispanics in the US. They examined various theorized social support mechanisms, including the buffering and direct effect hypotheses. Their study found an association between received social support and better mental health outcomes, that is, support for social support’s direct effect. Unexpectedly, no association for the buffering hypothesis was found (Cruza-Guet et al., 2008).
Likewise, a study by Hashimoto et al. consisting of a 6-wave longitudinal study examined the effects of stressful life events and social support on depressive symptomology (Hashimoto et al., 1999) showed the direct beneficial effect of social support since those with higher social support had fewer depressive symptoms before an NLE occurred. Further, the stress-buffering effect was seen after the occurrence of an NLE in those who perceived mid-to-high- social support since they reported no change in their depressive symptomology. This contrasts with those who had perceived low social support and reported significantly worse depressive symptoms after the NLE. These mixed results reveal the complexity of a phenomenon like social support and further emphasize our need to develop research to fill the gap in our knowledge about mental health drivers.
Problems With Previous Buffers
Overall, the number of studies on the stress-buffering effect of social support that focuses explicitly on older adults is modest. Studies have yet to show a clear and significant presence of social support’s stress-buffering effect, where results are not mixed. Furthermore, most studies have used only small samples that may not represent the population or lack sufficient power, as NLEs are often scarce.
Other reasons for varying and mixed results could be the studies’ design limitations. For example, the previously mentioned study on Hispanic US citizens by Cruza-Geta et al. is cross-sectional in design. So, causality cannot be assumed, and its conceptualization of social support may be considered rudimentary. Moreover, the data collection occurred in older adults’ homes, often in the presence of family members or a spouse, and this may negatively affect the collected data’s reliability since participants may answer differently if they were alone (Cruza-Guet et al., 2008). Further, the candidates selected for the study were of Cuban descent. This may affect the study’s findings and the ability to generalize the results due to the participants’ uniqueness; many of them were likely to be political refugees and so inclined to negative psychological influences due to their past experiences and conditioning.
Likewise, the longitudinal study conducted by Hashimoto et al. was not a representative sample; it consisted of 321 participants, which can be considered very modest. Of these, 18 were excluded for not meeting the inclusion criteria, that is, amongst others, due to not answering all six waves, sickness, or medications that can impair judgment. This left only 303 participants participating in the study’s six waves, representing a considerable percentage of the omitted sample (Hashimoto et al., 1999). Further, 170 participants of this sample, or 56%, had a missing mental health score in more than one wave and were omitted in their analysis. Moreover, 31% of observations were also omitted due to missing an observation (Hashimoto et al., 1999). Also, their NLE variables may have been interdependent, with questions addressing different aspects of health that could have produced overlapping answers. For example, questions measuring health were “personal injury or illness” and “sleeping habit” changes (Hashimoto et al., 1999). Thus, the small sample size, the high number of missing observations, and the choice of variables may have contributed to mixed and ambiguous results.
Thus, this paper aims to better understand social support as a buffer of NLE’s in the older population’s mental health. Understanding the role of social support may help inform policies to improve mental health outcomes in older adults. According to our knowledge, no such empirical study has utilized a large population-based dataset as large as NorLAG or shown a significant buffer effect in a representative dataset. NorLAG is a large dataset both in terms of the number of participants and the variables measured. As a result, it is considered to be a comprehensive dataset and representative of the whole population. This eliminates many of the previous studies’ pitfalls in the stress-buffering hypothesis (Cruza-Guet et al., 2008; Hashimoto et al., 1999). The theoretical reasoning for this study design is described below.
The Association of NLEs With Mental Health
The influence of life events on mental health has been widely studied, with many studies concluding that NLEs are significantly associated with poorer mental health outcomes (Kendler et al., 1999; Paykel, 1978, 1994). Further, researchers have also concluded that there are more robust associations between stressful life events and mental health illness than between stressful life events and physical illness (Salleh, 2008). This is in concordance with Holmes and Rahe’s study, where their scale of 43 life events with corresponding stress scores showed that the accumulation of a certain amount of stress is significantly associated with illness (Holmes & Rahe, 1967), and this has been validated in various studies (Cohen, 1996; Rahe et al., 1970; Thoits, 1995).
Despite this positive correlation, it is widely accepted that the relationship between life events and mental health is multifaceted. The vulnerability to stress differs from individual to individual and group to group (Salleh, 2008). For example, numerous international studies suggest that older adults have better mental health than younger adults (Alonso et al., 2004; Jacobi et al., 2015). One plausible explanation for the difference in mental health has been the protective role of Age and life experiences. Scholars argue that Age follows wisdom, implying that older adults can regulate emotions and make difficult social decisions due to a long lifetime of experiences (Thomas et al., 2016). Another explanation that has gained footing is the age-related positivity effect. This theory posits that older persons perceive less negative emotions, have more effective emotional regulation, and have more positive thought preferences as they Age (Reed & Carstensen, 2012).
In contrast, individual differences in mental health have been linked to the individual’s social and personal characteristics. For example, the number of social resources a person has, that is, social support (Cohen & Wills, 1985), personality factors, that is, personality traits (Ayotte et al., 2009; Mitchell et al., 2020), and the degree of mastery (Gadalla, 2010). For this paper, only social dimensions are explored and are discussed below.
The Stress-buffering Role of Social Support
According to Lazarus and Folkman’s theory of transactional stress and coping, this variation may be due to an individual’s appraisal of the NLE, where an appraisal is defined as the cognitive method by which stressors are given meaning (Lazarus & Folkman, 1984). Their theory distinguishes two appraisals; first, where a stressor is deemed stressful or not. Second, the resources available to deal with the stressor are evaluated to decide whether they are sufficient.
Specifically, stress resulting from an NLE occurs when there is a mismatch between the demands of the NLE and the resources an individual has available to deal with it. This mismatch results in coping. Those with more significant resources, that is, social support, should be better able to deal with the stress imposed by NLEs. More specifically, the stress-buffering hypothesis emphasizes perceived social support, which is thought to remove or lessen NLE’s effects on health outcomes (Cohen & Wills, 1985). In cases where the demands of the stressor outweigh the available resources to cope, stress is presumed to affect health outcomes by activating physiological systems and negative coping behaviors. For example, they lead to affective dysregulation (thus, increasing anxiety and depression) or substance abuse (i.e., nicotine and alcohol), and unhealthy behavioral patterns (i.e., poor sleep and unhealthy eating habits; Cohen et al., 2019). Further, over extended periods, these deleterious coping strategies contribute to the development of physical and mental health conditions (Cohen, 2004; Cohen et al., 1995). Overall, the validity of the stress-buffering hypothesis has been tested in numerous studies, and the results remain mixed, as mentioned in previous examples.
Regarding this study’s design, it is expected that older persons will have better mental health status than younger persons, following international findings. It is also expected that those who do not experience an NLE will have better mental health status than those who do. Further, it is expected that those who report receiving social support will have better mental health scores after experiencing an NLE than those who do not, owing to the stress-buffering effect of social support.
Hypotheses
In short, the hypotheses for this study are:
H1: Older adults will have higher mental health scores than younger adults.
H2: Older adults who experience an NLE will have lower mental health scores.
H3: Social support will buffer the effect of NLE’s on mental health scores for all NLE’s.
Method
Study Sample
The dataset used is taken from the third wave of the Norwegian study on the Life Course, Ageing, and Generation (NorLAG) conducted in 2017, composed of a representative sample of people aged from 50 to 94 years (Veenstra et al., 2021), and including all surviving participants who were born in 1922 to1966. Data was collected using computer-assisted phone interviews and a self-completed or web-based questionnaire. Only variables from the third wave of NorLAG were utilized to see an apparent buffer effect of social support, where the selected NLE’s were answered in retrospect. This meant that the mental health score was from the interview time, while the NLE’s occurred within 1 year before the interview.
This was particularly important for this study to avoid pitfalls encountered in previous studies utilizing longitudinal designs. More specifically, this study utilizes NLE’s that have occurred relatively recently. So, their effects on mental health are more likely to be present, that is, coping strategies that may lessen NLE’s impact on mental health have not been utilized. This may be the case if utilizing data from 2002 and 2007, which occurred from 18 to 13 years ago, so the relationship between mental health and the NLE’s may produce less significant results. For example, some experts claim the psychological distress associated with the passing of a close associate can last from a few months to lifelong, with the latter only being in exceptional circumstances, that is, when a parent loses a child (Miller, 2011). As a result, measuring the mental health after the passing of a close associate from over a decade ago will almost certainly produce less significant results since the effect on mental health has already lessened owing to the grieving process has come to an end. Wave 3 of NorLAG comprised 6,099 participants aged 50 to 95 (Veenstra et al., 2021). Respondents were from all over Norway, stratified according to Age, gender, region, and closeness to the municipality center (Veenstra et al., 2021). This meant there were 78 strata, where unfilled strata were replaced with newly sampled respondents.
Additionally, extra samples were added to counterbalance for participants leaving the study (Veenstra et al., 2021). The response rate for the third wave was 68%, where 73% also returned the questionnaire (Veenstra et al., 2021). Furthermore, data from the national registers were also a part of the dataset. For this study, respondents who were 67 and over were selected since 67 is the pension age in Norway, and pension age generally signifies older Age. This resulted in a sample size of 2,589 participants consisting of 1,281 male and 1,308 female respondents). Overall, the item-non response in the SF-12 is very low (Veenstra et al., 2021). Among the available older respondents, 97.5% answered the SF-12 survey. Other than Age, no further criteria for selecting participants were used.
Analytical Strategy
Univariate analysis was conducted to provide the basic description of the respondents using the software package IBM SPSS statistics, version 26. The frequency, mean, standard deviation, and percentage of respondents were reported for the variables used in this study. The variables used are Mental Health score, NLEs, Age, Gender, and Education. Furthermore, Independent samples T-tests were carried out for the two groups of any given NLE, that is, those who experienced an NLE and those who did not, where their mean mental health scores were compared.
For those NLE’s in which a t-test indicates that the average mental health score is significantly different for the two groups, we will then explore these further using multiple regression analysis to investigate the predictive capability of the NLE’s for the mental health score (Pallant, 2016; Tabachnick & Fidell, 2013). Regression analyses were used to examine social support’s buffering effect in the respective models. This was carried out conclusively with the methodology described by Aiken & West in “Multiple regression: Testing and interpreting interactions” (Aiken & West, 1991). This method involves computing an interaction term by multiplying the NLE and social support and then using the NLE, social support, and interaction term as predictors of the dependent variable in a regression.
Measures
Mental Health
Mental health has been operationalized as the 12-Item Short-Form Health Survey’s mental health component. The SF-12 survey is based on the original 36-Item Short-Form Health Survey, incorporating identical health spheres included in the original survey but with significantly fewer questions. This makes it an effective and convenient tool to administer and report the self-reported health status of participants. Furthermore, the validity of the SF-12 survey has been verified in numerous studies that demonstrate its suitability for representing the mental health status of individuals (Huo et al., 2018; Salyers et al., 2000) and for its measure of mental health disorders (Gill et al., 2007; Vilagut et al., 2013).
In sum, the scores generated by the SF-12 mental health component represent participants’ self-reported mental health status. Answers can range from 0 to 100, where 0 represents the worst possible self-reported mental health score, and 100 represents the best possible self-reported mental health score.
Negative Life Events (NLEs)
The NLE’s in this study have been selected following the Holmes and Rahe stress scale. Though the Holmes and Rahe stress scale utilized 43 stressful life events for their study, this study will utilize only six variables to test the hypotheses. The NLE’s are Divorce, Death of a spouse, Death of a parent, Death of a sibling, Death of a close friend, partner becoming seriously sick, and life-threatening personal injury/sickness. They correspond to the following variables from the Holmes and Rahe scale: Divorce, Death of a spouse, Death of a close family member, Death of a close friend, change in the health of a family member, and personal injury or illness.
The NLE’s variables were selected from the Holmes and Rahe stress scale owing to the events and the overall scale’s proven significant predictive ability for mental health outcomes (Holmes & Rahe, 1967; Noone, 2017); but also because they were available through the NorLAG study and occurred within the last year. This was necessary for ensuring the events’ recentness and so that their effects on mental health would still be present.
Furthermore, Rahe and Holmes utilized a sum score of stress from the NLE’s in their study to see the combined effect of total stress on health. However, this study will solely focus on the buffering effect on each event. The rationale is that the Rahe Holmes’ stress scale was developed using the average patient-reported numerical estimate of the stress each event causes. Despite these stress scores and associated illnesses correlating to +0.118, studies show that the results were not equally correlated when testing this scale alongside differing populations within a given country, between different countries, and cultures.
The reason for this is that different groups hold different attitudes to individual stressors, which consequently influences the points they give to each stressor. As a result, the overall cumulative stress score is considerably different between different groups, as is the likelihood of illness (Noone, 2017). Moreover, chronic stressful events are thought to affect mental health more than acute ones negatively, so it seems arbitrary to sum them into one score (Cohen et al., 2019). Additionally, the selected NLE’s are consistently ranked as those causing considerable stress, even when the validity of the Holmes and Rahe scale has been re-assessed for reliability (Noone, 2017). As a result, they are more likely to affect mental health significantly and can be investigated further.
In sum, the NLE’s responses were recoded to be dichotomous, representing “No” or “Yes” if the event occurred. For Divorce and widowhood, national register data were used to select married participants in 2016 who divorced or became widowed in 2017. These events were also recorded as dichotomous, and responses were “No” or “Yes.” Recoding all the NLEs to have the responses allows for a more straightforward statistical analysis.
Moderator Variable
The moderator/buffer in this study is social support (as shown in Figure 1). The variable “emotional support/comfort received” is used to operationalize this concept, and this operationalization will be used to represent the concept of social support throughout this paper.

A schematic overview of the stress-buffering effect of social support: Association between social support, NLE, and mental health.
This variable is used because received emotional support encapsulates the operational definition of the social support used in this paper, as taken from the American Psychological Association to mean: “assistance or comfort to others, typically to help them cope with biological, psychological, and social stressors” (APA, 2020). Further, functional dimensions of social support, that is, emotional support, is thought to serve as a better buffer than structural dimensions of support, that is, the number of persons in the support network (Cohen & Wills, 1985).
Control Variables
The control variables for this study will be Age, Gender, and Education. These controls have been selected because of their explanatory ability on mental health scores (Barua et al., 2010; Girgus et al., 2017; Kempen et al., 1999; Krause, 2005). Therefore, controlling for these variables allows for a better study of the relationship between NLEs, social support, and mental health by limiting alternative explanations from these controls in the regression models.
Results
Table 1 provides demographic information about the study participants. There were 2,589 participants in the study. The mean age of respondents was 74.77 years, with a standard deviation of 6.12. The number of respondents who answered the mental health component of the SF-12 survey was 2,524. The mean mental health score was 55.84, with a standard deviation of 6.75.
Frequency Distribution of Mental Health, NLEs, Age, Gender, and Education.

The number of participants registered as being married in 2016 was 1,568. 0% changed their marital status to Divorce in 2017, while 2.6% registered that their spouse had died. The number of participants who answered whether a parent died in the past year was 1,743. 1.7% reported that a parent did die, while 98.3% reported that a parent did not die. The number of participants who answered whether a sibling died in the past year was 1,716. 3.6% reported that a sibling died, while 96.4% reported that a sibling did not die. The number of participants who answered whether a close friend died in the past year was 1,745. 16.6% reported that a close friend did die, while 83.4% reported that a close friend did not die. The number of participants who answered whether their partner became seriously sick was 1,713. 6.4% reported that their partner became seriously sick, while 93.6% reported that their partner did not become seriously sick. The number of participants who answered that they sustained a serious injury/became seriously sick or not was 1,718. 4.9% reported they did become seriously injured/sick, while 95.1% reported that they did not become seriously injured/sick. 49.5% of respondents were male, and 50.5% were female. National register data was used to see the highest level of Education attained by the participants. 18.5% received primary Education, 31.1% received lower secondary Education, 18% received upper secondary Education, 23.8% received higher Education at a lower level, and 8.7% received higher Education at a higher level.
Table 2 shows the mean mental health scores for respondents based on age groups. According to age group on average, participants who were 67 or older reported better mental health scores (M = 55.84, SD = 6.75) than those who were younger than 67 (M = 55.08, SD = 7.17). The mean difference in the mental health score was 0.76, which was significant (p < .05)
T-tests Showing the Mean Mental Health Scores for Respondents According to Age Group (67 and over, or less than 67), the Mean Difference Between the Two Possible Responses, and Its Significance.

It is noteworthy that the mean mental health score according to Divorce occurring in the Last year was not possible to calculate because no one who was married in 2016 (while being over The Age of 67) registered a divorce in the following year. In other words, no one divorced who was 67 or older.
Table 3 show that the difference in mean mental health scores when an NLE did and did Not occurring was not statistically significant for the life events’“Death of a spouse” (mean difference = 1.97, p-value = .18), “Death of parents” (mean difference = 0.45, p-value = .69), “Death of siblings” (mean difference = 2.26, p-value = .06), and “Death of close friends” (mean difference = 0.65, p-value = .13). Since the significance level for the difference in mean mental health scores are beyond the acceptable limit (p > .05), it indicates that these NLEs are not significantly associated with a change in mental health scores.
Independent Samples T-tests Showing the Mean Mental Health Scores According to if an NLE Occurred or Not. The Mean Difference in Mental Health Scores and the Significance is Also Shown.

For the NLE “Partner seriously sick,” for those for whom the event did not occur, the mean mental health score was 56.64, and the standard deviation was 5.82. For those for whom the event did occur, the mean mental health score was 54.80, and the standard deviation was 7.38. The mean difference in the average mental health scores was 1.84, which was statistically significant (p < .05). This implies that a respondent with a lower mental health score is associated with a seriously sick partner.
For the life event “Serious personal injury/sickness,” the mean mental health score for those for whom the event did not occur was 56.54, and the standard deviation was 6.00. For those for whom the event did occur, the mean mental health score was 54.04, and the standard deviation was 7.88. The mean difference in the average mental health scores was 2.50, which was statistically significant (p < .05). This implies that a respondent with a lower mental health score is associated with being seriously injured/sick.
A hierarchical multiple regression analysis was conducted to see a more detailed association between the NLE’s, mental health, and social support. Only the NLE’s with significant changes in mental health scores were used. “Partner seriously sick” or “Personal serious injury/sickness,” Social Support, and the controls “Age,”“Gender,” and “Education” were used as predictors for the dependent variable Mental Health. Further, the interaction term of Social Support and the NLE was entered into the regression to see any significant buffering effect of social support.
The first part of Table 4 presents the regression of Mental Health on the event “Partner seriously sick,” support, the control variables, and the interaction term between support and the event. The unstandardized coefficient B is −1.97, which is significant (p < .05). This implies that a one scale unit increase on “Partner seriously sick” (i.e., the respondent’s partner became seriously sick) would likely decrease 1.97 scale units in mental health score. In other words, experiencing this event will significantly decrease the mental health score. This model’s adjusted R square is .01, signifying that this model accounts for 1% of the mental health score variation.
Multiple Regression Analyses Using the Predictors “Partner seriously sick”/”Serious Personal Injury/Sickness,”“Social Support,”“Age,”“Gender,”“Education,” and the Interaction Term With the dependent Variable Mental Health.
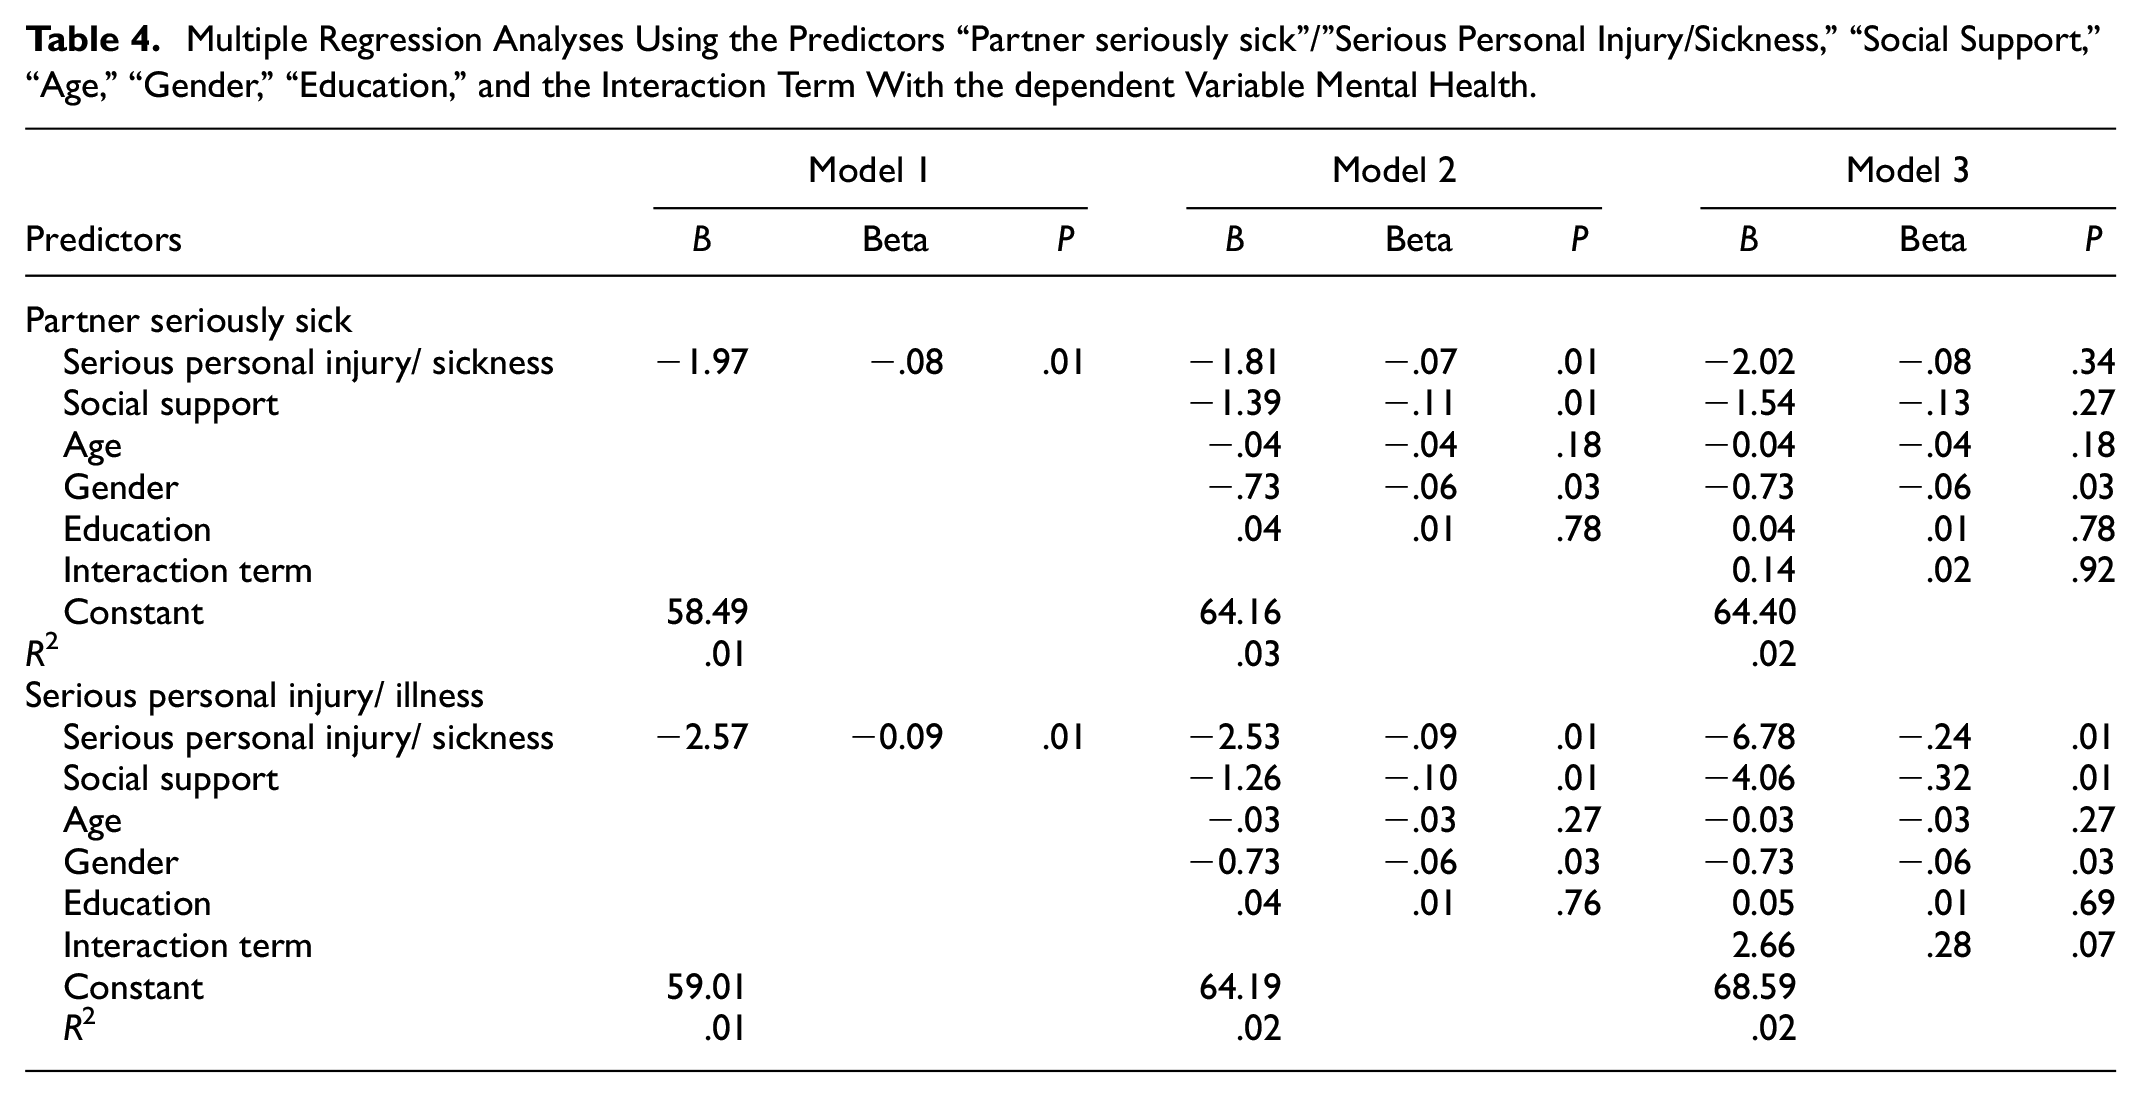
In Model 2, the predictor “Social support” and control variables “Age,”“Gender,” and “Education” was added. Controlling these variables, the unstandardized regression coefficient B for “Partner seriously sick” was −1.81, which was significant (p < .05). This means that when controlling for “Social support,”“Age,”“Gender,” and “Education,” and there is a one scale unit increase in this NLE, the mental health score will likely decrease by 1.81 scale units. This implies that the mental health score is likely to decrease when a partner becomes seriously sick. Since the B value for “Partner seriously sick” increases between model 1 and 2 from −1.97 to −1.81, this implies that this change can now be attributed to the addition and controlling for the effects of the variables’“Social support,”“Age,““Gender,” and “Education.”
Further, the unstandardized coefficient B for Social Support is −1.39 when controlling for all other variables in model 2. This means that a one-scale unit increase in Social Support results in a decrease of 1.39 scale units in the mental health score. This implies that when a respondent receives social support, their mental health score is likely to decrease, which is significant (p < .05).
The Beta value “Social support” of (−).11 has the largest, indicating it makes the most substantial contribution in explaining the mental health score when the variances explained by the other variables are controlled for (Pallant, 2016, p. 162). The other Beta values in descending order of magnitude for model 2 were “Partner becoming seriously sick,”“Gender,”“Age,” and “Education,” represented by the Beta’s (−).07, (−).06, (−).04, and .01 respectively. This implies that they contributed less to explain the mental health score. All variables except for Age and Education were statistically significant (p < .05), implying that the contributions of Age and Education to the change in mental health scores in this model are likely due to chance.
The third model includes the interaction term as an additional predictor for the mental health score. The p-value for the interaction term is insignificant (p > .05), implying that there is no statistically significant moderation effect of social support on the effects of a partner becoming seriously sick on mental health scores. Noteworthy here is that in model 3, it is impossible to meaningfully interpret the coefficients of “Partner seriously sick” independent of the interaction effect; thus, no inferences can be made about this model.
Model 2 has greater explanatory power for the variation of mental health scores, as shown by the larger R square value. This model’s R square value is .03, signifying that this model accounts for 3% of the variation in mental health scores. This implies that adding the variables “Social support,”“Age,”“Gender,” and “Education” to the first model results in model 2 as a whole accounting for an additional 2% of the variation in mental health compared to model 1. Notably, “Age” and “Education” were not significant predictors of mental health scores in this model since their p > 0.
The second part of the table presents the regression of Mental Health on the event “Serious personal injury/sickness,” support, the control variables, and the interaction term between support and the event. The unstandardized coefficient B is −2.57, which is significant (p < .05). This implies that a one-scale unit increase on “Serious personal injury/sickness” will likely decrease by 2.57 scale units in the mental health score. In other words, experiencing this event is significantly likely to decrease the mental health score. The adjusted R square for this model was .01, signifying that this model accounts for 1% of the mental health score variation.
In Model 2, the predictor “Social support” and control variables “Age,”“Gender,” and “Education” was added. Controlling for the variables, the unstandardized regression coefficient B for “Serious personal injury/sickness” was −2.53, which was significant (p < .05). This means that when controlling for “Social support,”“Age,”“Gender,” and “Education,” and there is a one scale unit increase in this NLE, the mental health score likely decreases by 2.53 scale units. This implies that when a respondent becomes seriously sick or injured, their mental health score is likely to decrease.
Since the B value for “Serious personal injury/sickness” increases between model 1 and 2 from −2.57 to −2.53, this implies that this change can now be attributed to the addition and controlling for the effects of the variables “Social support,”“Age,”“Gender,” and “Education” into the model. Further, the unstandardized coefficient B for Social Support is −1.26 when controlling for all other variables in model 2. This means that a one-scale unit increase in Social Support results in a decrease of 1.26 scale units in the mental health score. This implies that when a respondent receives social support, their mental health score is likely to decrease, and this result is significant (p < .05).
The standardized coefficient Beta allows comparing the magnitude of the contribution of each predictor to the mental health score while controlling for the contributions of the other predictors (Pallant, 2016, p. 162). Here it is seen that “Social support” has the largest Beta Value of (−).10, indicating that it makes the most decisive contribution to explaining the mental health score when the variance from other predictors is kept constant (Pallant, 2016, p. 57). The other Beta values in order of descending magnitude were “Serious personal injury/sickness,”“Gender,”“Age” of the respondent, and “Education”; and their beta scores were (−).09, (−).06, (−).03, and .01 respectively. All variables except for “Age” and “Education” were statistically significant (p < .05), implying that the contributions of Age and Education to the mental health score change in this model are likely due to chance. Furthermore, the constants could not be interpreted meaningfully in any models since 0 was no a valid response in the independent variables.
The third model includes the interaction term as an additional predictor for the mental health score. The p-value for the interaction term is not significant (p > .05), implying there is no statistically significant moderation effect of social support on the effects of a respondent becoming seriously injured/sick on mental health scores. It is noteworthy that in model 3, it is impossible to meaningfully interpret the coefficient of “Serious personal injury/sickness” independent of the interaction effect; thus, no further inferences can be made about this model.
Model 2 has greater explanatory power for the variance of mental health scores, as shown by the larger R square value. The R square value for this model is .02, signifying that this model as a whole accounts for 2% of the variation in the mental health scores. This implies that the addition of the variables “Social support,”“Age,”“Gender,” and “Education” to the first model results in model 2 as a whole to account for an additional 1% of the variation in mental health compared to model 1. Notably, “Age” and “Education” were not significant predictors of mental health scores in this model since their p > 0.
Discussion
Main Outcomes
This study assessed the effect of NLEs on mental health outcomes in Norway’s older adult population. More specifically, the responses to whether an NLE occurred or not were compared in relation to the average mental health scores to see if there was an association between the occurrence of an NLE and mental health scores. In other words, it was assessed if NLEs occurring affected mental health. The events that showed a significant association with mental health scores were further investigated for the presence of a stress-buffering effect of social support.
Results were mixed and showed that only some of the NLEs were significantly associated with a change in participants’ mental health scores. This was the case if a respondent became seriously sick or injured or a partner became seriously sick. However, the occurrence of the other NLEs did not produce a significant association with mental health scores. The results indicated that there was no discernible difference in mental health scores among participants with or without the experience of a death of a spouse, parent, sibling, or close friend. This was somewhat unexpected since all the life events in this study were amongst the highest ranked in the Holmes and Rahe stress scale, was associated with large life change units, and was verified to contribute significantly to poorer mental health (Cohen, 1996; Noone, 2017; Rahe et al., 1970; Thoits, 1995).
Despite this, the current study did not find significant differences in mental health scores for those events. One plausible explanation for the inconsistent findings among these NLEs may be the type of stressor they represent. More specifically, it is argued that chronic life events that last for extended periods are more deleterious to mental health than acute events lasting shorter periods (Cohen et al., 2019). This may be attributed to the chronic events’ continuous and ongoing effects on mental health. In this regard, the events “serious personal sickness” or “injury and a partner became seriously sick” may be stressors that exhibit their effects over long periods, that is, a respondent or their spouse has cancer, and it spreads over months to years. This is in contrast to the passing of a relative, Divorce, or widowhood, which are discreet events, that is, your partner cannot die several times, nor can you get repeatedly divorced in the same marriage.
Following expectations and various international findings (Alonso et al., 2004; Jacobi et al., 2015), older Norwegian adults had better mental health scores than younger Norwegian adults, and this association was significant. Regardless of this finding, the difference in mental health scores was only modest. Those aged 67 or older scored average 0.76 points higher on mental health scores than those below 67. These findings may be explained by the protective role of aging through life experiences and the age-related positivity effect (Reed & Carstensen, 2012; Thomas et al., 2016).
Further, in contradiction to expectations, this study found no significant buffering effect of social support on the effect of any NLE on mental health outcomes. This was not entirely unexpected, especially when considering the wealth of studies revealing mixed results when testing social support’s stress-buffering effects.
Why the Conceptualization of Social Support Might Be Critical
Many studies and theories explore the relationship between stressful events, social support, and mental health outcomes, each with their own unique conceptualizations. Perhaps this is a substantial reason for not finding a significant stress-buffering effect in this study. More specifically, the conceptualization of stress used in this study embodies the importance of received emotional support, an essential functional support measure. This is represented by choice of the variable from the NorLAG study, corresponding to the question “Received emotional support/comfort” with answers “No” or “Yes.” Thus, this conceptualization emphasizes receiving emotional support but does little to capture other functional support dimensions, such as informational support, which may play an essential role in stress perception. For example, Uchino describes the “Y2 K” computer problem, where the public perceives a high-stress level due to a computer glitch thought to shut down electronic systems worldwide (Uchino, 2004). As a result, this leads to the public hoarding food and living supplies in anticipation of a societal shutdown. He argues that if a stressed member of the public were to confer with a trusted friend who is well-rehearsed in computer systems/the Y2K glitch advising them not to worry because it is an insignificant problem; as a result, the stress perceived by the individual would decrease or disappear. This scenario was proven empirically in a study where older adults with high social support levels reported fewer daily stressors than those with low social support (Russell & Cutrona, 1991).
In the case of the stressors in this study, that is, say for the passing of a sibling/relative/friend/ parent, if someone perceives information that such an associate is terminally ill and suffering, then in such a case, their passing perhaps may not be viewed as a stressor. Though this example may not apply to all the respondents, it emphasizes the conceptualization of stress and further demonstrates the complexity of measuring a phenomenon as intricate as social support. Thus, if this study incorporated other aspects of functional social support, for example, informational support, the conceptualization of social support would be more comprehensive and better able to measure the buffering effect. This was not possible in this study since NorLAG is a pre-answered dataset; thus, it was not possible to formulate a broader conceptualization of social support since the survey data is arguably limited in relation to this study.
Further, this study measured the effect of received social support instead of perceived social support in coping with the NLE. This may explain why the results have not shown a significant buffering effect since it is more likely to find buffering effects in the latter than in the former (Helgeson, 1993). The results of this study may have been less significant due to factors such as the value provided by the social support employed (i.e., its helpfulness), the negative effect of utilizing this support (i.e., the shame of asking for money when in debt due to stigma), and the interaction of stress levels and utilization of the support (Uchino, 2004). These variables were not controlled for in this study, so they could have impacted the results. Further, this reasoning may explain why the conceptualization of Social Support in this study had the most significant magnitude of effect when used as a predictor for mental health in both NLEs, as represented by it having the highest Beta scores. Perhaps in such cases, social support utilization caused greater stress than the stressor itself, thus resulting in a greater effect from social support than from the other variables under study. This may also explain why there is a negative relationship between social support and mental health, as shown by the negative B and Beta values. This negative relationship was surprising since social support is typically associated with better mental health (Cohen & Wills, 1985).
Other Considerations
Another plausible reason for the negative relationship may be that only those grieving or otherwise have a low mood receive support; or that those with better mental health do not need support and receive less. This reasoning may explain the reversed causal direction in this study, though it would be better to explore the causal directions with prospective longitudinal research to consolidate these findings. This was not utilized in the present study as it is beyond the scope of this research; thus, a prospective longitudinal study design is recommended for future studies.
Other studies have emphasized the importance of the support itself during a stressful event and how it manifests over time according to the stressor’s demands solicited, for example, when a partner is seriously sick. In such a case, the social support received may be received mainly from the sick partner or when the respondent becomes seriously sick, and a partner becomes depressed at the thought of losing their spouse. In such cases, the spouse’s ability to support the respondent may be limited, or vice versa. In both scenarios, the social support limitation in specific NLEs becomes apparent. It places significant focus on the ability of an NLE to affect not only the respondent’s mental health, but also their social support systems. This was proven empirically in a study by Bolger et al. who showed that a breast cancer diagnosis in couples had deleterious effects on received social support over time (Bolger et al., 1996). Thus, any further research on the stress-buffering effect should consider the contexts in which perceived the respondent experiences social support to capture this complex phenomenon in more detail and reveal better associations between the concepts. This could facilitate more significant findings.
Despite the inconclusive results in revealing a stress-buffering effect of social support in the older population of Norway, further investigations of the population did reveal a significant buffering effect for respondents who became seriously injured/sick when no age criteria were used. The results reveal that in respondents who reported not receiving social support and became seriously injured/sick, then in these cases, the NLE was a significant predictor of mental health scores. This implies that a reduced mental health score is significantly likely for a respondent who experiences a serious injury/sickness without social support. Conversely, respondents who report highlight the protective role of social support on mental health and serve as a motivator for further research to better understand the protective factors of adults’ mental health receiving social support, the occurrence of the NLE did not serve as a significant predictor of the mental health score. This implies that the mental health score is not significantly changed with a serious personal injury/sickness in the presence of social support. The results highlight the protective role of social support on mental health and serve as a motivator for further research better to understand the protective factors of adults’ mental health.
Strengths & Limitations
A benefit of this study is that it utilized longitudinal data, which has allowed for causal relationships to be analyzed; and allowed for the control of factors such as Age, gender, and Education. Despite its longitudinal quality, retrospective data were used where respondents were asked about events occurring in the past year. This may have resulted in a degree of recall bias where respondents do not remember experiences precisely or overlook important details. This may be unlikely with the variables investigated in this study. The reasoning behind it merits future studies to utilize events that have occurred more recently and over smaller periods, that is, previous weeks or months. Otherwise, perceptions of an event may change over long-time periods, and their effects on mental health may diminish.
Further, this study utilized pre-answered survey data; thus, precise questions with greater specificity to the measured concepts could not be explored. Collecting specific and relevant data to this study and outside of the NorLAG dataset may have given a greater accuracy of findings and allowed us to explore which aspects of the NLE and social support are accountable for mental health changes. Thus, any future study should also utilize a custom data collection tool to measure study-specific concepts and utilize specific variables.
Conclusions
The implications of this study are far-reaching. The results suggest that NLEs may significantly impact mental health outcomes in older adults, particularly in relation to certain life events. This suggests that policymakers and other stakeholders should focus on these life events when developing strategies and interventions to improve mental health outcomes in older adults. Additionally, the study provides evidence that the effects of these NLEs were not moderated by social support, which is a significant finding. This implies that focusing on other social determinants, such as access to health care or economic security, may be more effective in improving mental health outcomes in older adults. Finally, the results demonstrate that mental health outcomes are generally better in older adults than in younger adults, which suggests that interventions should be tailored to the specific needs of both groups. Future research should focus on a more comprehensive understanding of social support and its role in mental health outcomes in older adults.
Footnotes
Declaration of Conflicting Interests
The author(s) declared no potential conflicts of interest with respect to the research, authorship, and/or publication of this article.
Funding
The author(s) disclosed receipt of the following financial support for the research, authorship, and/or publication of this article: In accordance with the rules and regulations for the use of the NorLAG dataset, the following acknowledgment has been made: The NorLAG data collections have been financed by The Research Council of Norway, four ministries, The Norwegian Directorate of Health, The Norwegian State Housing Bank, Statistics Norway, and NOVA, OsloMet. NorLAG data are part of the ACCESS Life Course infrastructure funded by the National Financing Initiative for Research Infrastructure at the Research Council of Norway (grant no. 195403 and no. 269920).
Data Availability Statement
Data is available for research, students and teaching at institutions approved by the Research Council of Norway or Eurostat by order.