
Abstract
Amid China’s dynamic economic backdrop, Economic Policy Uncertainty (EPU) and stock market indices hold pivotal roles, this research delves into EPU and its connection with the stock price index (SPI). By uncovering patterns linking these variables, the study aims to provide a nuanced understanding of their relationship. We employ wavelet coherence analysis and a phase difference approach to investigate EPU impact on China’s SPI from 2010 to 2020. Through this lens, the interactions between these economic variables are illuminated. Using wavelet coherence analysis, the temporal dynamics of EPU and SPI are explored. The phase difference approach further highlights the temporal alignment of fluctuations, capturing the intricate relationship. The analysis reveals compelling findings. A robust correlation between EPU and the SPI emerges, particularly at low frequencies, underscoring a substantive connection. The phase difference analysis indicates a positive influence of EPU on stock prices, highlighting its impact on SPI. Besides, implications imply EPU shapes stock market behavior, moving beyond mere correlation. A causal link is established, emphasizing EPU’s proactive role in influencing stock prices. Bidirectional causation underscores the interdependence of EPU and stock price movements. This research enhances understanding of EPU’s effects on stock prices in China. Finally, this study provides important implications for investors, policymakers, and businesses, guiding strategic decisions amid a dynamic economic landscape.
Introduction
The recent eruption of the pandemic COVID-19 has resulted in a discontinuity of economic and financial policies in China (Khan et al., 2023; McKibbin & Fernando, 2020). This global epidemic outbreak has also incapacitated the world’s largest superpower USA and the European continent (S. R. Baker et al., 2020). These resultant circumstances rendered the governments unable to continue their previous COVID-19 economic policies. Moreover, the inconsistent economic policies of the governments of the developed and emerging economies have resulted in financial and economic crises around the globe (Iqbal et al., 2020; Resende & Bittes Terra, 2017). For instance, the financial crises of 2007–08 in the USA occasioned a series of debt crises in the European countries and emerged as a Global Financial crisis of the last decade. In a report published in 2013, IMF identified that the loose and weak regulatory control of governmental bodies and their lethargic attitude toward the revision of financial policies, and inconsistency in monetary and fiscal policies of the developed economies caused an economic decline all over the world (C.-C. Lee et al., 2021, 2022; Tam, 2018). These uncertainties in the economic policies of the developed nations also caused a decline of 10% in stock exchanges across different countries (Chen et al., 2017). Thus, the current discussion leads a solid ground to explore a link between the economic policy uncertainties of the governments and the corresponding financial market performance operating during the COVID-19 environment in the globally second-biggest Chinese economy.
As stated by many other researchers it is hard to capture economic policy uncertainty (EPU) with accuracy due to unknown characteristics of the uncertainty. However, S. R. Baker et al. (2020) filled this gap by developing an index of EPU in the context of the USA. S. R. Baker et al. (2016) developed this index by using the data from 10 leading daily the United States newspapers. Moreover, S. R. Baker et al. (2016) defined economic uncertainty by analyzing the daily paper’s news, associated to EPU, changes in tax codes, and discrepancy among economic forecasters as a substitute for uncertainty measurement. There is enough scholarly research available that concluded that the economic policies of governments are an important determent of stock exchange volatility and firms’ fundamental characteristics, such as sales, costs of raw materials, corporate debt, and equity structure (Arouri & Roubaud, 2016; Chen et al., 2017; Drobetz et al., 2018; He & Niu, 2018; Hussain et al., 2020; Jory et al., 2020; Wu et al., 2022). These firms’ level fundamentals are reflected in the superior corporate valuations and performance of the stock markets (Gulen & Ion, 2015).
Utilizing the Wavelet method, the present research study is being carried out with the purpose of investigating the effect that the uncertainty of economic policy influences the performance of the Chinese stock markets. The application of Wavelet methodology in this study makes it unique, because wavelet methodology provides a very deep insight into the two selected variables in the long, medium, and short-run horizon (Ko & Lee, 2015; J. Wen et al., 2020). Moreover, the Wavelet approach explores the lead-lag connection amongst the selected variables across time and frequencies (Das & Kumar, 2018; J. Wen et al., 2020). The conventional econometric techniques used by various scholars Arouri and Roubaud (2016), T. Li et al. (2020), and Y. Li et al. (2019) to test the EPU and corporate or stock exchange performance do not provide a deeper understanding of this phenomena in the Chinese context. For instant, Arouri and Roubaud (2016) concluded an insignificant impact of EPU on Chinese stocks by using time series regression analysis, and Y. Li et al. (2019) reported an adverse effect of EPU on the Chinese stock market by using the GARCH approach. Thus, there is a need to further investigate this phenomenon by using newer methodologies. Thus, the current study extends the empirical work and explores the phenomena by using Wavelet approaches to provide insight into long, medium, and short-run associations, for the formulation and implementation of the policies in the COVID-19 environment.
Readers will find the current study particularly interesting for two reasons: first, it examines the effects of the coronavirus COVID-19 outbreak on the globally second-largest economy, China; and second, the Chinese economy is widely regarded as a traditionally controlled economy which is progressively moving on the European market-based economic structure. The rate of economic transformation has grown in recent decades Chen et al. (2017) and this has also led to new challenges in the Chinese economy, especially after the emergence of COVID-19. According to Chen et al. (2017) the current economic policy challenges faced by China today never existed before. The rapid growth of multinational national companies (MNCs) and the resulting growth of stock markets in China have raised the prominence of the corporate sector in the eyes of the government (X. Liu & Sinclair, 2008). The current research also provides the view to international readers about how challenging it is for the Chinese government to bring stability to their economic policies to achieve the objective of sustainable growth of stock markets during a coronavirus pandemic.
Thus, by considering the importance of the phenomenon of EPU and SPI, in particular, perspective of emerging economies of this region, where the mainstream of the listed corporations on securities exchange are either government-owned or have distilled ownership in the hands of founding families (Arouri & Roubaud, 2016; Waheed & Malik, 2019). Thus, this research gives a distinctive prospect to fill this space. Besides, the findings of this research are also generalizable to the remaining emerging economies of this zone (such as India, Bangladesh, Pakistan, etc.), because the socioeconomic system and behavioral particularities of emerging countries are similar (Fan et al., 2011; Mahmood et al., 2022; van Essen et al., 2012; J. Wen et al., 2022; H. Wen et al., 2023; Yu et al., 2022; Zhong et al., 2022). Hence, the study inflates theoretical knowledge by using a newer Wavelet approach methodology on a newer and longer data set.
The results of the Wavelet approach do not confirm the interaction of EPU on SPI in the shorter term. Though, eventually, the Wavelet approach confirmed the influence of EPU on the Chinese Composite SPI. There are a number of current studies indicate that Wavelet is considered more reliable in explaining the relationship between two-time data sets (Das & Kumar, 2018; Ko & Lee, 2015; Singh et al., 2019; Tiwari et al., 2019). Thus, current research affirms the influence of EPU on SPI long-term. Thus, the conclusions of the current study are unique to the induction of the Wavelet approach on the selected sample.
The current research is conducted in the Chinese prospect for two reasons; firstly, China is the planet’s second-biggest economy having unprecedented economic growth in the last two decades. So, governments, investors, and academicians all over the world are interested to know about it. Secondly, in the last two decades, China has adopted various western economic reforms to attract foreign investors to the country (Broadman & Sun, 1997). The rapid growth of multinational companies in China has resulted in expanding trade volume, economic growth, rising living standards, and poverty alleviation (Tomizawa et al., 2020). However, this economic growth may be prone to economic policy uncertainties (Brock & Mirman, 2001). Thus, the current research explores the influence of EPUs of the Chinese government on the economic growth of the economy (Figure 1).

EPU and PI volatility.
Literature Review
The most recent literary review provides that the incidence of COVID-19 has resulted in economic uncertainties, creating instability in international oil and gold prices, international trade, and demand for products and their supply (Albulescu, 2020; S. R. Baker et al., 2020; Sharif et al., 2020). The review of the literature further suggests that EPU has a very deep-rooted impact on the various firms-related proxies, such as stock price, corporate risk, corporate investment decisions, corporate growth strategies, firm profitability, and efficiency of the stock markets, where local and international corporations are listed (Arouri & Roubaud, 2016; S. R. Baker et al., 2016; Brogaard & Detzel, 2015; Chen et al., 2017; Gulen & Ion, 2015; Hussain & Lee, 2022; Iqbal et al., 2020; Julio & Yook, 2012; Khan et al., 2020; Pan et al., 2021; Pastor & Veronesi, 2012; Pástor & Veronesi, 2013). The researchers Pastor and Veronesi (2012) created a “general equilibrium model” that captured stock price volatility occurs due to uncertainty in governmental policies related to economic or non-economic factors. They found that uncertainties in governmental policies, especially, related to economic affairs negatively affect stock price. In Pástor and Veronesi (2013) further reported that the magnitude of the stock price fluctuation is greater in those countries which have weak economic conditions. Julio and Yook (2012) analyzed the political uncertainty that corporations face during election years. They analyzed the corporate investment cycle in 48 countries by considering 248 national elections from 1980 to 2005. Their study revealed that the uncertainty about the future governmental setup restricts corporations to invest in expansion or growth-related strategies.
In another study, Brogaard and Detzel (2015) concluded that vagueness in economic policies has a long-term impact on the financial sector. Moreover, they reported that 1% increase in economic policies has resulted in 2.9% decline in the market average yields and 18% rise in market volatility. Gulen and Ion (2015) used the EPU index developed by the S. R. Baker et al. (2016) in the context of United States America. Their study concluded that EPU has a definite effect on the corporate sector. Their study identified that economic uncertainty results in higher cash holdings in firms and it also restricts the firms to increase their borrowings. Thus, there are a series of research studies that concluded that greater level of cash holdings and lesser use of debt financing results in low growth rate and profit in corporations (S. R. Baker et al., 2016; La Rocca et al., 2019).
According to their analysis of the relevant literature, only a small number of academics have investigated the EPU relationship with the financial performance of corporations in the setting of industrialized nations. For example, He and Niu (2018) reported that EPU negatively affects the USA financial sector. Their study tested the connection of EPU among banking sector’s firms in USA. The EPU is found to have a negative effect on the Tobin’s Q used for the market measure of the performance in the USA for the banking sector corporations. A recent study by Iqbal et al. (2020) also tested the impact of EPU on the performance of non-financial sector firms in the USA and concluded that EPU negatively affects the performance of non-financial sector firms in the USA. Both these studies in the context of the USA used the index of S. R. Baker et al. (2016). Arouri and Roubaud (2016) used the EPU index of S. R. Baker et al. (2016) on the Indian USA and Chinese stock market indexes. Their study confirmed the significant influence of EPU on USA and Indian stocks and the insignificant effect of EPU on Chinese stocks. However, in another study, Y. Li et al. (2019) concluded a negative influence of EPU on Chinese stocks.
EPU plays a significant role as an asset pricing factor, contributing to the elevation of stock risk premiums (Brogaard & Detzel, 2015; Pastor & Veronesi, 2012; Yue et al., 2019) offer a comprehensive equilibrium model that underscores the risk premium component introduced by EPU. In this framework, increasing policy change uncertainties elevate the prospective rate of return volatility and the stochastic discount factor’s volatility. This elevation in risk cascades into the stock market, influencing stock prices (Bekiros et al., 2016; Liao et al., 2021; Phan et al., 2018). Rational Expectations Theory suggests that investors incorporate available information into their decisions. When economic policies are uncertain, investors may anticipate various outcomes and adjust their portfolios accordingly. If investors anticipate favorable policy changes that could benefit businesses or stimulate economic growth, they might drive up stock prices in anticipation of these potential gains.
The Theory of Information Asymmetry posits that when economic policies become uncertain, investors lack clear information about the future direction of the economy. In response, they may adopt a cautious approach, leading to increased volatility and risk aversion in the stock market. As investors seek to hedge against uncertainty, the demand for safe-haven assets like stocks might rise, potentially driving up stock prices. This increased demand can contribute to a positive correlation between EPU and SPI.
EPU can lead to increased government interventions and policy responses to mitigate uncertainty’s negative impacts. These responses, such as interest rate adjustments, fiscal stimulus, or regulatory changes, can provide support to the economy. Investors may interpret such interventions as positive signals and respond by increasing their stock holdings, potentially leading to a positive relationship between EPU and SPI.
Thus, there exists enough indication that shows EPU is linked with corporate financial performance, but there exists rare empirical evidence that explored EPU and stock market’s performance relationship as a whole, where local and international corporations are listed. Moreover, in the current COVID-19 environment, it is hard for governments to maintain a stable economic environment and policies. So, in such COVID-19 dominating circumstances the phenomenon of economic stability is very important for policymakers and regulators. Thus, the current study delivers an exclusive prospect to fill the existing gap in context of Chinese dominating economy. Based on discussion above, the research has the following hypothesis:
H1: Economic policy uncertainty has a significantly negative effect on the Stock market performance.
Data and Methodology
Variable Description and Data Source
For the analysis of underline research problem this study has used the EPU Index as an independent variable and the Chinese Composite SPI as a dependent variable because EPU and Stock prices are affected by pandemics worldwide. We want to check the variation in these variables during the pandemic. Most of the literature checked this EPU with different macroeconomics factors and conclude the different results (J. Wen et al., 2021, 2022). So, it is important to check the EPU and Stock market behavior during COVID-19. The EPU Index is originally build by S. R. Baker et al. (2016) in the context of the USA, and there are few recent research studies that used this index (Arouri & Roubaud, 2016; He & Niu, 2018; Huang & Luk, 2020; Iqbal et al., 2020; J. Wen et al., 2021). The EPU indices, which were designed and built by S. R. Baker et al. (2014), are weighted averages for each country or geographic area of three components of economic uncertainty: (1) news of policy-related economic uncertainty in various newspaper (2) the multitude of federal tax code requirements slated to expire in future years; and (3) a way of measuring of incongruity amid economic forecasters to represent economic uncertainty. In short, In this paper, EPU is measured by EPU index and serves as the primary explanatory variable, developed by M. Baker and Wurgler (2006). The index uses South China Morning Post data and indexing. The newspaper uses statistical approaches including information filtering and text indexing, specifically the EPU index in China, to calculate EPU article frequency. EPU index accurately and scientifically measures a government’s official economic policies’ tension, encompassing monetary, fiscal, and taxing policies (Kun et al., 2022). Quality assurance involves rigorous selection of reputable sources, minimizing bias, and ensuring consistency in data collection.
This study delves into the effect of EPU and stock price in China using the wavelet approach by using the monthly data for the period of 2010 to 2020. EPU index data is taken from the policy uncertainty web where countries’ indices are regularly updated (J. Wen et al., 2021). The composite SPI is taken from the Investing.com.
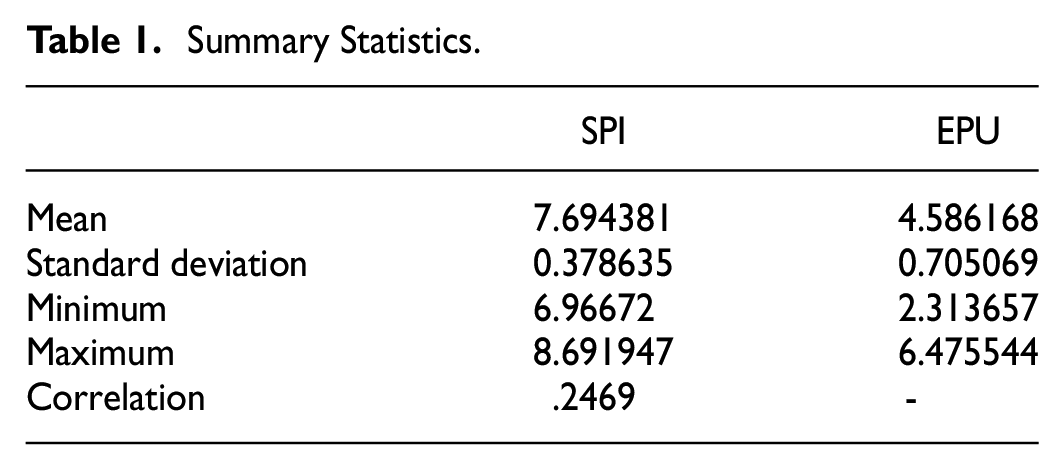
The mean value of the SPI is about 7.943 and its range is between 6.96 and 8.69 and the mean value of oil prices is 4.586 which fluctuates between 2.31 and 6.47. A standard deviation of EPU is more than stock prices, which indicates that EPU relatively more fluctuates than stock prices. The correlation coefficient of stock price and EPU value is 0.2469 with positive sign and statistically significant. This shows that when the EPU rises, PI also increases.
Figure 2 displays a scatter diagram between stock prices (Y) and economic price uncertainty (X), which illustrates that EPU has a positive influence on stock prices. This graphical presentation also validates our correlation results.

Scatter diagram.
Estimation Technique
In this study, a continuous A wavelet transformation is used to illustrate an array of time-series, phase analysis and wavelet coherence are utilized to illustrate the traffic of variables in conjunction with one another within a time-frequency framework. Another method for determining the relationship between the variables is called wavelet causality. In addition, both linear and non-linear chains of causation between variables are investigated during the course of the study. In the subsequent sections, the wavelet approach as well as the nonlinear and linear causality tests will be discussed briefly.
Wavelet is a type of mathematical instrument that can break down data into its many rates of recurrence sections and then look at every section corresponding to the magnitude it has been assigned. It has an advantage over the Fourier approach due to the fact that it has resolutions for both frequency and time, whereas the Fourier method only has resolution for frequency and lacks any time resolution. The “continuous wavelet transformation” (CWT) of a time series

Wavelets can take on a variety of functional forms, such as the Haar, Mexican hat, Morlet, and Daubechies, amongst others. A significant wavelet for the investigation of synchrony concerning time series is the Morlet wavelet, which is one of these functional forms (Goupillaud et al., 1984). This is how it can be written:

where

Now in this function the mass on
Analysis of Phase Difference and Coherency
Between two series the wavelet coherency in time frequency can be stated as
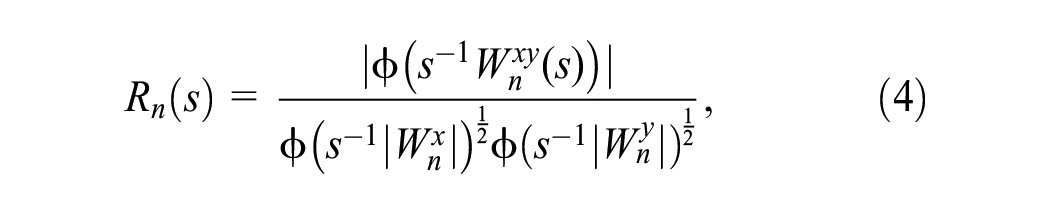
Where smoothed operator at time and scale denoted by

where
Testing Linear Causality and Nonlinear Causality
Testing Linear Causality
Two variables
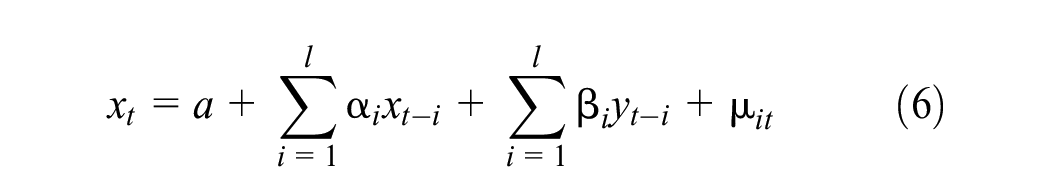

where
Testing Nonlinear Causality
To test the nonlinear causality traditional granger causality test avoids nonlinear causal relationship that exists among time series (Gurgul & Lach, 2009). In addition, the linear causality test examines the association between the two variables only in terms of the mean equation, and not in any other manner, such as the causality in variance, for example Diks and DeGoede (2001). Several different nonparametric tests have been developed in order to investigate the possibility of nonlinear Granger causality. The non-linear causality test developed by Diks and Panchenko (2006), which is a modified version of the nonlinear test developed by Hiemstra and Jones (1994), will be utilized in this investigation. This test is built on the null hypothesis that

where

The null hypothesis can be specified as:

Consider

For bandwidths

where
Wavelet Analysis
A wavelet is a mathematical approach that reads different frequency components according to their respective scales after describing data in a number of different frequency components. It holds an advantage over Fourier approach due to the fact that it has resolutions for both frequency and time, whereas the Fourier method only has resolutions for frequency and does not have any time resolutions. The application of wavelet approaches has been increasingly prominent in the domains of economics and finance, serving as a helpful set of tools for discerning time-frequency relationships (D. Liu et al., 2023). The researchers D. Liu et al. (2023, 2020), Wei et al. (2022) employed Wavelet methodologies in their investigation of stock market prices within the field of literature studies. In the study conducted by Ko and Lee (2015), Wavelet methodologies were employed to examine the relationship between EPU and the financial cycle within the specific context of China.
Wavelet approaches have gained significant popularity due to their inherent advantages in testing theories that have distinct implications over different time scales. Furthermore, in contrast to traditional time-domain techniques, wavelet methods include the capability to simultaneously detect patterns that exhibit variations in both time and frequency. They possess a high degree of suitability in managing nonlinear relationships and nonstationary data. Further elaborations can be found in the work by Aguiar-Conraria and Soares (2014). Wavelet coherence analysis stands out due to its ability to handle non-stationarity, nonlinearity, and time-varying relationships. Its time-frequency decomposition aligns well with the dynamic nature of EPU and its effects on the stock market, making it a powerful tool to uncover nuanced causal associations between EPU and SPI.
CWT (Continuous Wavelet Transformation) Power Spectrum
The relationship of two non-stationary series is determined using the Wavelet method. As a result, performing an analysis without looking at the series’ stationary qualities is possible (Aguiar-Conraria et al., 2008; Boashash, 2015; Crowley & Mayes, 2009). Since the prior section suggests that both variables have a trend, both variables have been detrended by taking the difference in the logarithms. The CWT power spectra of the EPU and SPI are plotted in Figure 3, which essentially depicts the power/variance of the variables. Figure 3 clearly shows that between 2001 and 2012, EPU fluctuates at intervals greater than 32 months (high frequency or long-term), as well as at intervals of 1 to 4 months (low frequency or short term). The CWT results show that due to the stability of the Chinese economy, short-term economic uncertainty has little impact on stock prices. Additionally, fluctuations at high frequency at 32 and above months of scale are shown by the wavelet cross power spectrum (Figure 4). When vortices break up at lower frequencies, the noises stop before the 32-month period. The arrow shows a short and long-term negative association of uncertainty and prices of stocks. The findings that there is long-term fluctuation in the stock market due to economic uncertainty are also supported by the cross-power spectrum.

Continuous wavelet transformation (CWT) graph.

Power spectrum graph.
Coherence and Phase Difference Results
The trends of co-movements between the two series are provided by wavelet coherency. The WTC plot is shown in Figure 5. Co-movements between EPU and SPI have been seen at three different frequency ranges: high frequency, ranging from 1 to 6 months in 2020; medium frequency (medium term), ranging from 8 to 16 months in 2005 to 2008; and low frequency, ranging from 16 to 64 months and above in 1998 to 2010. At low frequency, this relationship is stronger. The variables are said to be in phase (out-of-phase) when arrows are oriented to the right (left). In phase (out-of-phase) indicates a positive (negative) relationship. SPI leads EPU when arrows are pointed to the right and up, while EPU leads to SPI when arrows are oriented to the right and down. Further, EPU leads PI when arrows are oriented to the left and up, while SPI leads EPU when arrows are 3pointed to left and down. In Figure 5, arrows are oriented to the right and down, which implies that EPU is causing stock prices to have a positive sign. This result verifies that EPU increases stock price volatility in China in long run. In the coherence phase graph arrows are oriented left and upward directions which indicates that EPU causes PI both in the short and long term. So there exists a unidirectional causality between EPU and PI.

Coherence and phase difference graph.
Correlation Results
Figure 6 shows the CWT correlation metric from Rua (2013). Figure 6 illustrates SPI and EPU relationship. The graphic demonstrates a positive correlation between variables, which is stronger than the causal relationship. In 2020, the plot shows strong positive co-movements between EPU and SPI from the first to the fourth months. From 2004 to 2014, the same association was seen between 32 and 64 months (low-frequency bands). This beneficial co-movement continues throughout the entire period at a low frequency. It implies that over the long term, EPU increases volatility in PI in China. Therefore, there is a detrimental effect of EPU on PI, and these results are inconsistent with the findings of Arouri and Roubaud (2016).

Correlation Rua (2013) graph.
Linear Causality and Nonlinear Causality Results
We also tested for causality among variables employing together linear causality and nonlinear causality tests in order to authenticate our wavelet analysis findings and to relate them to those of other investigations. While a nonlinear Granger causality test is Diks and Panchenko (2006) causality test, the linear Granger causality test is essentially Granger’s (1969) causality test. By using the structural break unit root tests developed by J. Lee and Strazicich (2003), Perron (1990), and Zivot and Andrews (2002) we first assessed the stationary qualities of the variables before undertaking causality tests. The traditional, “Augmented Dickey-Fuller” (ADF) and “Phillips-Perron” (PP) unit roots tests, have low power when a time series involves structural shifts, hence structural break unit root tests are taken into consideration.
Table 1 presents the summary statistics of the study variables. The outcomes of the unit root tests are shown in Table 2. The outcomes demonstrate that both variables exhibit structural discontinuities and are stationary at their first differences but non-stationary at levels. The outcomes of both the nonlinear as well as linear causality tests are shown in Table 3. At the customary 5% level of significance, both linear and nonlinear causality tests reject the null hypothesis that there is no causal relationship between EPU and the Chinese stock market. It validates the outcomes of researchers Kang and Ratti (2015) indicated that EPU and SPI in China exhibit unidirectional causality. The existence of a one-way causal relationship between EPU and stock prices demonstrates the interdependence of the EPU variable. This relationship demonstrates how the EPU boosts stock prices in China and how any fiscal austerity measures will damage the stock market. Similar to this, long-term uncertainty in China is increased by high market volatility. This finding assists decision in forecasting economic policy and simulating the effect of the stock market on EPU.
Summary Statistics.
Unit Root Tests with Structural Breaks.

Note. Critical value at 5% level of Perron test is −5.23, Zivot-Andrews test is −4.93 and Lee and Strazicich test is −3.569.
Indicates
Linear and Nonlinear Causality Tests.

Results and Discussion
Within a time-frequency framework, this study delves into the impact of EPU on the China SPI. Through the application of monthly data, we utilize wavelet coherence analysis and the phase difference approach to dissect causality and co-movement dynamics among the variables. The wavelet power spectrum analysis unveils pronounced fluctuations at higher frequencies in both series. This observation reinforces the significance of investigating their interactions. The exploration of wavelet coherence reveals varied levels of co-movement between EPU and SPI across multiple frequency ranges. Notably, a more robust relationship is apparent at lower frequency levels, indicating a substantial connection. Supporting the wavelet coherence findings, the phase difference analysis substantiates a positive causative relationship where EPU is driving SPI. Our study further confirms the substantial link between these two influential factors. To bolster the robustness of our analysis and ascertain causality over time, we employ both linear and nonlinear causality tests. Consistently, unidirectional causality emerges as a recurring outcome from these tests, affirming that EPU is a driving force for SPI. This aligns with the conclusions drawn from wavelet causality analysis, where mutual causation is evident at varying frequency levels.
While a corpus of scholarly research underscores the influence of government economic policies on stock market volatility and firm fundamentals (Arouri & Roubaud, 2016; Chen et al., 2017; Drobetz et al., 2018; He & Niu, 2018; Hussain et al., 2020; Jory et al., 2020; Khan et al., 2020; Khojah et al., 2023; Wu et al., 2022), our findings present a nuanced perspective. In line with the limited empirical evidence for example, Arouri and Roubaud (2016) who identified an insignificant impact of EPU on Chinese stocks through time series regression analysis. Importantly, we establish unidirectional causality where EPU is the driving factor behind SPI, while SPI does not reciprocally influence EPU over the long term. EPU plays a significant role as an asset pricing factor, contributing to the elevation of stock risk premiums (Brogaard & Detzel, 2015; Pastor & Veronesi, 2012; Yue et al., 2019) offer a comprehensive equilibrium model that underscores the risk premium component introduced by EPU. In this framework, increasing policy change uncertainties elevate the prospective rate of return volatility and the stochastic discount factor’s volatility. This elevation in risk cascades into the stock market, influencing stock prices (Bekiros et al., 2016; Liao et al., 2021; Phan et al., 2018). Rational Expectations Theory suggests that investors incorporate available information into their decisions. When economic policies are uncertain, investors may anticipate various outcomes and adjust their portfolios accordingly. If investors anticipate favorable policy changes that could benefit businesses or stimulate economic growth, they might drive up stock prices in anticipation of these potential gains.
These findings illuminate the intricacies of EPU’s impact on stock market dynamics and underscore the role of proactive policy management in shaping market behaviors. By delineating the asymmetric causality between EPU and SPI, our study contributes to a deeper understanding of the complex interplay between economic policy and stock prices within the Chinese context.
Conclusion
In an era characterized by EPU’s pervasive influence on financial markets, this study delved into the relationship between EPU and the China SPI. Employing wavelet coherence analysis and a phase difference approach, we unveiled intricate dynamics and causal links between these variables. Our findings reveal a robust correlation and a positive causality from EPU to SPI, highlighting the pivotal role of EPU in driving stock market movements. Moreover, the bidirectional causation between EPU and SPI underscores the intertwined nature of economic policy and stock price behaviors. This study contributes to both theoretical and practical domains. The empirical evidence supports the significance of EPU as a determinant of stock market trends. It underscores the need for proactive policy management, informed investment strategies, and adaptable risk mitigation plans. These insights equip governments, investors, and companies with tools to navigate the complexities of EPU, promoting stable financial environments and informed decision-making. Moving forward, a deeper exploration of the underlying mechanisms and nuanced interactions between economic policies and stock markets could provide further clarity to this intricate relationship. As economic landscapes continue to evolve, understanding and effectively managing the interplay between EPU and stock price dynamics will remain essential for sustaining resilient and thriving financial ecosystems.
The findings of this study have far-reaching implications for various stakeholders, ranging from policymakers and investors to regulators and academics, as they navigate the complex landscape of EPU and its influence on stock market dynamics. First, understanding the bidirectional causality between EPU and the China SPI offers invaluable insights for policymakers. Proactive management of economic policies can shape investor sentiment and drive positive stock market performance. By recognizing that EPU has a causal influence on SPI, policymakers can devise strategies to mitigate negative impacts during periods of uncertainty and harness positive effects in stable economic environments. Second, investors can leverage the insights gained from this study to refine their investment strategies. The positive causal relationship established between EPU and SPI underscores the need to incorporate assessments of policy uncertainty into investment decisions. This understanding can enable investors to better anticipate market movements and position their portfolios more effectively. Third, corporations can benefit from the study’s findings by integrating EPU assessments into their risk management strategies. By recognizing the influence of EPU on stock prices, businesses can proactively adjust their financial plans, investment decisions, and corporate strategies to navigate market volatility effectively. This study emphasizes the importance of aligning business strategies with the broader economic landscape. Fourth, for policymakers engaged in macroeconomic management, the research underscores the significance of crafting transparent and consistent policies. Reducing policy uncertainty could potentially lead to more stable stock market conditions. Moreover, understanding the asymmetric causality can guide policymakers in tailoring responses to market trends while also considering long-term economic stability. Finally, the study contributes to the growing body of research on EPU’s impact on financial markets. Scholars can use these findings as a foundation for further investigations into the nuanced relationships between policy uncertainty and various market indicators. Exploring additional factors that mediate or moderate this relationship could deepen our understanding of its underlying mechanisms.
This study provides valuable insights into the interplay between EPU and the China SPI. However, certain limitations must be acknowledged. First, our analysis is based on monthly data from 2010 to 2020, potentially missing longer-term trends and policy changes. Second, while our wavelet analysis is robust, outcomes could be influenced by the choice of wavelet function and parameters. Interpreting the causal direction requires caution, as unobserved variables could also affect the relationship. External factors like macroeconomic indicators and geopolitical events are excluded from our scope. Additionally, market heterogeneity across sectors is not considered, potentially overlooking sector-specific dynamics. Applying our findings beyond China or the study period should be done judiciously due to specific contexts. Lastly, while we infer causation from EPU to SPI, reverse causality remains plausible, warranting further exploration. In summary, while our study enhances understanding, these limitations emphasize the need for careful interpretation, methodological refinement, and broader contextual consideration in future research.
Future research should aim to address these limitations by utilizing more extensive datasets, refining analytical methodologies, and considering a broader range of influencing factors to provide a more comprehensive understanding of the intricate relationship between EPU and stock market dynamics. Our analysis suggests that EPU influences the stock market, but other unobserved factors such as macroeconomic indicators, international economic events, and geopolitical developments could also play a role in shaping these dynamics. The Chinese stock market is characterized by diverse sectors, each with unique sensitivities to EPU. Our study treats the entire stock market as a homogenous entity, potentially overlooking sector-specific variations in the relationship between EPU and SPI.
Footnotes
Declaration of Conflicting Interests
The author(s) declared no potential conflicts of interest with respect to the research, authorship, and/or publication of this article.
Funding
The author(s) received no financial support for the research, authorship, and/or publication of this article.
Ethical Statement/Informed Consent
The study utilized secondary data that is publicly available for which informed consent is not applicable. The authors declare that this is an original work of authors which has been approved by all authors, and the content of the manuscript has not been published or submitted for publication elsewhere.
Availability of Data and Material
The data used in this study is publicly available and data in brief statement is attached as Supplemental Material.