
Abstract
The objective of this research is to analyze the merger and acquisition potential of managed funds as distinct endeavors and evaluate their overall prospects separately. Initially, the pre-merger performance is evaluated employing data envelopment analysis (DEA) under the variable returns to scale assumption. Merged fund performance is evaluated similarly after augmenting the sample with the merged fund. A fund pair is considered a merger prospect when both demonstrate the potential to enhance DEA-efficiency based rankings. Similarly, prospective acquisition targets are identified, albeit meeting different criteria. Improvement in rankings is categorized as high, medium, or low on an ordinal scale. The overall merger prospect of a given fund is determined by a weighted sum of the number of its prospective merger candidates and the frequency of the fund in question enhance their performance at the high, medium, and low level. Overall prospects serve as indicators of a fund’s potential to merge and acquire within the industry. Studies generally compute efficiency gain focusing on one merger. We propose a novel method to aggregate efficiency gain. This approach is new to the literature. In an investigation of a sample of Australian superannuation funds with 2021 annual cross-sectional data reveals that, on average, industry funds exhibit more merger and acquisition prospects within their own category compared to retail, corporate, and public sector funds. Notably, corporate funds show no such prospects. These findings have important policy implications.
Keywords
Introduction
A significant body of literature examines the measurement of performance gain resulting from mergers and acquisitions. Some studies assess performance retrospectively (ex-post), while others focus on prospective analysis (ex-ante). For example, Charpin and Piechucka (2021) conducted a study on the ex-post performance of the merger of two major transport groups in France in 2011. They utilized the difference-in-differences methodology but found no evidence to suggest any efficiency gain from the merger. Their findings raise questions about the necessity of such mergers and highlight the importance of enforcing horizontal merger policies effectively. Mattsson and Tidanå (2019) investigated whether the merger of Swedish district courts between 2001 and 2009 could be justified from a production economic standpoint. Employing data envelopment analysis (DEA), they observed that while some mergers led to efficiency gains, others did not. Consequently, Mattsson and Tidanå (2019) concluded that assessing potential production economic effects before making merger decisions is crucial. In essence, conducting ex-ante analyses of the potential effects of mergers can assist decision-makers in avoiding costly mistakes.
Data Envelopment Analysis (DEA) is a nonparametric approach that may be used to evaluate the relative performance, termed technical efficiency, of a specific group of homogeneous units. It conceptualizes the functioning of these units as a production process, a fundamental concept in production economics. DEA is preferred as a performance assessment method because it can handle numerous inputs and outputs concurrently during the evaluation process.
Mergers occur for various reasons, as noted by Pinheiro et al. (2017), including economies of scale, economies of scope, increased central control, and risk sharing. When mergers facilitate improvements in one or more of these aspects, they can lead to enhanced efficiency (Mattsson and Tidanå, 2019). Assessing the efficiency gain of a merged entity or a potential merger typically focus on factors such as cost, revenue, profit, and technical efficiency. Some studies use financial ratios. Nevertheless, efficiency improvement remains a fundamental consideration in the exploration of potential mergers. In an early study, Bogetoft and Wang (2005) identify promising merger partners based on efficiency considerations, quantifying potential gains using DEA models. They further analyze potential gains by decomposing them into technical efficiency, returns to scale, and harmony effects. Q. Zhu et al. (2017) and Lozano and Villa (2010) propose DEA-type models to determine optimal merger partners focusing on input cost minimization and post-merger profit maximization. Shi et al. (2017) develop a cost-efficiency model to estimate potential gains from bank mergers. However, potential mergers receive less attention than operation and management of merged entities (Li et al., 2020). This paper contributes to the merger and acquisition literature by offering a perspective that has not been previously explored.
All potential mergers are theoretical propositions, making the selection of merger partners a forward-looking process. Studies that adopt DEA-type models for partner selection, typically consider all possible hypothetical mergers within the observed fund set. This approach can sometimes influence the frontier of best performance established by the observed fund set. However, the frontier remains unchanged when constructed under the constant returns to scale (CRS) assumption (Wanke et al., 2022). However, the CRS assumption may not be appropriate for managed funds. Pastor et al. (2015), in an empirical analysis of active fund management, present compelling evidence of decreasing returns to scale at both the individual fund level and the industry level. This finding is supported by M. Zhu (2018). Additionally, Gray and Watson (2011) argue that consolidation is necessary to reduce the number of funds in the industry and maximize returns to scale. Against this backdrop, our study adopts DEA models for merger and acquisition performance appraisal, assuming that funds operate under variable returns to scale (VRS) technology.
We contribute to the merger and acquisition literature through several methodological advancements. (i) We distinguish between merger and acquisition as separate functions. In mergers, involving both transferring and receiving funds, our argument is that both entities aim to improve post-merger performance. Conversely, in acquisitions, where an acquirer and a target fund are involved, we argue that it is the acquirer who seeks enhanced post-acquisition performance. Based on this rationale, we differentiate between potential mergers and acquisitions and propose two measures: Degree of Overall Prospect for Merger (DOPM) and Degree of Overall Prospect for Acquisition (DOPA). Our approach differs from previous studies in that we assess DOPM and DOPA for each fund considering all potential merger candidates and target funds that meet pre-specified individual rationality conditions. Typically, studies evaluate the performance of a single pairing of merger candidates or acquirer-target combinations. For a given fund, DOPM and DOPA aggregate the performance of all prospective mergers and acquisitions separately. (ii) When evaluating post-merger (acquisition) performance, we refrain from including all possible pairings within the observed fund set. This is crucial under the VRS assumption, as hypothetical pairings might dominate the observed set. To address this, we consider one potential merger or acquisition at a time, thereby mitigating the issue of hypothetical funds overshadowing the frontier. (iii) When determining improvement in post-merger performance with DEA-assessed efficiency scores, we encounter a challenge due to frontier shift. We overcome this obstacle by evaluating improvements in performance-based rankings on an ordinal scale, rather than solely relying on efficiency scores. This approach, to our knowledge, hasn’t been explored in previous merger and acquisition studies. (iv) Traditionally, studies focus on assessing performance gain for individual mergers. In contrast, our measures, DOPM and DOPA, aggregate performance gain across all potential mergers and acquisitions, offering a comprehensive overview of industry prospects. This novel approach represents a methodological advancement in evaluating potential mergers and acquisitions. Overall, these methodological advancements enhance the performance appraisal of potential mergers and acquisitions, providing valuable insights into industry dynamics.
In the empirical investigation, we examine 87 Australian superannuation funds (SFs) categorized into four fund types: retail, industry, corporate, and public sector. Based on cross-sectional data from 2021, our findings indicate that corporate funds show no merger or acquisition prospects. Further, industry funds exhibit greater overall prospects for merging with and acquiring funds of their own type compared to retail, corporate, and public sector funds. On average, industry funds have higher DOPM and DOPA compared to other fund types, aligning with documented merger and acquisition trends in the SF industry.
The remainder of the paper is structured as follows: section “Literature review” reviews literature on merger and acquisition performance appraisal, section “Methodology” outlines the DEA methodology and formulates models for assessing the relative performance of merged and acquired funds, section “Framework for empirical investigation” describes the data and presents the empirical framework for merger and acquisition analysis, section “Results and discussion” discusses the results, and section “Concluding remarks” concludes the paper with final remarks.
Literature Review
Merger and Acquisition Performance Appraisal
Mergers and acquisitions occur for diverse motives, often driven by a desire for consolidation. Such transactions aim to achieve positive outcomes such as enhanced efficiency, economies of scale, and improved management practices. Additionally, mergers can help mitigate the risks associated with operating at smaller scales. Some mergers are undertaken to establish superior business models. A question that arises here is how to select a fund to merge with from a set of funds that have merger potential. Various models are employed to evaluate the potential gains from mergers, each with its own objective. Our focus lies on approaches aimed at assessing gains in technical efficiency. The prevalent method for evaluating efficiency gains in mergers involves the utilization of DEA-type models. A majority of studies employing this approach concentrate on mergers and acquisition within the banking sector.
Members of managed funds anticipate their fund to secure a healthy account balance. Their main concern is returns. Consequently, when conceptualizing the fund management process as a production process for performance evaluation, members’ expectations align more closely with output augmentation rather than input saving or conservation. Under the DEA modeling framework, this expectation corresponds to the concept of output-orientation. Al-Khasawneh et al. (2020) present a similar argument in a bank acquisition analysis. Highlighting that banks have more control over their lending policy than that for accepting deposits, they adopt output-oriented DEA models. Studies evaluating the performance of managed funds using DEA typically employ output-orientation. Further, in the appraisal of merger and acquisition performance, the assumption of CRS is common. CRS assumption simplifies efficiency gain computation. VRS, on the other hand, implies that the productivity of a proportional increase in all inputs of a production process may result in outputs increasing by a larger or smaller proportion than the increase in inputs. This checks with empirical findings in managed fund industry. We adopt output-oriented VRS DEA models.
Another strand in the literature focuses on decomposing the overall potential efficiency gain. For instance, Bogetoft and Wang (2005) break down the overall efficiency gain into three categories: technical, scale, and harmony. Extending this decomposition, Shi et al. (2017) applied it to a production process consisting of two subprocesses. In our conceptualization, we view the management process as a single-stage production process.
When investigating potential gains from mergers, researchers often construct hypothetical mergers by combining two or more funds. The inputs and outputs of the merged fund are then calculated as the sum of the corresponding inputs and outputs of the constituent funds. Under the CRS assumption, the inclusion of one or more hypothetical funds in the observed fund set does not alter the frontier of best performance. However, under the VRS assumption, mergers formed with pooled inputs and outputs of the merging partners may change the frontier. The common approach is to add all possible hypothetical mergers to the observed fund set. See, for example, Halkos and Tzeremes (2013) and Hsu and Ma (2022). When the observed sample is large, hypothetical mergers made up of all possible mergers may dominate the observed fund set. For example, Xie et al. (2020) in an investigation of merger in a set of 134 banks consider 8,911 possible merges. However, in practice, only a fraction of all possible mergers may be realistically considered as merger prospects. In our empirical analysis we consider 87 funds and when a merger is between two funds, the number of possible (hypothetical) mergers are 3,741.
We opt for a different approach. Instead of incorporating all possible mergers together, we introduce one possible merger candidate at a time. In each case, we decide whether a possible merger is a potential merger based on a selection criterion specified on individual rationalization. After selecting potential merger partners from a list of all possible partners, we evaluate performance enhancement in each case through improvements in DEA-efficiency based rankings of both merger partners on a three-tiered ordinal scale. For a given fund, the overall potential to merge is calculated by weighing the number of potential merger partners and the frequency with which the fund in question enhances performance post-merger at each tier. Overall potential to merge offers an industry-specific assessment of the overall merger potential for a given fund, considering all prospective mergers. Traditional studies focus on the performance gain of a single merger. This methodology represents a novel approach that may be used in assessment of merger efficiency gain under VRS assumption. We demonstrate application of the proposed metrics (DOPM and DOPA) using a sample of Australian superannuation funds (SFs). SFs are managed similar to mutual funds and pension funds.
Australian SF Industry
Australian superannuation industry is almost twice the size of Australian stock exchange. The Australian SF industry has assets valued at more than $3 trillion and is ranked in the top 5 in the world. In the past decade, merger and consolidation in the Australian superannuation industry went through different phases. Approximately 18% (8 out of 45) of these merger announcements occurred during the 3-year period 2011 to 2013. The following 3-year period was relatively calm with five merger announcements. The other 32 announcements (71.1%) spread over the 5-year period 2017 to 2021. Recent shift in momentum in superannuation fund (SF) merger may be due to several reasons. The Australian government from time to time implement strong reforms of the superannuation sector. In 2013, Australian government introduced amendments to superannuation legislation to enhance governance and integrity of the superannuation system. From 1 July 2021, funds are subjected to a performance test. The performance test and the superannuation comparative tool provided in the government websites holds funds to account for underperformance through greater transparency. Continued under-performance of funds has consequences. A fund deemed to have failed the performance test over a two consecutive period cannot accept new members. The aim of these reforms is to hold underperformers into account and protect their members interests. To put this issue in perspective, Australian Prudential Regulation Authority (APRA) reports more than 1 million Australian SF members have more than $56 billion invested in underperforming SFs. In the first release of APRA’s performance test, 13 out of 76 (17.1%) fund products analyzed failed in terms of their efficiency, transparency, and accountability. During this short period, eight SF products exited the market. A big problem in SF industry is excessive cost of fees charged by SFs. Australians spend more than $30 billion in super fees every year (Productivity Commission, 2018). Australian federal government estimate that more than $10 billion may be saved over the next 10 years as a result of close scrutiny of SF product performance.
Niblock et al. (2017) in a review of SF performance studies from 2000 to 2014, document that SF managers lack incentive structures compared to mutual fund managers and they make bold assumptions about SF members’ requirements. This, they point out, is partly due to SF members not showing an active interest in their investments. Now, the landscape is changing. SFs also experience increased pressure due to competition within the industry. Sustainability pressure is another type of pressure that SFs have to contend with. As new reforms pressure SFs to lower their fees and boost performance, underperforming SF may have little choice but to merge with another SF for survival. Therefore, it is likely that SF consolidation may continue to rise in the future. It is against this backdrop that we investigate overall prospect for merger and acquisition in the Australian SF industry.
Methodology
DEA-Based Relative Performance Appraisal
In the DEA literature, assessed entities are referred to as decision-making units (DMUs). In our case, a SF is a DMU. Suppose the number of DMUs assessed is n and each DMU transforms
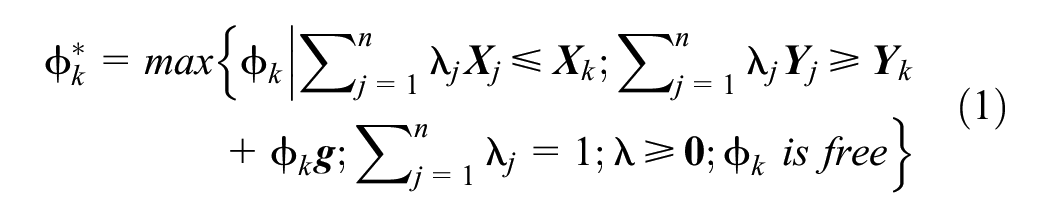
In the empirical analysis we use the vector of observed outputs as directional vector
Development of a Measure of Overall Prospect for Merger
Here we discuss modification of model (1) for merger analysis. Suppose DMU
T
(a transferring fund labeled T) and DMU
R
(a receiving fund labeled R) merge. In this case, T mergers with R creating a hypothetical DMU (in our case a new fund) which we refer to as DMU
TR
hereafter labeled as TR. For simplicity, we assume that the inputs and outputs of TR are

Model (2) is feasible.
When TR is included in the observed DMU set, VRS efficient frontier established with the observed DMU set prior to the merger may shift. Amin et al. (2017) refer to a merger that does not shift the efficient frontier as a minor consolidation and a merger that does alter the frontier as a major consolidation. Some studies, avoid possible changes in the frontier due to mergers by including all possible mergers in the observed DMU set. See, for example Halkos and Tzeremes (2013). This way relative efficiency of each possible merger can be measured with reference to the same frontier.
Our objective is to determine overall prospect to merge and overall prospect to acquire. We do this by considering all prospective mergers from all possible mergers and all prospective acquisitions from all possible acquisitions. Prospective mergers are selected on criteria different from that of prospective acquisition selection. This is the way we differentiate merger from acquisition. Under our modeling framework, gain through a prospective merger and through a prospective acquisition is assessed differently. For a given fund, its DOPM is computed incorporating gains from all prospective mergers and its DOPA is computed incorporating gains from all prospective acquisitions. That involves aggregation of gains.
When assessing merger performance, only the merged DMU (hypothetical) under consideration is included in the observed DMU set. However, in that case, aggregation of relative efficiency gains of all prospective mergers is not prudent. Therefore, we assess merger gain with level of improvement in the ranking (based on pre- and post-merger relative efficiency) measured on an ordinal scale at three levels; low, moderate, and high. The advantage of doing so is that gain in prospective mergers may be aggregated by counting the number of prospective mergers and weighting according to level of improvement in ranking. We do this when computing DOPM and DOPA.
Let
Degree of Overall Prospect for Merger
Assuming other things remain unchanged, we postulate that a pair of transferring and receiving funds may not be willing to merge if their relative performance is bound to suffer. Hence, we ignore all possible mergers when post-merger performance of T or R is worse than its pre-merger performance.
A possible merger of two funds
There are (n − 1) merger possibilities for T. We consider only those that satisfy our selection criteria as prospective mergers. Let

where
As any given T may pair off with any other fund for merger, maximum possible pairings for T is
Development of a Measure of Overall Prospect for Acquisition
Here, we discuss computing overall acquisition prospect. We refer to the two funds involved in a prospective acquisition pairing as an acquirer fund (labeled A hereafter) and a target fund (labeled B hereafter). We label the hypothetical (virtual) fund formed through acquisition of fund B by fund A as AB. In the case of an acquisition, we conceptualize that an acquirer fund absorbs a target fund and after acquisition, the target fund ceases to exist in its own right. We consider acquirer as the dominant partner. This is modeled by imposing the condition that acquirer fund performance assessed in model (1) should be at least as that of the target fund. Hence, for a given fund, an acquisition is possible only with a qualifying target fund. For simplicity we assume

In this case (when the vector of observed outputs is used as directional vector
Degree of Overall Prospect for Acquisition
For hypothetical fund AB to be recognized as a prospective acquirer-target pair, we impose the conditions that acquirer fund performance assessed in model (1) should be at least as that of the target fund and acquirer fund does not suffer in relative performance after the acquisition.
A possible acquisition of B by A is identified as a prospective acquisition when
After acquisition, we assume that the associated target fund cesses to exist and therefore its performance is not considered in DOPA computation. There are (n − 1) parings involving A and therefore the maximum number of acquisitions possible for A is (n − 1). We repeat the above analysis for all pairings of A with qualifying target funds and compute DOPA of

where
Any given fund A may consider any other fund as a target and therefore maximum possible pairings for A is
Framework for Empirical Investigation
Selection of Input-Output Measures
In the development of overall prospect measures, we assume that a merger and an acquisition create a new hypothetical entity. To assess hypothetical entity performance using DEA, we estimate its input-output measures from the input-output measures of the entities that creates it. The common approach is to select input-output measures which are additive. We do the same.
Moreover, the DEA models that we present in section “Methodology” assess performance in the cross-section. In our empirical framework, the cross-section is 1 year. We conceptualize fund management function as a single-stage production process where assets available at the beginning of the year (beginning-year net assets) are managed to earn an income (investment income) and make payments to its members (benefit payments) leaving a healthy asset base at the end of the year (year-end net assets). This process incurs costs. The costs we consider are administration & operating expenses and investment expenses. This is illustrated in Figure 1.

SF management process from asset management perspective.
Data
We obtained annual fund level data from the APRA database; https://www.apra.gov.au/annual-fund-level-superannuation-statistics. APRA data include profile and structure, financial performance, benefit payments, financial position, fees paid, membership profile and demographics at the fund level. The cross-section is the latest year for which APRA provides annual fund level data—2021. To be included in the sample, we require a fund to record non-zero amounts (in Australian dollars—here after $) for all six input-output measures. Table 1 reports summary statistics of input-output measures of 87 SFs that satisfies our selection criteria. The sample comprise of four types of SFs; corporate (8), public sector (10), industry (30), and retail (39). This distribution is typical. In the SF industry, majority of funds belongs to the retail and industry types. The sample includes a mix of small and large SFs. Beginning-year net assets varies between $31 million and $182,378 million with median at $5,138 million.
Summary Statistics of Input-Output Measures.

Results and Discussion
Overall Prospect for Merger
Determination of I1 and I2
First, using model (4), we compute relative efficiency of the transferring fund (T), receiving fund (R), and the hypothetical fund created through a merger of T and R (labeled TR) for each possible merger of T and rank them. Second, we compute the difference in the rankings of TR and T. This way we obtain 3,741 (n(n − 1)/2 where n = 87) differences of which 3,047 are positive. A positive difference implies improvement in performance of T. Figure 2 shows the distribution of improvement in the rankings. The mean improvement in the ranking of T is 16.6554. Chi-square goodness of fit test reveals that there is no evidence to reject the null hypothesis at the 1% level of test that data conforms with a negative exponential distribution with mean 16.6554
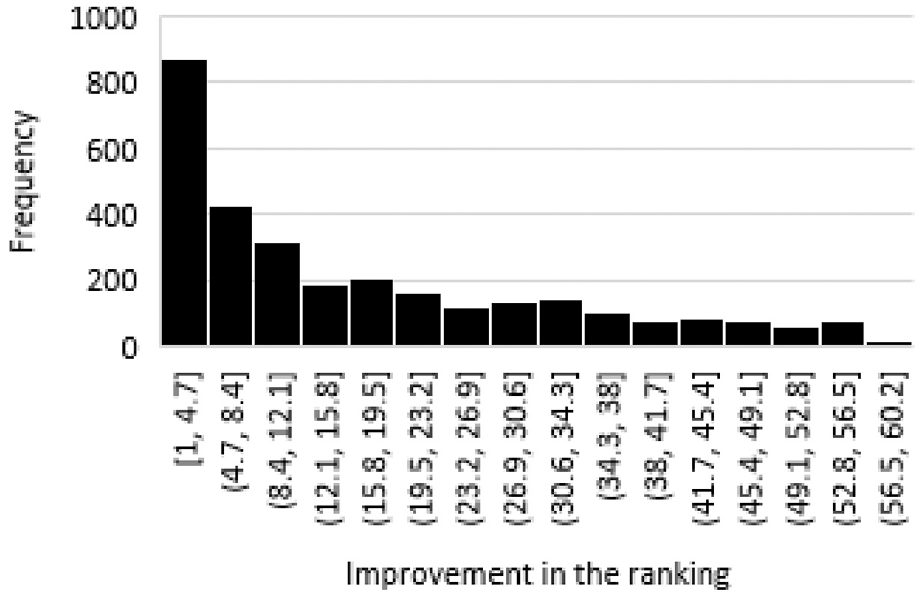
Distribution of improvement in the rankings of transferring funds.
Overall Prospect for Merger Within Industry
To discuss merger prospect at the individual fund level, we select three transferring funds based on the relative efficiency scores computed in model (1). They are; DMU18 (ranked 80) with relative efficiency score 0.7096, DMU83 (ranked 60) with relative efficiency score 0.8234 and DMU14 (ranked 35) with relative efficiency score 0.9509. Best performer is ranked 1. Hereafter, we refer to DMU18, DMU83, and DMU14 as T1, T2, and T3. Table 2 gives their observed input-output values.
Inputs and Outputs of T1, T2, and T3.

Table 3 reports after-merger performance of the three selected transferring funds and Table 4 reports after-merger performance of their receiving funds. Table 3 reveal that T1 has 16 merger opportunities. In 11 out of these 16 merger opportunities, T1 may improve its ranking after the merger by 13 or more placings. T3 has 50 merger opportunities. None of these mergers increase T3 ranking by 13 or more placings. On the other hand, T2 has 33 merger opportunities and in 30 of them T2 increases its ranking after merger by at least 13 placings.
After-Merger Performance of Transferring Funds T1, T2, and T3.

After-Merger Performance of Prospective Receiving Funds of T1, T2, and T3.

Table 4 reveal that large number of receiving funds of T3 improve performance considerably. That is 32 out of the 50 prospective receiving funds increase their rankings by 13 or more placings. Mergers with T1 and T2 do not bring about large improvement in the ranking of their prospective receiving funds. For example, T2 has 33 prospective merger partners. In 28 out of these 33 cases, the receiving fund improves its ranking by five or less placings.
Relative efficiency of a fund reflects how far it lies away from the efficient frontier. When a merger does not result in a significant change in scale of operation, a fund that operates closer to the frontier with a high pre-merger relative efficiency score may increase its relative efficiency by a small margin after the merger. That may bring about improvement in the ranking of that fund by a few placings. On the other hand, a merger may result in a considerable change in scale of operation. A big change in scale of operation may alter the efficient frontier considerably. In such a situation, there is a possibility that merger partners improve their ranking by a large number of placings. Under our modeling framework, number of prospective mergers and the level of improvement in the rankings of merger partners may be influenced by relative efficiency of the merging partners, change in scale of operation after the merger and the effect that a merger has on the efficient frontier established with the observed data set. Generally, high DOPM indicates either the fund has several merger opportunities, few merger opportunities with very high gains or a mix of the two.
Table 5 reports a breakdown of DOPM of T1, T2, and T3. There is clear evidence that contribution of a transferring fund and of its associated receiving funds towards DOPM may vary considerably. For example, relatively high DOPM of T3 is mainly due to post-merger improvement in the rankings of its receiving funds. DOPM of T2 is mainly due to post-merger improvement in its own ranking. Entries in the second and the last column of Table 5 reveal a positive association between DOPM of transferring fund and its relative efficiency. However, association between relative efficiency and DOPM of all transferring funds is positive (correlation coefficient = 0.177) but not statistically significant at the 10% level.
Overall Prospect for Merger of Selected Transferring Funds T1, T2, and T3.

On the other hand, association between relative efficiency and number of merger opportunities of transferring funds is positive with correlation coefficient at 0.410 and statically significant at the 1% level. Further, it is possible that two transferring funds with same number of merger opportunities to have very different degrees of overall prospect for merger. Therefore, DOPM and number of merger opportunities provide supplementary information.
Now we discuss how one may use information on all prospective receiving funds of a given transferring fund using T1 as an example. Table 4 reveal that T1 has 16 merger opportunities. The 16 merger partners (receiving funds) of T satisfy the selection criteria stipulated in section 3.2. Table 6 presents pre- and post-merger improvement in the ranking of T1 and its 16 prospective merger partners. In Table 6 and others to follow, pre-merger efficient funds are denoted by bold labels. We find that, when T1 merges with three of the 16 prospective receiving funds, T1 improves its ranking by 49 positions and become efficient. In other words, T1 has three merger opportunities where after merger may become relative efficient. These three funds (DMU10, DMU59, and DMU69) may serve as a short list of funds for T1 to consider for merger. They are pre-merger efficient. This result may not be generalized. He et al. (2020) in a study of listed companies in China’s coal mining and washing industry, report that most efficient companies are not necessarily the best merger and acquisition prospects.
Prospective Receiving Funds of Transferring Fund T1.

After obtaining a short list of prospective merger partners, T1 may consider other criteria to decide on a preferred merger candidate. T1 management may do this the other way as well. That is to obtain a short-list of funds to merge with in the usual way and check their DOPM for further insights. Consideration may be given to the merging partners’ post-merger performance as well. Columns 4 to 6 of Table 6 report the effect of merger on relative performance of the 16 prospective merger partners. Selecting a fund for merger from among a set of prospective merger partners is beyond the scope of our study. See Färe et al. (2011) for a discussion on how companies may decide on partners to merge with and acquire. Importance of narrowing down to a list of prospective mergers is highlighted in the literature (Saksonova and Kantāne, 2016). A credible list of prospective merger candidates may assist a transferring fund to avoid mergers that may fail to go through. Such failures can be costly.
Overall Prospect for Merger Within Fund-Type
Empirical evidence suggests that mergers in the SF industry takes place predominantly within the same fund type. As funds within the same fund-type compete and operate under the same market segment, mergers within the same fund-type may be viewed as horizontal mergers. In this sub-section, we investigate DOPM of SFs within its own fund type. Table 7 reports the results by four fund types. The results reveal that none of the eight corporate funds have merger prospect with funds of its own type. This is consistent with Cummings (2016) finding that smaller corporate funds tend to consolidate with larger industry funds and retail master trusts. Two corporate funds are efficient. Here, we highlight that performance of a hypothetically created merger with an efficient and an inefficient fund or two efficient funds may not necessarily satisfy the conditions required for acceptance as a prospective merger. On the other hand, all public sector funds have merger prospect with funds of their own type. Our sample comprise of 10 public sector funds and that limits the number of merger possibilities. For example, number of prospective mergers of three public sector funds is 1. All retail and industry funds also have merger possibilities within their own type. Degree of prospect for merger and the number of prospective mergers of these funds vary considerably. There are 39 retail funds and 30 industry funds. Therefore, some retail and industry funds have high number of merger possibilities. For example, 20 out of 39 (51.3%) retail funds and 13 out of 30 (43.3%) industry funds have at least 10 merger opportunities.
Overall Prospect for Merger Within the Fund Type.

The SF with the highest DOPM (0.537) is DMU69 which is a public sector fund. It is much higher than the second-best public-sector fund (DMU14) with DOPM at 0.296. Without DMU69 the average DOPM of public sector funds is 0.125. This average is less than industry fund average which is 0.143. When DMU69 is treated as an extreme observation and ignored, industry funds record a higher average DOPM than other fund types. This is an indication that generally, opportunity for merger within industry funds may be more than in other fund types. Industry funds have been the clear leader in mergers over the past decade (KPMG, 2021). Corporate funds have no merger prospect at all. Such information is useful for policy implementation.
DOPM is not a predictive measure. DOPM simply indicates overall prospect that a given SF may have for merger within the SF industry or within its fund type when the characteristics of interest is efficiency. For example, in 2022, two funds in our sample merged. They are QSuper (DMU69) and Sunsuper (DMU78). We find that QSuper (public fund) and Sunsuper (industry fund) merger results in a major consolidation. QSuper and Sunsuper merger is now known as Australian Retirement Trust. This is the largest merger in Australian history. Both these funds are DEA-efficient prior to merger.
Overall Prospect for Acquisition
As outlined in section 3.3, we compute DOPA considering improvement in the ranking only of the acquiring fund. In our sample, we find a total of 3,003 prospective acquisitions. The distribution of improvement in the ranking of these acquiring funds is negative exponential with mean 17.0500
Overall Prospect for Acquisition Within Industry
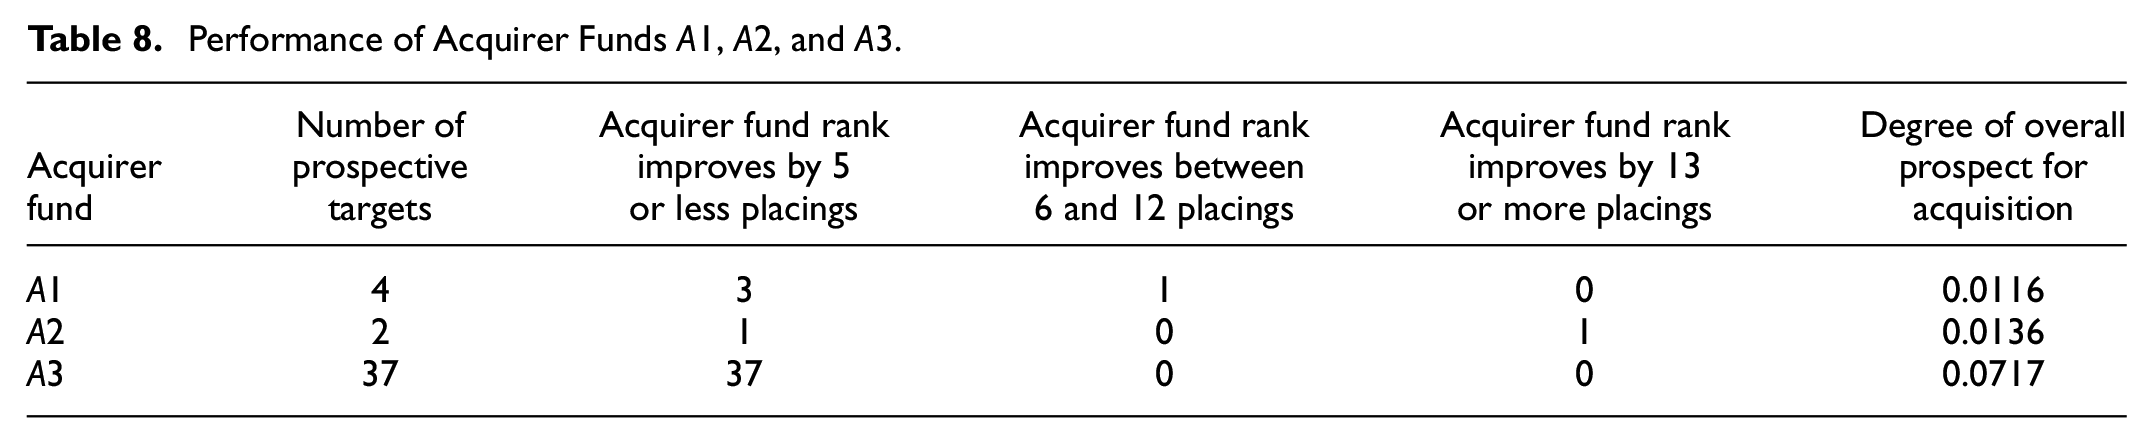
To discuss prospect for acquisition to some detail, we select the three funds (DMU 18, DMU83, and DMU 14) that we selected to discuss overall prospect for merger at the individual fund level. Now they are acquirer funds and hence we label them as A1, A2, and A3. To determine DOPA of a fund, first we compute relative efficiency of the acquirer fund and the acquirer-target pairing using model (4) for each possible acquirer-target pairing. Thereafter, we select all acquirer-target pairings that satisfy the conditions required to qualify as a prospective acquisition. DOPA of A1, A2, and A3 are computed using (5) with all qualified acquirer-target pairings. Table 8 shows the results. Second column of Table 8 gives the number of prospective acquisitions. Relative efficiency of A2 is higher than the relative efficiency of 26 funds. However only 2 of them qualify as prospective targets. This means, when A2 acquires any one of the other 24 funds out of the 26, its relative efficiency gets affected adversely. This may be because ranking is done after adding the formed acquisition and assessing its performance with respect to the DEA frontier with VRS technology. On the other hand, relative efficiency of A3 is higher than the relative efficiency of 52 funds. Thirty-seven of them qualify as prospective targets. Overall, association between DOPA and relative efficiency of acquirer funds is strong with correlation at 0.496 (statistically significant at the 1% level).
Performance of Acquirer Funds A1, A2, and A3.
A1 has four prospective targets. Table 9 presents their characteristics. For acquirer fund A1, the target fund that would improve its ranking the most is DMU34. The next best fund to acquire in terms of improvement in the ranking of A1 is DMU28. Third column of Table 9 reveal that relative efficiency of A1 computed in model (4) remains the same in all four acquisitions. This may happen when addition of any one of the hypothetical acquirer-target funds to the observed fund set does not alter the frontier to which the acquirer fund is projected for efficiency.
Target Funds of Acquirer Fund A1.

Overall Prospect for Acquisition Within Fund-Type
Table 10 reports DOPA of funds when acquisition is allowed only within their own fund type. In section 5.2.2 we reveal that corporate funds have no prospect for merger within their fund type. Here too we find that corporate funds have no opportunity to acquire funds of their own type with the exception of DMU25 with just one opportunity. In the case of public sector funds, one fund stands out from the rest in terms of number of acquisition opportunities. That is DMU69 with 9 prospective acquisitions. The second highest number of prospective acquisitions in the public sector type is for DMU14 with 4 opportunities. Seven out of the 10 public sector funds have no opportunity to acquire funds of their own type. In contrast, all 10 public sector funds have merger opportunities. See, Table 7.
Overall Prospect for Acquisition Within the Fund Type.

Five out of the 30 (16.7%) industry funds have no prospect for acquisition within their own type. Eight industry funds however have 10 or more acquisition opportunities. In the case of retail funds, approximately 20% have no prospect for acquisition and 15 have more than 10 acquisition opportunities. Overall, during the investigation period (with 2021 annual cross-sectional data) we find that corporate funds have no prospect of acquiring funds of their own type.
Correlation between DOPA and number of prospective acquisitions of funds within retail, industry and public sector types exceeds 0.9. However, there are exceptions. For example, DOPA of industry funds DMU61 and DMU85 have the same number of acquisition possibilities (7), however, their DOPA differ considerably. Therefore, when evaluating acquisition prospect of a fund within their own type, it is better to consider DOPA and the corresponding number of acquisition possibilities.
Concluding Remarks
This paper introduces new measures to assess degree of overall prospect to merge and overall prospect to acquire based on pre- and post-merger/acquisition performance assessed using data envelopment analysis. We label them as DOPM and DOPA. Degree of overall prospect is computed by aggregating gain in all prospective mergers and acquisitions. We determine merger gain and acquisition gain on improvement in performance-based rankings measured on an ordinal scale at three levels of improvement (low, moderate, and high) instead of gain in relative efficiency. Assessment of gain on an ordinal scale may reduce scale effect of merger and acquisition gain. Under our modeling framework, DOPM (DOPA) may not reflect number of prospective mergers (acquisitions). Therefore, DOPM/DOPA and number of prospective mergers/acquisitions provide information from two different standpoints. Hence, overall potential for merger and overall potential for acquisition help funds make informed decisions in fund selection and provide valuable insights to achieve long-term success in the industry. Policy makers will also benefit. Overall potential of individual funds to merge/acquire within the fund type allows policy makers to gauge the potential impact of mergers on investors. Mergers/acquisitions could result in increased fees, reduced investment options, or conflicts of interest that in turn could harm investors. When overall potential is known ahead of time, policy makers can protect investors through early intervention such as timely introduction of legislation.
We apply proposed measures to investigate prospect for merger and acquisition in the Australian superannuation industry. With annual cross-sectional data as at 2021 in a sample of 87 superannuation funds (SFs), we find that DOPM/DOPA and number of prospective mergers/acquisitions of individual SFs vary considerably. In the analysis by fund type, we find that industry funds on average have more prospect for merger and acquisition than other fund types.
A multi-period cross-sectional analysis of DOPM and DOPA of individual funds may reveal effects of legislative changes in the industry and change in market conditions on merger and acquisition. Our method can be used to assess DOPM and DOPA of firms in other industries as well.
Footnotes
Declaration of Conflicting Interests
The author(s) declared no potential conflicts of interest with respect to the research, authorship, and/or publication of this article.
Funding
The author(s) received no financial support for the research, authorship, and/or publication of this article.
Data Availability Statement
The data supporting the findings of this study are available upon request from the corresponding author.