
Abstract
This study investigates the predictive power of sentiment metrics concerning the volatility of tourism-related stocks listed on the Pakistan Stock Exchange (PSX) during recent crises. We employed univariate and multivariate GARCH-family econometric models to analyze daily data collected from March 2020 to April 2023. The data is categorized into two periods: A (COVID-19 until February 2022) and B (the vote of no-confidence motion until April 2023). The findings indicate that Market Sentiment (MS) plays a more significant role than individual sentiment in predicting stock price volatility and negatively impacts return volatility. During period A, the Fear Index (FI) and in B, economic policy uncertainty (EPU) were identified as factors contributing to increased fluctuation in tourism-related stocks. Additionally, MS exhibited a heightened level of bearishness compared to the COVID-19 era. The multivariate BEKK-GARCH analysis revealed that MS past volatility negatively spillover onto the current conditional volatility of PSX firms. This highlights the paramount importance of MS in understanding stock price fluctuations in the PSX. Interestingly, the technology sector exhibited lower sensitivity across the analysis. This study provides valuable insights for decision-makers by elucidating the principles of behavioral finance theory within the context of the PSX. They should prioritize long-term strategies to institutionalize investors, enhance their emotional intelligence, and mitigate psychological biases in the market.
Introduction
The value of information has notably surged as a crucial asset amid recent global health crises in the financial market. Fama’s (1970) efficient market hypothesis (EMH) postulates that available market information is reflected in asset prices. On the contrary, the noteworthy work of De Long et al. (1990) contradicts (EMH), and affirms the behavioral finance theory, suggesting that noise players create bubbles that deviate from the stock price’s intrinsic value. Baker et al. (2012) examined the multifaceted determinants of stock prices, noting an investor’s interest in a bullish market as opposed to bearish periods. This contrast underscores the critical influence of investor sentiment in the dynamic of stock trading. Investor sentiment is typically used to assess investor cognitive bias, which is considered an erroneous perception of asset value (Zhou, 2018). However, a growing body of literature examined the impact of investor sentiment on the cross-section of stock prices, see for example (Beer & Zouaoui, 2013; Gong et al., 2022; ur Rehman, 2021). Several studies have utilized Principal components analysis (PCA) to formulate proxies reflecting investor sentiment in financial markets (Baker & Wurgler, 2007; D. Lei, 2019; Song et al., 2023). Abdelhedi and Boujelbène-Abbes (2019) used PCA to measure investor sentiment and the BEKK-GARCH model to capture volatility, demonstrating significant spillover to stock price fluctuation. On the other hand, several studies have focused on the exploration of news-based investor sentiment (Narayan & Bannigidadmath, 2017; Puzanova & Eratalay, 2021; Srinivas et al., 2023). This phenomenon has attracted significant interest across various disciplines. However, the tourism industry has received limited emphasis on psychological variables, encompassing investor sentiment, market fear, and even their potential impact on economic characteristics, such as the stock market return volatility and trading behavior (Khalid et al., 2021; Su et al., 2017). Few studies have specifically focused on examining the impact of investor sentiment on the volatility of tourism stock returns (Hu et al., 2021; K.-L. Peng et al., 2023). Zargar and Kumar (2023) explored the interplay between investor sentiment and the UK, US, EU, and Italy tourism sectors, revealing that amid COVID-19, the U.S. tourism returns were more sensitive than other to investor sentiment (Sorić, 2021; B. Wu et al., 2021).
Many studies focused on aggregate stock market to address the investor sentiment effect on emerging market Pakistan (W. Ahmed, 2018; M. A. Khan & Ahmad, 2018). ur Rehman (2021) conducted firm base analysis in Pakistan and developed both PCA and news sentiment; the findings affirm behavioral finance theory, showing irrational investor sentiment impacts stock market activities. Additionally, Parveen et al. (2023) examined in their study that the COVID-19 pandemic negatively affected the PSX investors’ behavior. To the best of the author’s knowledge and peer review, insufficient literature has been observed on the nexus between investor sentiment and tourism stock return volatility. This study pivots on this gap, specifically delving into Pakistan’s emerging market. Globally, the tourism industry contributed US$ 10 billion to the world GDP in 2019; it declined by −34.3% in 2020 due to the pandemic; compared to 2021, it rebounded with a 111% increase, equal to US$ 7.5 in 2022. The industry is expected to reach $9.5 billion in 2023 and is projected to contribute US$15.5 billion to global GDP by 2033 (Statista 14-12-2023). Similarly, in Pakistan, as per (TTCR, accessed 08-07-2023) Travel and Tourism Competitive Index 2017, tourism contributed US$ 328.3 million in 2015, representing 2.3% of the nation’s GDP. Furthermore, Hasni et al. (2021) reported in their study in 2019 that the tourism industry contributed 7.8% to the GDP, generated 1.5 million jobs, constituting 2.4% of total employment, and improved its global rank to 121out of 124 Pakistan, a three-point rise from 2017. In their recent study N. U. Khan et al. (2022) the tourism revenue plummeted by 22.9% amid the pandemic. The projection indicates a U-shape recovery, with an expected US$3,008.00 million in 2023, within the anticipated 6.14% annual growth, surpassing US$ 3817.00 million by 2027.
The tourism sector has the potential to considerably enhance financial growth and catalyze the overall economic development in Pakistan. This study seeks to investigate the precise research question,” To what extent do investor sentiment and economic policy uncertainty impact the tourism-related stocks return volatility? It makes noteworthy contributions toward accomplishing specific objectives, offering novel perspectives and insight to enrich the existing scholarly discourse. Firstly, prior studies mainly focused on the tourism industry from a qualitative perspective (N. Ali, 2013; Y. Ali et al., 2018; Nazir et al., 2023). This study enhances the quantitative perspective to engage investors in PSX strategies. Secondly, the time spans from March 2020 to April 2023, and encapsulates the pivotal events of this century, including the global health crises, the COVID-19 pandemic, and internal turmoil, like the vote of no-confidence filed by the (PDM) Pakistan democratic movement against former prime minister Imran khan. This event marked the inception of a subsequent crisis era in Pakistan’s current landscape. Thirdly, S. K. Khan and Saleem (2022) incorporated market proxies and employed PCA, while Naeem et al. (2021) utilized a Machine learning approach for data scraping. Therefore, we employed both methods to present a clear picture and adopted the (ML) approach within the Python environment, specifically the (Jupiter notebook), to facilitate data scraping from URL’s and construct individual investor sentiment indexes. Additionally, the well-known PCA (Principal Component Analysis) technique for market-based proxies to extract the market sentiment index. Fourthly, the COVID-19 pandemic and the vote of no confidence motion in 2022 drastically affected the Pakistani economy (Iqbal et al., 2023). The GDP fell fromUS$314 billion in 2018 to US 290 in 2022, amid COVID-19 and the vote-of-no-confidence motion, the external debt increased from $60 to $130 billion in 2022, and the currency lost 300% of its value against the US dollar, the central bank interest rate an all-time high 21% in April 2023 (S. U. Rahman & Jan, 2023). Therefore, this study follows Salisu and Akanni (2020) and develops a fear index for the COVID-19 era, and subsequently uses EPU as a proxy for internal crises to investigate their impact on tourism-related stock return volatility. Lastly, the STATA was employed for MS (market sentiment) and univariate analysis, and then the R programming language was used for further analysis, like the urca package for data stationarity. Then, the renowned BEKK-GARCH approach has been employed, demonstrating superior efficacy over the MTS package in capturing variance-covariance in complex settings (CRAN.R, Accessed July 15, 2023).
The subsequent section unfolds as follows. Section “Literature Review” consists of a literature review Section “Methodology” pertains to data collection and selection of statistical approaches. Section “Empirical Results” presents empirical results and discussion. Lastly, Section “Conclusion” reports the study conclusion and underscores policy implications.
Literature Review
Global connectivity is a double-edged sword it is advantageous, but it has recently unleashed unprecedented severe sparks, like COVID-19, a once-in-a-century calamity, swiftly ravaging global financial markets; it eclipsed the 2008 GFC global financial crisis. This event led to a $2 trillion loss in the global economy by early 2020, with several countries grappling with economic growth below 2.5% (Mishra, 2020). According to Bagchi et al. (2020), during COVID-19, the top ten companies listed on the S&P experienced a significant $1.4 trillion loss attributed to investor fear. Further, amid the COVID-19 pandemic, the International Air Transportation Association (IATA) reported a staggering $113 billion loss, heavily affected by stringent travel restrictions (IATA, Accessed December 15, 2023) Airlines (2020). A country like Pakistan has faced prolonged continuous, financial, natural, political, and terror turmoil for decades (Parveen et al., 2020). Arshad et al. (2018) forecasted Pakistan’s tourism industry to grow by $38.9 billion in a decade and ranked Pakistan 124th out of 136 in 2018. Mystery pneumonia COVID-19 impacted (PSX) causing a 10% index below 35,000 points, losses amounting to $610 million, tempting investor uncertainty (Aslam et al., 2020). Political crises induce uncertainty, posing a threat to the financial system. One grand issue practised for centuries, named the no-confidence vote, was filed for the first time against the British prime minister in 1782 (Mason, 2022). In the subcontinent, Bangladesh prohibited the no-confidence motion; conversely, in India, Prime Minister Vajpayee faced defeat in April 1999 by a narrow margin of one vote (269–270) (Hindustan Times. (2024) Accessed 2023-11-10). Since the 1980s, Pakistan has experienced three key votes of no-confidence: Benazir Bhutto in 1989, Shaukat Aziz in 2006, and recent vote of the no-confidence motion in 2022. Each of these instances has impacted its economy significantly (Ghani et al., 2022; Iqbal et al., 2023). In their recent study, Hussain Mirza and Kumar (2023) reported that the post-April 10 no-confidence motion contracted the GDP from 5% to 1%, with the currency depreciating by over 40% in a few weeks. This reflected and severely impacted emotional intelligence.
Investor Sentiment in the Tourism Market
An array of scholarly inquiries have analyzed investor sentiment impact on the tourism industry (Corbet et al., 2022; Dragouni et al., 2016; Huang et al., 2014). In their recent empirical study, Zargar and Kumar (2023), the US tourism sector’s returns amid COVID-19, exhibit that market fear, investor sentiment, and economic policy uncertainty are net volatility transmitters and the tourism sector predominantly is the net receiver. During the COVID-19 outbreak ML base analysis was piloted, uncovering a heterogeneous impact of tweeter-base economic policy uncertainty on the tourism sector (Shiljas et al., 2022). In the same vein, Rudež (2022) investigated twelve tourism-related stocks and observed that amid the COVID-19 pandemic, investor sentiment responded rationally, leading to the swift rebound of several stocks to their intrinsic value.
Investor Sentiment Across Industries
In behavioral finance, investor sentiment is identified as a key determinant that significantly affects industry-specific return volatility (Chen et al., 2013; Dash & Mahakud, 2013; Niu et al., 2021). According to Hong et al. (2020), amid COVID-19, a stronger asymmetric and herding effect has been observed in the manufacturing and IT sectors. Few researchers focus on the COVID-19 pandemic, it has been proven that behavioral finance theory has a diverse impact on tourism-related sectors (Olugbode et al., 2014; K.-L. Peng et al., 2023; Sorić, 2021). Yuan (2021) found that Intensified herding behavior exerts a strong influence on transportation, leasing, business service, and culture products, however, observed varied both short and long-term effects of investor sentiment excluding real estate. In the same line, Cui and Zhang (2020) conducted a firm-based analysis and concluded that managers’ overconfidence is more crash-prone. Recently Rohilla et al. (2023) examined the effect of investor sentiment on four S&P industries, finding a robust correlation with these industries in both short-term and long-term contexts. Furthermore, using the VAR-GARCH model on the aviation industry, the immense negative impact of investor mood was observed (Kaplanski & Levy, 2010). Zheng (2021) it is imperative to contemplate tourists’ psychological attitudes when implementing remedial actions or resilience policies.
Investor Sentiment and Stock Return
A widely recognized technique PCA (principal component analysis) employed on market proxies to establish an investor sentiment, aimed at forecasting stock returns (Baker & Wurgler, 2006; Baker et al., 2012; Y. Li & Ran, 2020; M. L. Rahman & Shamsuddin, 2019; Song et al., 2023). Recently K.-L. Peng et al. (2023) employed four market proxies: CCI (consumer confidence index), NOP (newly opened accounts), TR(turnover ratio), and P/E (price to earnings ratio); their findings unveiled high sensitivity of tourism-related stocks to investors mood in the Chinese stock market. Several researchers utilized a machine learning approach (Das et al., 2019; Herrera et al., 2022; Hu et al., 2021; Kim et al., 2020; Nti et al., 2020; H. Peng et al., 2018; Renault, 2020; Vijh et al., 2020). P. Wang et al. (2021) utilized Python to crawl data from Weibo; unveiling that amidst COVID-19, investor sentiment turned pessimistic toward the stock market. Scholarly research primarily presents a consensus on the existence of positive correlation (Ainin et al., 2020; Baker & Wurgler, 2006; Baker et al., 2012; Hsu & Tang, 2022; W. Y. Lee et al., 2002; Lux, 2011). Conversely, numerous studies have noted a slumping effect (Nicolaus et al., 2020; W. Wu et al., 2021; Shahzad & Caporin, 2020). various findings manifested range from mix to no existence association (Jansen & Nahuis, 2003; Kling & Gao, 2008; Rudež, 2022; Sigala, 2020). The multivariate GARCH base analysis demonstrates that investor sentiment significantly predicts volatility in the Mexican stock market returns (Liston-Perez et al., 2018). Narayan et al. (2021) investigated the G7 economies and concluded that government financial grant policies positively influence investor sentiment and stock market returns. Higher uncertainty exacerbates volatility, and stocks remain unpredictable (Nartea et al. (2020) concluded that EPU (Economic Policy Uncertainty) in conjunction with varying levels of investor emotions, indicates EPU trading strategy during low sentiment is more profitable. Further, the US-centric research (1995-2015) posited investor sentiment and EPU as driving factors for US sectoral returns (Rehman et al., 2021). López-Cabarcos et al. (2021) S&P 500, Kumari and Mahakud (2015) Indian stock market, applied univariate GARCH model, further Johnk and Soydemir (2015) US equity market, (Guerello, 2016) US stock market, Zeng (2020) for China applied multivariate GARCH model and concluded that investor sentiment is a robust predictor for stock return volatility. Ghorbel et al. (2014) and Trichilli et al. (2018) employed multivariate BEKK-GARCH technique, revealing that investor sentiment legged volatility significantly spillover to Islamic indices return volatility.
Hence, stock price fluctuations are contingent upon the level of investor confidence. During episodes of overconfidence, frequent trading introduces market noise, deviating stocks from their intrinsic path (Barber & Odean, 1999; Flynn, 2003; Rashid et al., 2019). Therefore, this article puts forth three hypotheses to test the behavioral finance theory of Blackledge and Lamphiere (2021) and K.-L. Peng et al. (2023) examine the sentiment index’s influence on the Pakistan tourism-related stocks market.
Hypothesis 1: Investor sentiment significantly influences the volatility of tourism-centric firms.
Hypothesis 2: COVID-19 has markedly escalated stock price fluctuation in tourism-related stocks.
Hypothesis 3: Economic policy uncertainty provokes a heterogeneous effect on stock price volatility across sectors.
Methodology
The sample is based on K.-L. Peng et al. (2023) and Geng et al. (2021) took thirty tourism-related stocks from five sectors listed on PSX (Pakistan stock exchange). Collected daily closing prices for firm stocks from Business Recorder and daily figures for fear index proxies; Table 1 presents data along with data sources. Meanwhile, market sentiment proxies were gathered on a monthly basis except for EPU and then converted to daily frequency using eviews-12 to facilitate more precise regression analysis. The textual sentiment detail is illustrated later in this section. The time period spanning from March 2020 to April 2023, bifurcated into two distinct phases; period A, marking the COVID-19 outbreak, initiated with the WHO pandemic declaration, and B, from March 2022 is, encapsulating the political turbulence of the vote of no-confidence motion in Pakistan, with a focus on its repercussions on the volatility in the tourism-related sectors. The goal is to examine how investors’ psychological responses to the stock market fluctuation across these two tumultuous periods. Further, the sentiment detail is delineated later in this section.
Variables and Data Source.

Note. PSX = Pakistan Stock Exchange; CDC = Central Depository Company; SBP = State Bank of Pakistan.
Data Normality Test
An outlier refers to an observation that deviates from the normal state, and necessitates appropriate treatment as it can influence the process of hypothesis testing (K. Lee et al., 2022). This study detected outliers in many stocks and applied normality tests to natural Log returns using statistical tools (Shapiro-Wilk, Konglomorov-Smirnov) and graphical tools (Histogram, Boxplot, QQ plot). Due to missing values, we set an average period-A, A, 550, and B, having 300 observations, if a variable exceeds the approximate limit, has trimmed; otherwise, it is winsorized. The results are not included in the study brief and are available upon request (Afzal et al., 2021; Bieri, 2020; Ehsan, 2021; Ejsmont et al., 2023).
PCA Index Development
This study formulated three indices using a variety of proxies. The market sentiment inspired by Baker et al. (2012) and K.-L. Peng et al. (2023), incorporates metrics such as TR (Turnover Ratio), CCI (Consumer Confidence Index), NOA (Newly Opened Accounts) and P/E (Price To Earnings Ratio). Secondly, the fear index Following Subramaniam and Chakraborty (2021) integrated data on COVID-19 new and total cases, as well as COVID-19 deaths and total death cases. Lastly the textual sentiment index, based on W. Zhang et al. (2021) and ur Rehman (2021), by scrapping data from two URL’s, as detailed in Table 1. Similarly, Tables A1 and A2 show the descriptive statistics and data stationarity, and the ARCH effect test for all variables.
The following are the raw sentiments of the first component after the rotation matrix


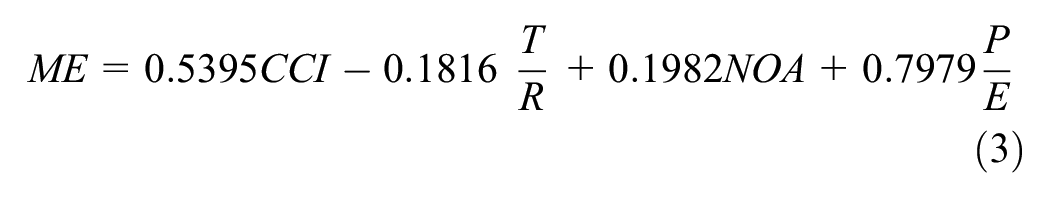
Figure 1 demonstrates the correlation among proxy variables; the intensity of color and the legend on the right side explains the relationship. The dark blue presents a high correlation, and the light blue has a partial positive correlation among proxies. Furthermore, the red-shaded area spectacle negativity, but the dark red stands for high negativity, the light red otherwise. Table 2 specifies the KMO and barrelet sphericity test results, indicating that the variables are not orthogonal, providing concrete evidence for PCA fitness (Shrestha, 2021). The components above eigenvalue are considered for final sentiment index. Figure 2, exhibits cumulative data variation for Market Sentiment 81%, Individual or textual Sentiment 68%, and Fear Index or COVID-19 sentiment 75%, all these values are more significant than famous Baker and Wurgler (2007) and Kurbatskii and Mironenkov (2023) 53%.

Correlation among proxy variables.
KMO Test and Bartlett’s Test for PCA.
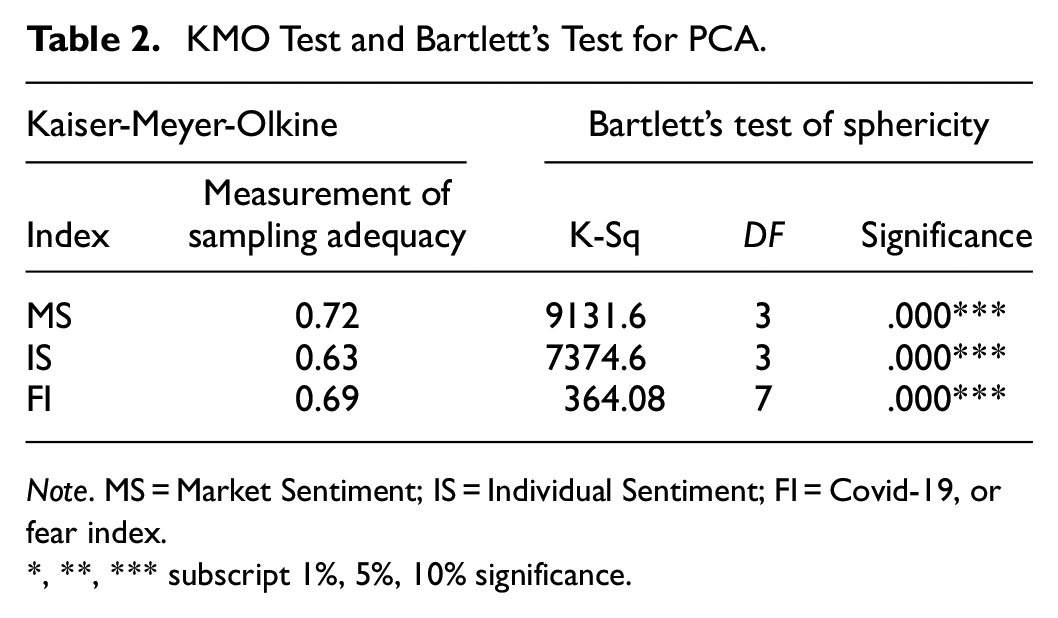
Note. MS = Market Sentiment; IS = Individual Sentiment; FI = Covid-19, or fear index.
*, **, *** subscript 1%, 5%, 10% significance.

The scree plot for ME (market emotions), IS (individual sentiment), FI (Fear index).
Individual Sentiment (IS) Construction
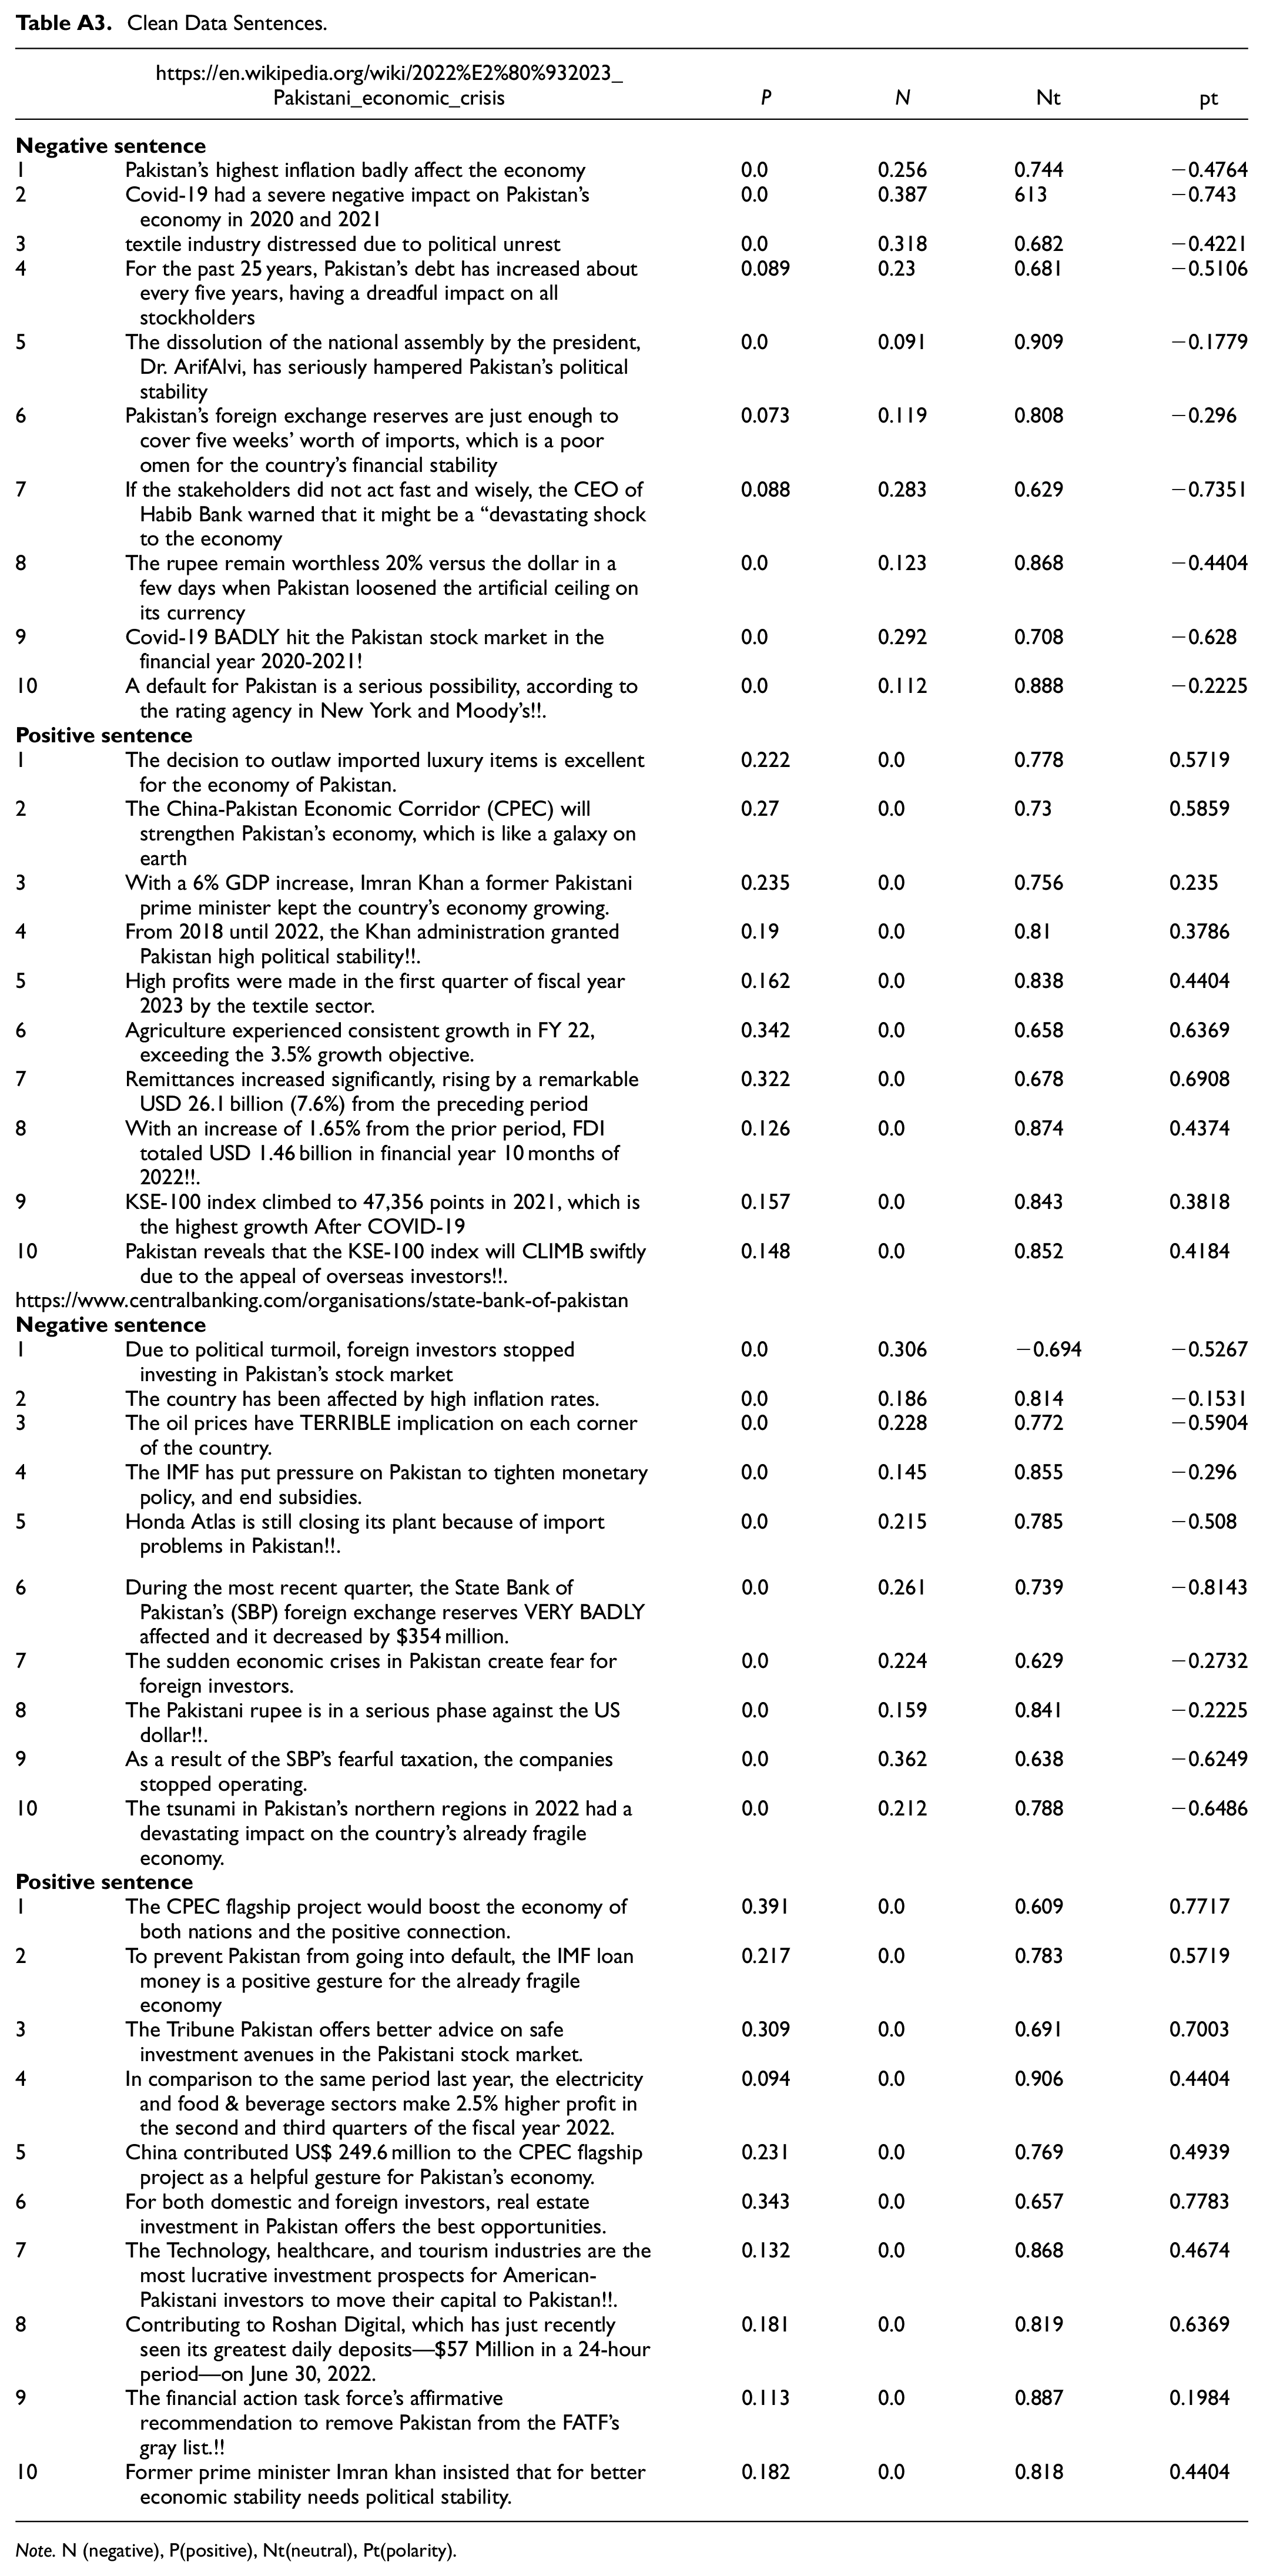
VADER (Valance Aware Dictionary and Sentiment Reasoner) lexicon does not need to train data; it takes human-labeled data (Hutto & Gilbert, 2014). This article followed Rehman (2021) who scraped Bloomberg News to develop textual sentiment for Pakistan, and we extended their technique and scraped data from URL’s mentioned in Table 1. The Python Jupiter notebook used and called the NLTK (Natural Language Tool Kit) library from NLP (Natural Language Toolkit) processing tool and practiced these steps (a) Scrape Data (b) Initial Screening Text (c) Sentence Tokenization (d) Remove Stop Words (e) Word Frequency (f) SIA(Sentiment Intensity Analyzer), the SIA can read the exclamation and word capitalization for the intensity (g) word-cloud visualization shown in Figure 3, (the supporting document available in Appendix Table A3). We extracted the top 50″ common words by employing the word frequency function and then took the relevant ten negatives and positives from each set. Match them with clean data for microblog selection. Applied the SIA function to each sentence and divided it into positive, negative, neutral, and polarity, then applied the following equation.


Where

Show the word-cloud of SBP and financial crises 2022–23.
Econometric Specification
This study follows Murty et al. (2022), and employs both uni-multi-variate GARCH models to examine the influence of investor sentiment on returns volatility. The AR and MA models have the drawback of capturing time-varying clusters (Pilbeam & Langeland, 2015). The univariate GARCH family effectively captures the pattern in financial time-series where the small shock is followed by the small, and the large shock is followed by the large (Katsiampa, 2017). Furthermore, according to Yu et al. (2020) VAR can inspect dynamic relationships but falls short in capturing the non-linear complexities inherent in a dynamic time-series. Although copula models address these limitations, including asymmetries, they are subject to drawbacks concerning spillover direction. The BEKK-GARCH proposed by Engle and Kroner (1995) holds supreme importance in comprehensively exploring the volatility spillover relationship between time series analysis. This study employs uniquely for investor sentiment and tourism-related stocks.
GARCH Specification
The symmetric GARCH model proposed by (Bollerslev, 1986) is given as;


EGARCH Model
GARCH has restriction of symmetry, Brooks (2019), to capture asymmetry(leverage effect in firm operation), E-GARCH proposed by (Nelson, 1991).

GJR-GARCH Model
to capture unknown shock effects to the current conditional volatility GJR-GARCH proposed by (Glosten et al., 1993)

Bivariate BEKK-GARCH Model
The BEKK-GARCH proposed by R. F. Engle and Kroner (1995), to inspect the volatility spillover effect between investor sentiment and tourism-related stock returns.


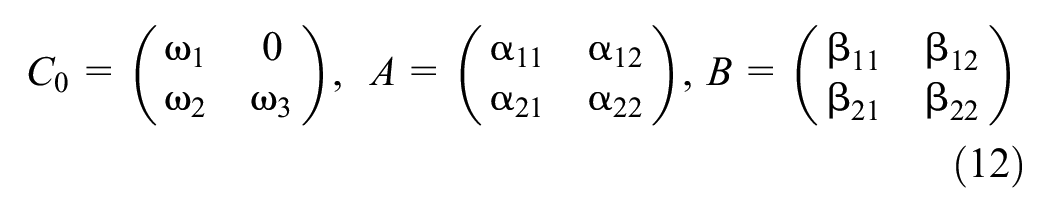
Where
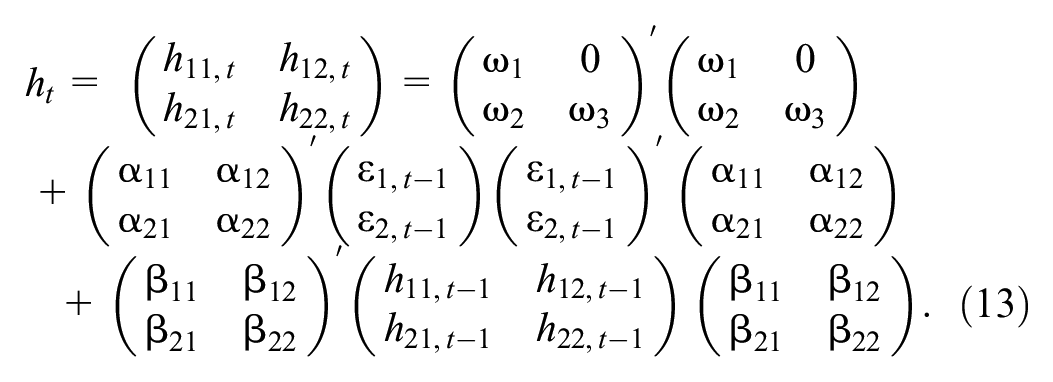
The above equation can be write like:


Empirical Results
Univariate Analysis
Table 3 exhibits the results of GARCH for period A, and the intercept demonstrates the statistical significance in nearly all sectors across period 1, implying that the current mean return relies on previous mean returns. The
GARCH(1, 1) Segment A.

Note.*,**,***, 1%, 5%, 10% significance, P stand for Pakistan, PF(food), PT(technology), PA(average tourism), PTT(Travel& transport), PTB(Tobacco) sectors.
Table 4 demonstrates that the impact of lagged-variance is almost overweight on current conditional volatility as compared to previous squared residuals. The (
E-GARCH (1,1).
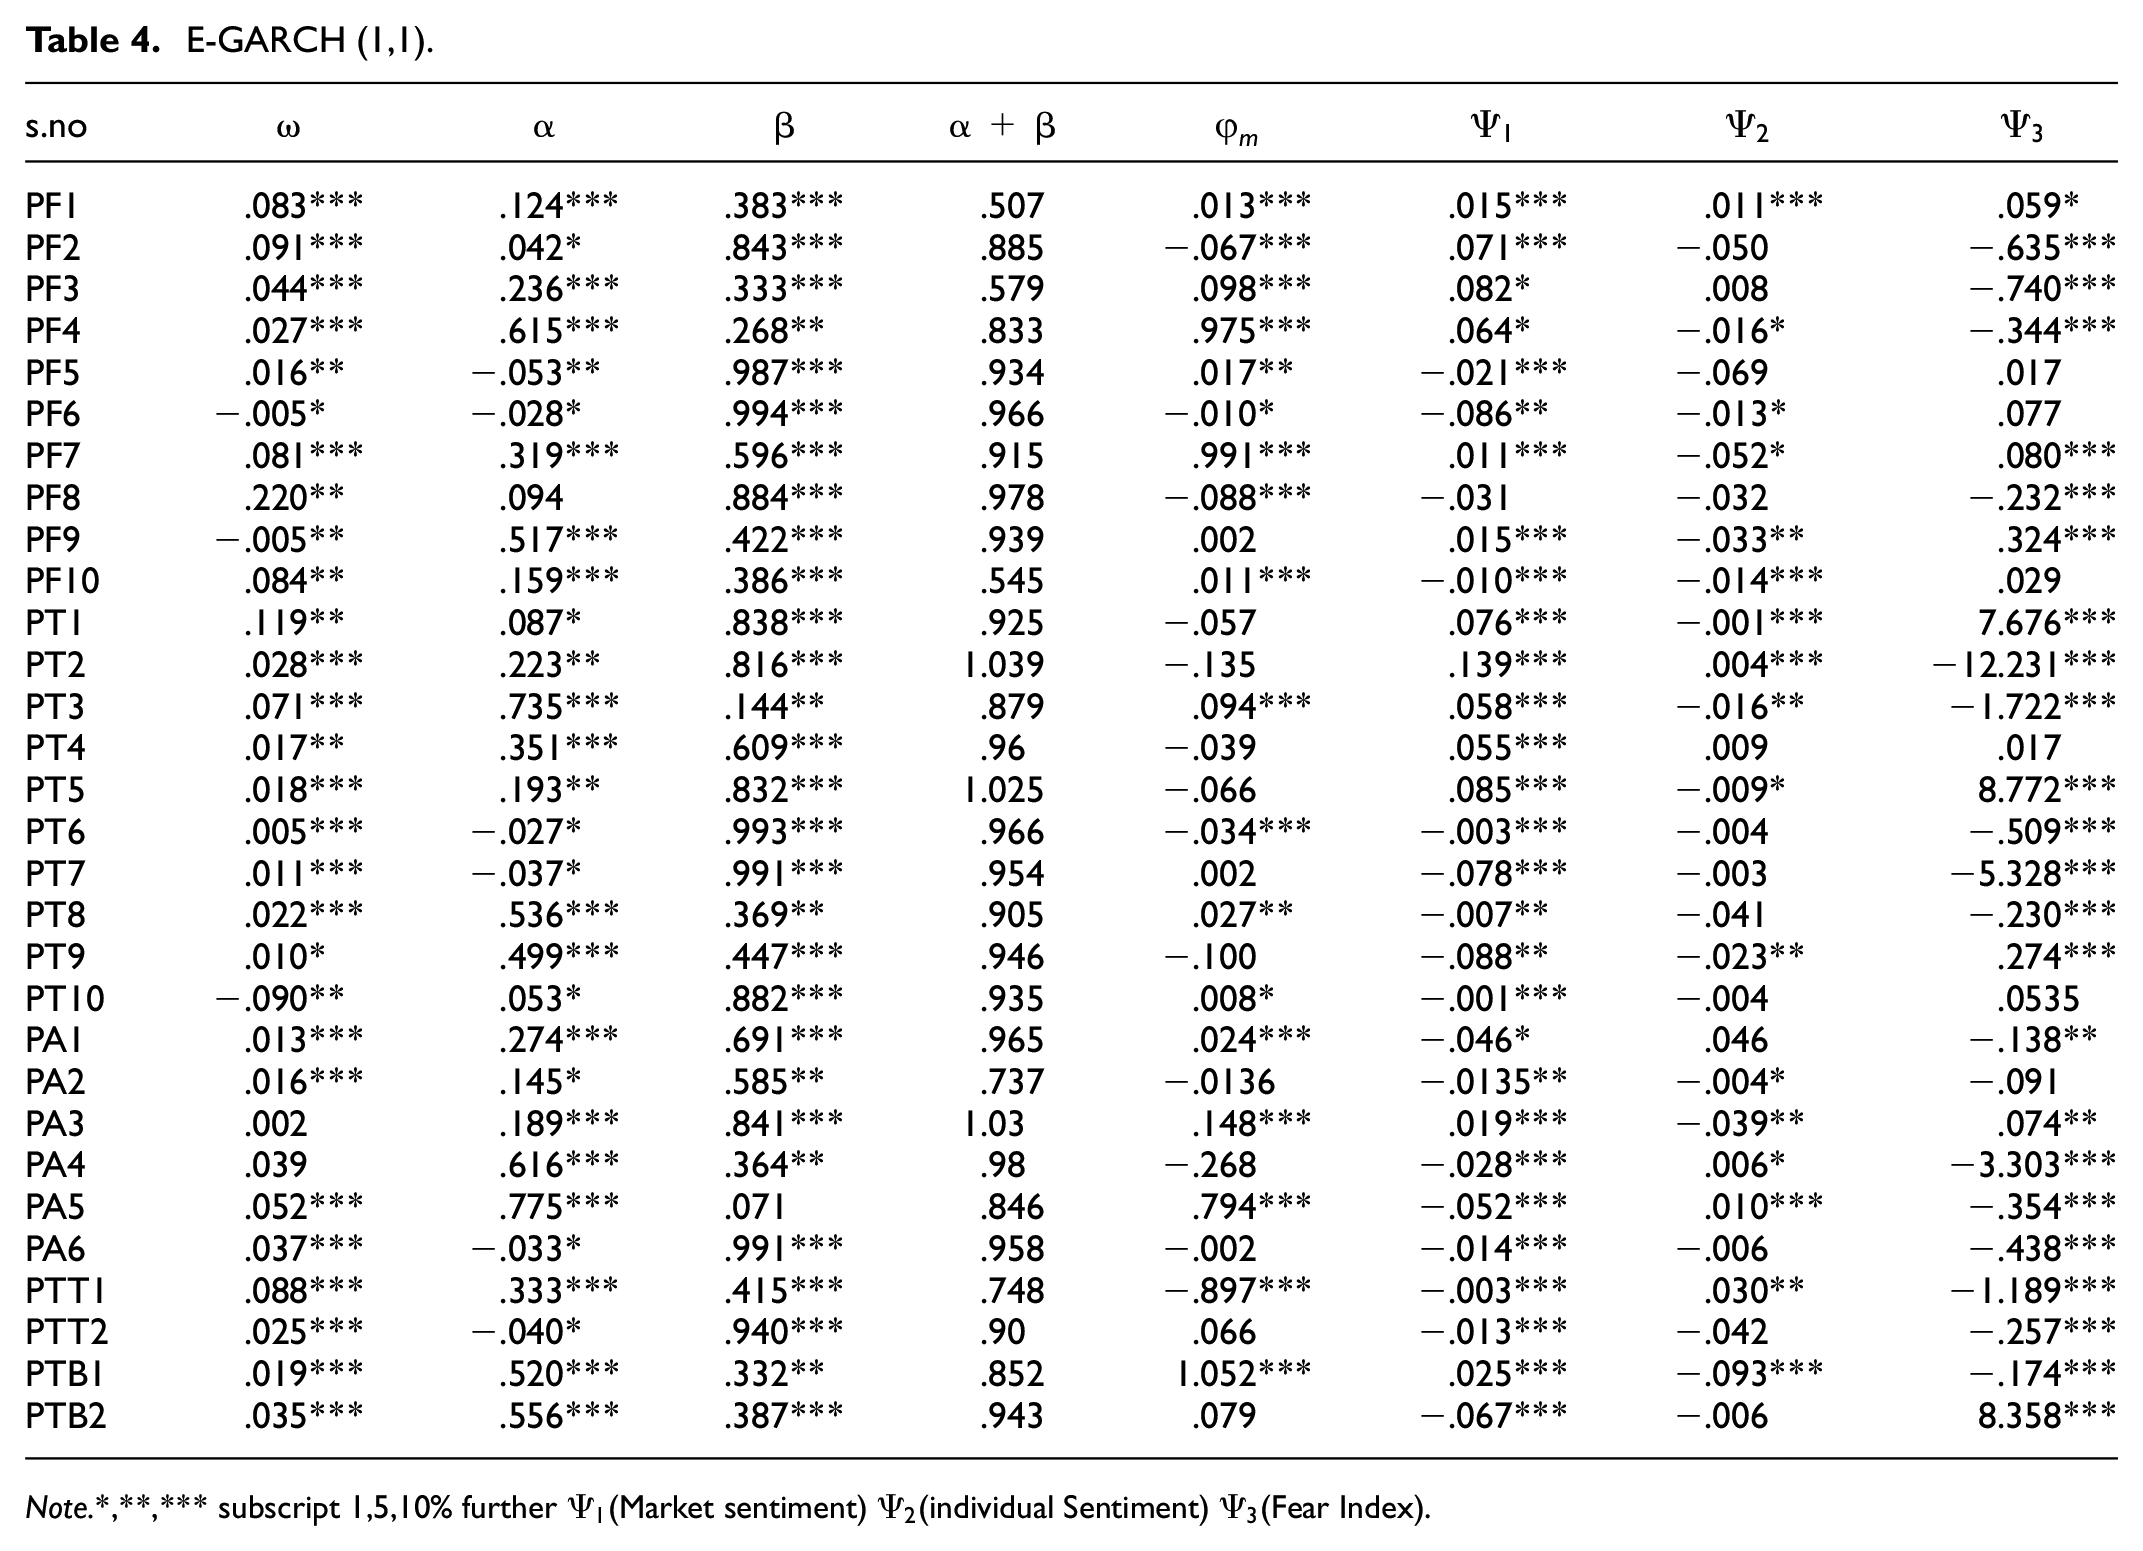
Note.*,**,*** subscript 1,5,10% further
Table 5. Presents GJR-GARCH (A). The lagged volatility to the current conditional volatility consistently leads over the lagged shock. Additionally, with the exception of PF1, 9 PT2, PA4, the absolute (α + β) exhibit mean reverting behavior. The
GJR-GARCH (1, 1).

Note. *,**,*** subscript 1%, 5%, 10% further
Table 6 displays the finding of GARCH period 2 (internal crises); intercept is nearly significant in all.
GARCH(1,1) period 2 (Internal crises).

Note.*,**,***, 1%, 5%, 10% significance, P stand for Pakistan, PF(food), PT(technology), PA(average tourism), PTT(Travel& transport), PTB(Tobacco) sectors.
Table 7. Presents the E-GARCH estimation amid internal crises; the comparison of α and β signifies that the current conditional volatility of tourism-related stocks significantly relies on past-volatility. (α + β) Abnormal behavior was detected in five firms, particularly in the PF sector, leading to prolonged market volatility where even minor shocks could create turbulence and will have a long-lasting effect on the current conditional volatility. Further, the asymmetric parameter
E-GARCH (1,1) Internal Crises Estimations.

Note.*,**,*** subscript 1%, 5%, 10% further
Table 8. Presents the finding of GJR-GARCH (B). The past-volatility prevails over past-shock. The Absolut (α + β) value in PF1,7, PT3, PA2, 4 and PBT2 exhibits abnormal volatility; the remaining are mostly close to unity but expected to mean-revert in near future. Further,
GJR-GARCH (1,1).

Note. *,**,*** subscript 1%, 5%, 10% further
Univariate Summary Tables
Table 9 presents that the current return volatility highly relies on past-volatility. The overall surge was perceived in leverage shocks, while notably, the harmful news impact diminished from P1 to P2. Further
Summary of Univariate GARCH Family Models.
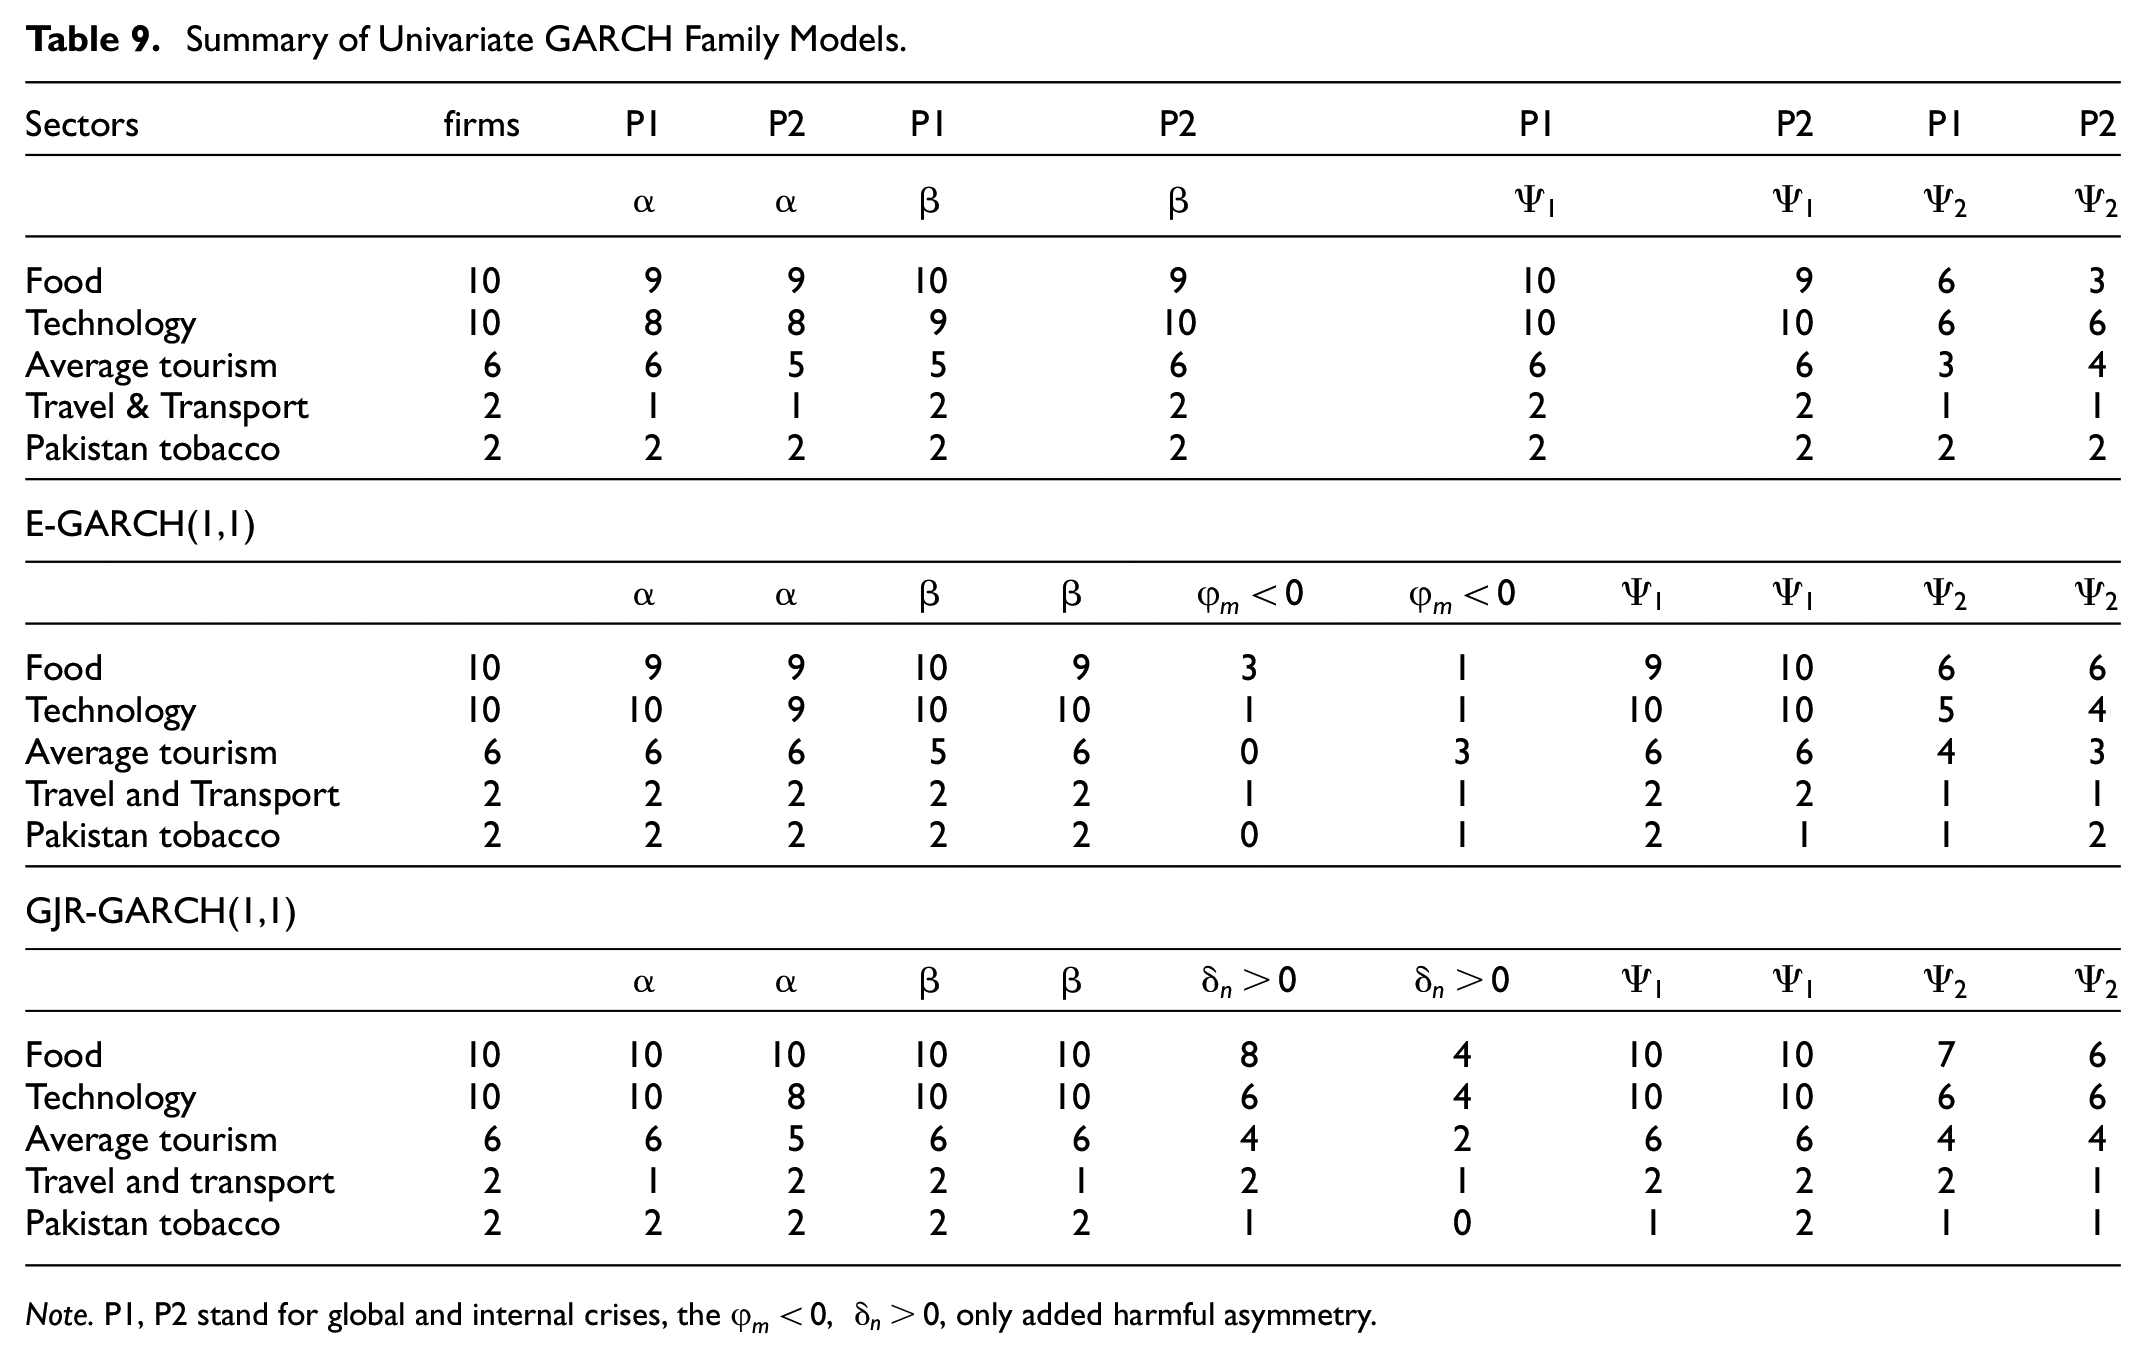
Note. P1, P2 stand for global and internal crises, the
Negative Shocks Summary of Univariate GARCH Family Models.

Note. P1, P2 stand for global and internal crises, 0 stance for non-negative coefficients.
Table 11 summarize that own lagged-shock and volatility except in EGARCH, the rest of all observed positive The overall negativity of
The Fear Index and EPU Summary of GARCH Family Models.
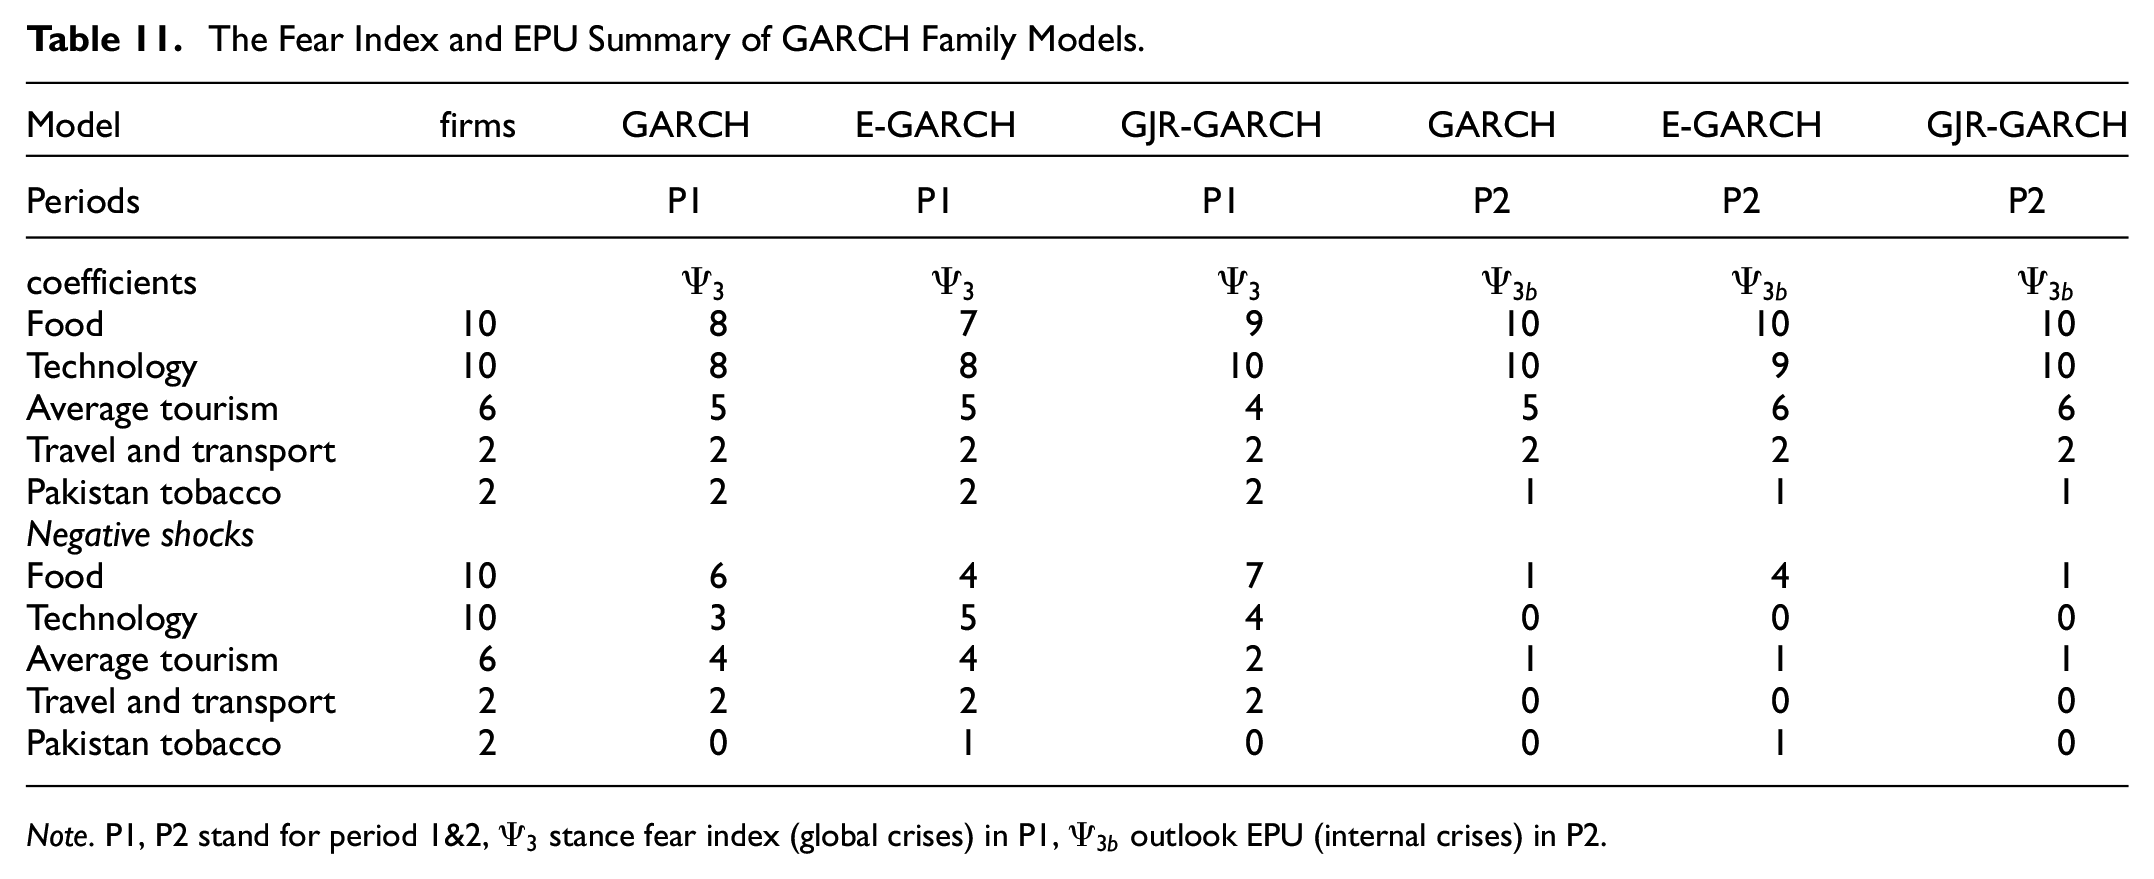
Note. P1, P2 stand for period 1&2,
Table 12 exhibits the findings of the BEKK-GARCH model, the main diagonal elements
BEKK-GARCH Model.
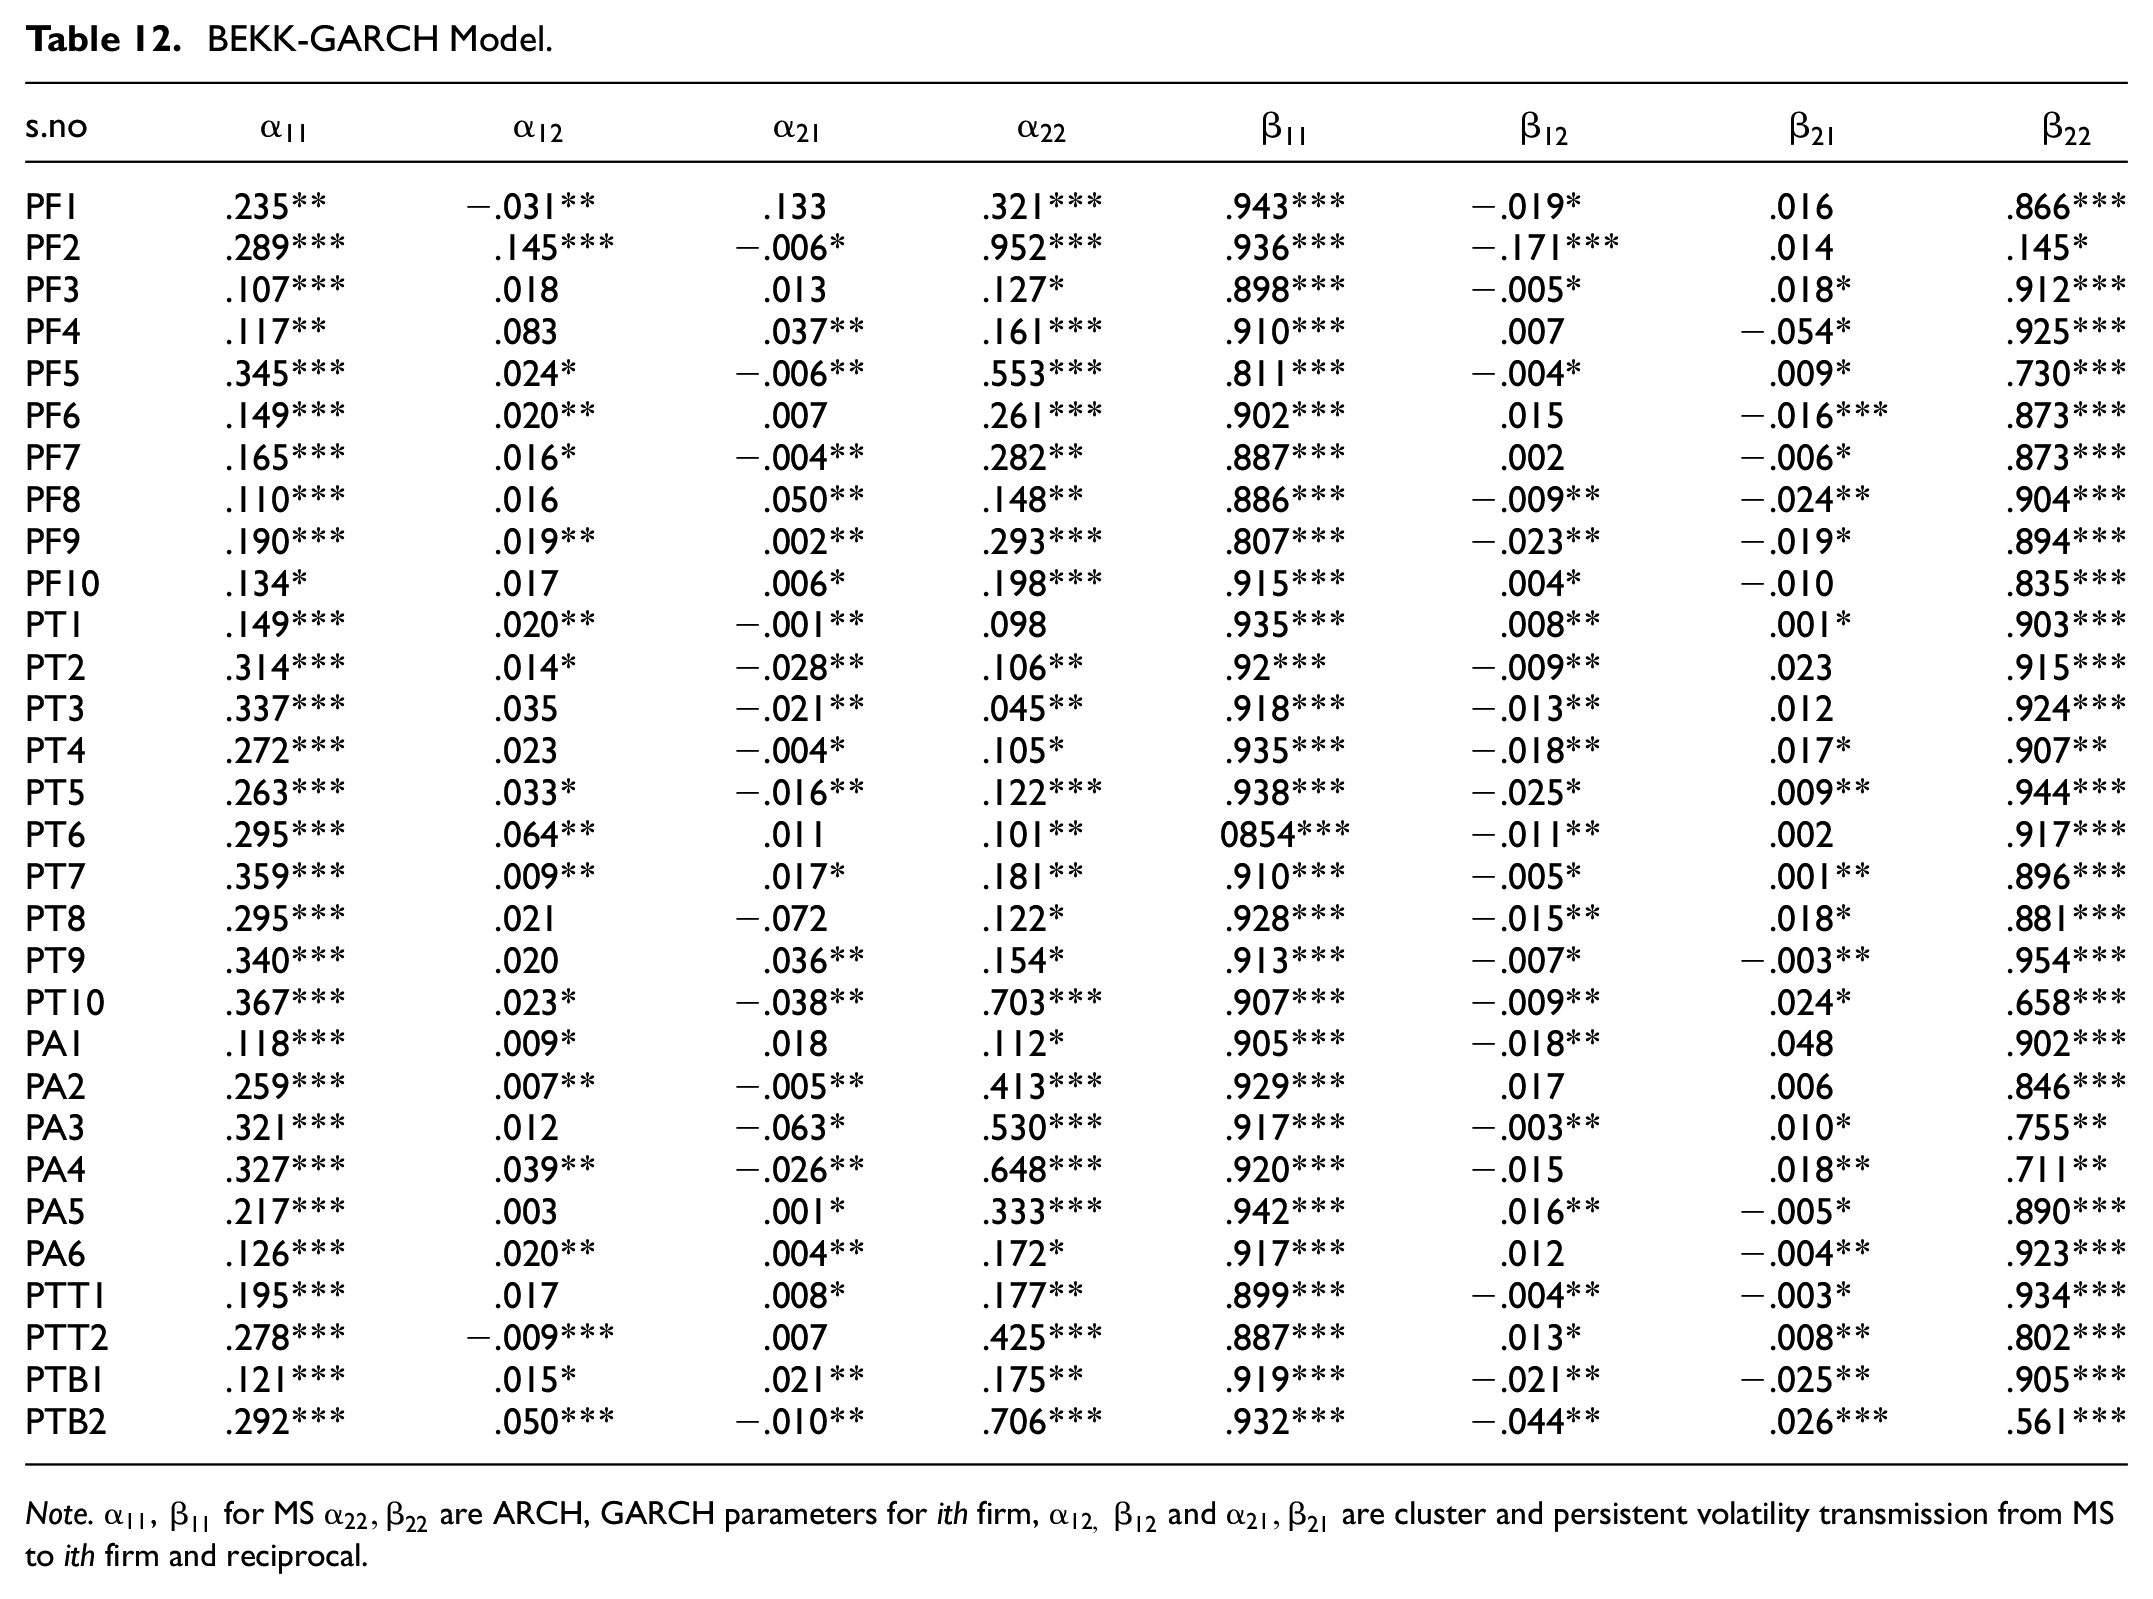
Note.
The non-diagonal element
Multivariate Summary Table
Table 13 presents the BEKK-GARCH summary, positive short-term spillover observed from MS to firms; the PT and PTB sectors are the most positive transmitters. The Lagged volatility spillover is highly negative among PT and PTB sectors, from firm to MS short term harmful transmission is high. Further, both short- and long-term bi-directional spillover is significantly witnessed in the PT and PTB sectors. This implies that any noise activities of herding behavior can strongly influence the conditional volatility of Pakistan’s tourism-related stocks.
Summary of BEKK-GARCH.

Note.
Conclusion
The present study concentrated on recent crises to investigate the impact of investor sentiment on PSX (Pakistan Stock Exchange) tourism-related stocks price volatility. The time spans from March 2020 to April 2023 divided into two portions to cover the most significant events of this century, such as the global pandemic and the internal political crises in Pakistan. Collected daily data for 30 firms and employed both univariate and multivariate GARCH family models. The results vary across the sectors, similar to the firm base analysis of Sarwar et al. (2019) on the Pakistan Stock Exchange (PSX). The following are the results.
The univariate-multi-variate analysis exhibits that the current conditional volatility of tourism-related firms significantly relies on past-volatility rather than lagged-shocks. Amidst the global health crisis (COVID-19), leverage and bad news were detected in the univariate analysis. The bearish sentiment observed, market-sentiment overshadowing individual sentiment, and fear-index significantly impacted the current conditional volatility.
In period B, both MS and economic policy uncertainty EPU (internal political unrest) exerted significant influence, and EPU led investor sentiment to ambiguity. In relevance to period A, the MS bearish sentiment amplified. It indicates that internal political crises are more prone to crash investors’ behavior, resulting in heightened volatility in tourism-related stocks. Conversely, the “smart lockdown” policy shielded Pakistan from economic crises, earning global commendation amid the outbreak (C. Wang et al., 2021). Furthermore, compared to period A, the asymmetry shows an increase in leverage effect from five to eight firms, accompanied by a decrease in bad news from nineteen to eleven. The PF, sector demonstrates heightened susceptibility to bad news. Despite being affected compared to period A, the PT sector demonstrated less susceptibility to these crises across the analysis. The multivariate analysis indicates a uni-bi-directional volatility transmission, with heightened short-term transmission from firm to sentiment. While the long-term spillover along with negativity observed from market sentiment to firms. Consequently, market sentiment emerges as the superior influential predictor for tourism-related sectors in the Pakistan stock exchange.
Implications
The empirical findings of this study align with prior literature; the bearish sentiment affects stock return volatility; aside from investor sentiment, the COVID-19(Fear index) and EPU have a prominent influence on current conditional volatility. The finding offers policy recommendations in the following.
Policy-makers ought to implement stringent measures to foster enduring political stability. Furthermore, it is advisable for them to educate both individual and institutional investors to augment their emotional intelligence, alleviate biases, and curtail noise trading through sensible decision-making.
Precautionary measures, such as text rate adjustment, supplementary financial grants, and lower interest rates, will encourage investment quality. Recently, in April 2023, SBP announced an all-time high interest rate of 21% (S. U. Rahman & Jan, 2023). These imprecise regulations and policies deter investment and generate uncertainty in the market.
Technology, a primarily demanded industry for tourism development, has demonstrated remarkable stability throughout the analysis. This stability positions it as a recommended opportunity for a secure investment in the Pakistan stock (PSX).
Limitation and Future Research
Tourism isn’t confined but comprises inter-related sectors, with findings extending partly to other PSX sectors. However, these limitations are emotional factors, limited time, and the unavailability of multiple data modes. Other global factors affect the return volatility; therefore, future research may involve exploring Pakistan’s reliance on oil imports. Utilizing multivariate DCC-GARCH and BEKK-GARCH can examine the joint impact of investor sentiment and crude oil spot prices on PSX return volatility, considering the Russia-Ukraine conflict.
Footnotes
Appendices
Clean Data Sentences.
|
https://en.wikipedia.org/wiki/2022%E2%80%932023_Pakistani_economic_crisis
|
P | N | Nt | pt | |
|---|---|---|---|---|---|
|
|
|||||
| 1 | Pakistan’s highest inflation badly affect the economy | 0.0 | 0.256 | 0.744 | −0.4764 |
| 2 | Covid-19 had a severe negative impact on Pakistan’s economy in 2020 and 2021 | 0.0 | 0.387 | 613 | −0.743 |
| 3 | textile industry distressed due to political unrest | 0.0 | 0.318 | 0.682 | −0.4221 |
| 4 | For the past 25 years, Pakistan’s debt has increased about every five years, having a dreadful impact on all stockholders | 0.089 | 0.23 | 0.681 | −0.5106 |
| 5 | The dissolution of the national assembly by the president, Dr. ArifAlvi, has seriously hampered Pakistan’s political stability | 0.0 | 0.091 | 0.909 | −0.1779 |
| 6 | Pakistan’s foreign exchange reserves are just enough to cover five weeks’ worth of imports, which is a poor omen for the country’s financial stability | 0.073 | 0.119 | 0.808 | −0.296 |
| 7 | If the stakeholders did not act fast and wisely, the CEO of Habib Bank warned that it might be a “devastating shock to the economy | 0.088 | 0.283 | 0.629 | −0.7351 |
| 8 | The rupee remain worthless 20% versus the dollar in a few days when Pakistan loosened the artificial ceiling on its currency | 0.0 | 0.123 | 0.868 | −0.4404 |
| 9 | Covid-19 BADLY hit the Pakistan stock market in the financial year 2020-2021! | 0.0 | 0.292 | 0.708 | −0.628 |
| 10 | A default for Pakistan is a serious possibility, according to the rating agency in New York and Moody’s!!. | 0.0 | 0.112 | 0.888 | −0.2225 |
|
|
|||||
| 1 | The decision to outlaw imported luxury items is excellent for the economy of Pakistan. | 0.222 | 0.0 | 0.778 | 0.5719 |
| 2 | The China-Pakistan Economic Corridor (CPEC) will strengthen Pakistan’s economy, which is like a galaxy on earth | 0.27 | 0.0 | 0.73 | 0.5859 |
| 3 | With a 6% GDP increase, Imran Khan a former Pakistani prime minister kept the country’s economy growing. | 0.235 | 0.0 | 0.756 | 0.235 |
| 4 | From 2018 until 2022, the Khan administration granted Pakistan high political stability!!. | 0.19 | 0.0 | 0.81 | 0.3786 |
| 5 | High profits were made in the first quarter of fiscal year 2023 by the textile sector. | 0.162 | 0.0 | 0.838 | 0.4404 |
| 6 | Agriculture experienced consistent growth in FY 22, exceeding the 3.5% growth objective. | 0.342 | 0.0 | 0.658 | 0.6369 |
| 7 | Remittances increased significantly, rising by a remarkable USD 26.1 billion (7.6%) from the preceding period | 0.322 | 0.0 | 0.678 | 0.6908 |
| 8 | With an increase of 1.65% from the prior period, FDI totaled USD 1.46 billion in financial year 10 months of 2022!!. | 0.126 | 0.0 | 0.874 | 0.4374 |
| 9 | KSE-100 index climbed to 47,356 points in 2021, which is the highest growth After COVID-19 | 0.157 | 0.0 | 0.843 | 0.3818 |
| 10 | Pakistan reveals that the KSE-100 index will CLIMB swiftly due to the appeal of overseas investors!!. | 0.148 | 0.0 | 0.852 | 0.4184 |
|
https://www.centralbanking.com/organisations/state-bank-of-pakistan
|
|||||
| 1 | Due to political turmoil, foreign investors stopped investing in Pakistan’s stock market | 0.0 | 0.306 | −0.694 | −0.5267 |
| 2 | The country has been affected by high inflation rates. | 0.0 | 0.186 | 0.814 | −0.1531 |
| 3 | The oil prices have TERRIBLE implication on each corner of the country. | 0.0 | 0.228 | 0.772 | −0.5904 |
| 4 | The IMF has put pressure on Pakistan to tighten monetary policy, and end subsidies. | 0.0 | 0.145 | 0.855 | −0.296 |
| 5 | Honda Atlas is still closing its plant because of import problems in Pakistan!!. | 0.0 | 0.215 | 0.785 | −0.508 |
| 6 | During the most recent quarter, the State Bank of Pakistan’s (SBP) foreign exchange reserves VERY BADLY affected and it decreased by $354 million. | 0.0 | 0.261 | 0.739 | −0.8143 |
| 7 | The sudden economic crises in Pakistan create fear for foreign investors. | 0.0 | 0.224 | 0.629 | −0.2732 |
| 8 | The Pakistani rupee is in a serious phase against the US dollar!!. | 0.0 | 0.159 | 0.841 | −0.2225 |
| 9 | As a result of the SBP’s fearful taxation, the companies stopped operating. | 0.0 | 0.362 | 0.638 | −0.6249 |
| 10 | The tsunami in Pakistan’s northern regions in 2022 had a devastating impact on the country’s already fragile economy. | 0.0 | 0.212 | 0.788 | −0.6486 |
|
|
|||||
| 1 | The CPEC flagship project would boost the economy of both nations and the positive connection. | 0.391 | 0.0 | 0.609 | 0.7717 |
| 2 | To prevent Pakistan from going into default, the IMF loan money is a positive gesture for the already fragile economy | 0.217 | 0.0 | 0.783 | 0.5719 |
| 3 | The Tribune Pakistan offers better advice on safe investment avenues in the Pakistani stock market. | 0.309 | 0.0 | 0.691 | 0.7003 |
| 4 | In comparison to the same period last year, the electricity and food & beverage sectors make 2.5% higher profit in the second and third quarters of the fiscal year 2022. | 0.094 | 0.0 | 0.906 | 0.4404 |
| 5 | China contributed US$ 249.6 million to the CPEC flagship project as a helpful gesture for Pakistan’s economy. | 0.231 | 0.0 | 0.769 | 0.4939 |
| 6 | For both domestic and foreign investors, real estate investment in Pakistan offers the best opportunities. | 0.343 | 0.0 | 0.657 | 0.7783 |
| 7 | The Technology, healthcare, and tourism industries are the most lucrative investment prospects for American-Pakistani investors to move their capital to Pakistan!!. | 0.132 | 0.0 | 0.868 | 0.4674 |
| 8 | Contributing to Roshan Digital, which has just recently seen its greatest daily deposits—$57 Million in a 24-hour period—on June 30, 2022. | 0.181 | 0.0 | 0.819 | 0.6369 |
| 9 | The financial action task force’s affirmative recommendation to remove Pakistan from the FATF’s gray list.!! | 0.113 | 0.0 | 0.887 | 0.1984 |
| 10 | Former prime minister Imran khan insisted that for better economic stability needs political stability. | 0.182 | 0.0 | 0.818 | 0.4404 |
Note. N (negative), P(positive), Nt(neutral), Pt(polarity).
Declaration of Conflicting Interests
The author(s) declared no potential conflicts of interest with respect to the research, authorship, and/or publication of this article.
Funding
The author(s) disclosed receipt of the following financial support for the research, authorship, and/or publication of this article: This study was supported by Project of Hainan Academician Innovation Platform Scientific Research (YSPTZX202210).
Data Availability Statement
Data is Available upon reasonable request.