
Abstract
We investigate whether idiosyncratic risk and investor sentiment play important roles in the price disparity between China A-shares and H-shares. To build the investor sentiment indices and decompose them into different fragments for both markets, we use both principal component analysis (PCA) and partial least squares (PLS) approaches. We further look at how idiosyncratic risk affects stock mispricing and how it deals with investor sentiment. We find that the price premium of A-shares over H-shares is strongly linked to the sentiment differential. We also discover that idiosyncratic risk has a major effect on the price premium of cross-listed companies. Moreover, a larger sentiment differential reinforces the impact of idiosyncratic risk on the price disparity. The above results remain robust after controlling for other economic factors.
Introduction
International diversity attracts free capital moving across borders, and numerous companies have gained capitals outside of their home countries over the last few decades. Cross-listing refers to a company listing its shares in the overseas market as well as its home market. The emphasis of this article is on Chinese cross-listed companies that issue A-shares and H-shares. There are some distinctions between the two groups of stocks. A-shares are limited to domestic investors and are listed and exchanged on the stock exchanges in Mainland China. H-shares, on the other hand, are listed on the stock exchange in Hong Kong and have their headquarters in Mainland China. It is worth noting that H-shares are available for purchase by Hong Kong and international buyers.
If stock markets are effective and arbitrage is easily implemented, foreign and domestic securities should have the same price. However, according to Fernald and Rogers (2002), A-shares in Mainland China are traded at a premium to H-shares. Although the price disparity of cross-listed companies has been discussed for years, there has been comparatively limited literature on both investor sentiment and idiosyncratic risk. Previous research has verified the individual impact of market sentiment or idiosyncratic risk on the mispricing, such as Baker and Stein (2004), Baker and Wurgler (2006), Pontiff (2006), Schmeling (2009), and Beckmann et al. (2015). The combined effect of investor sentiment and idiosyncratic risk on stock mispricing is the subject of this article. We look into how idiosyncratic risk influences price disparities as investor sentiment shifts. Another distinction from previous research is that this article uses two methods, principal component analysis (PCA) and partial least squares (PLS) approaches, to create investor sentiment measures. The following questions are addressed in this article: How much does the difference in investor sentiment between the two markets, whether total or local, impact the price gap between A-shares and H-shares? What role does idiosyncratic risk play in the stock price disparity between cross-listed companies? What is the relationship between idiosyncratic risk and investor sentiment?
This article makes several contributes to the current literature. First, voluminous research on the price disparity of cross-listed firms has been conducted, with an emphasis on developed markets. Markets we investigate in this study concentrate on emerging markets with a limited degree of openness. We apply a panel data methodology to assess the degree to which idiosyncratic risk and investor sentiment explain the price disparity.
Second, it is an innovative exercise to use both PCA and PLS methods to build investor sentiment to investigate price deviations in cross-listed securities. Our article is unique in that it decomposes investor sentiment into various fragments and tests the impact of total and local sentiment differentials, as well as idiosyncratic risk, on mispricing. Previous research has always used a single index to assess investor sentiment. For example, to measure investor sentiment, Arquette et al. (2008) use the price–earnings ratio as a metric to examine the price disparity of Chinese cross-listed companies. We have some reservations about this metric since a single index does not necessarily provide comprehensive economic viewpoints. Other studies using the composite sentiment index often apply one method, either PCA method (Baker et al., 2012; Fu et al., 2020) or PLS method (Wu et al., 2017). This article, as stated above, employs both PCA and PLS methods to construct the composite sentiment indices and test their roles in the price disparity between China A-shares and H-shares.
Finally, the interaction effect between investor sentiment and idiosyncratic risk is investigated in this article. Gagnon and Karolyi (2010) examine arbitrage risk using idiosyncratic volatility and Stambaugh et al. (2015) follow suits. In this article, we test the marginal effect of idiosyncratic risk on the price deviation of A-shares and H-shares while sentiment is changing. Prior studies have confirmed that differences in demand, liquidity, risk, and information asymmetry are associated with the underlying stock price premium (Bailey & Jagtiani, 1994; Chakravarty et al., 1998; Chan et al., 2008; Grossmann et al., 2007; Karolyi et al., 2009; Mei et al., 2005; Rui et al., 2007; Stulz, 1981; Stulz & Wasserfallen, 1995; Sun & Tong, 2000; Wang & Jiang, 2004). After controlling for these traditional factors, according to our findings, a high sentiment differential strengthens the impact of idiosyncratic risk on the stock price premium.
The remainder of this article is structured as follows. In the second section, we lay out the main hypotheses. Third section describes the data and empirical design. Fourth section presents the empirical results, and fifth section summarizes and draws conclusions.
Literature Review and Hypotheses
Investor Sentiment and Mispricing of Chinese Stocks
Current literature has verified that market sentiment affects stock returns in a single market (see Baker & Wurgler, 2006, 2007; Brown & Cliff, 2005; Huang et al., 2015). They primarily concentrate on the US and other developed stock markets and show that sentiment influences the mispricing of stocks. Baker and Wurgler (2006, 2007) investigate this mispricing by creating a combined market investor sentiment index. They use the first principal component of six (four) proxies for sentiment and relate it to the stock price deviations. Other studies create sentiment proxies, either single or composite, to investigate the mispricing of stocks. Closed-end fund discount (Qiu & Welch, 2004), investor intelligence (Brown & Cliff, 2004; Wang, 2020), retail investors’ trading activities (Kumar & Lee, 2006), consumer sentiment (Lemmon & Portniaguina, 2006), mutual fund flows (Frazzini & Lamont, 2008), consumer confidence (Qiu & Welch, 2004; Schmeling, 2009), aggregate net exchanges of equity funds (Ben-Rephael et al., 2012), FEARS index (Da et al., 2015; Khan et al., 2020), and internet search-based investor sentiment (Klemola, 2020; Ruan et al., 2020) are some of the sentiment proxies. However, the above literature focuses mostly on a single stock market. They do not include cross-listed firms that trade on different exchanges. Kling and Gao (2008), Chi et al. (2012), Han and Li (2017), Fu et al. (2020), and Lan et al. (2021) are some of the work that concentrates on the Chinese stock market. These studies, however, still pay attention to a single market. Wang and Jiang (2004) put their emphasis on Chinese cross-border listed companies. They investigate firms that issue both A-shares in Mainland China and H-shares in Hong Kong and simply use the stock market index returns to gauge the stock investor sentiment, as Froot and Dabora (1999) did. These studies have not emphasized enough the role of investor sentiment in cross-listed company price disparity. Arquette et al. (2008) analyze the stock price differential between Chinese stocks traded on the domestic market and foreign markets. They argue that company-specific and market-specific sentiment impacts can at least partially explain cross-sectional price variation. The price–earnings ratio is used to gauge investor sentiment. Other studies, such as Guo (2013), also investigate this mispricing and adopt the same single index to reflect the changes of market sentiment to examine price disparities in Chinese cross-listed firms. Compared with the above studies, we divide the sentiment indices into total, local, and global fragments using both PCA and PLS approaches. Unlike Baker et al. (2012), who examine market deviations for just three dual-listed firms, we look at a much larger number of Chinese firms. When market investor sentiment is relatively high, according to Wu et al. (2017), investors tend to be more positive about the future and buy more stocks. As a result, this market’s stock prices rise. We conjecture that the price disparity of cross-listed companies is positively linked to the sentiment differential. We thereby hypothesize the following:
Idiosyncratic Risk and Mispricing of Chinese Stocks
In the following sections, we also test how idiosyncratic risk impacts cross-listed company mispricing. Idiosyncratic risk is the element of the fundamental value and is uncorrelated to the returns of other assets that are available to the arbitrageur (Pontiff, 2006). Merton (1987) observes that when stock markets are segmented, the idiosyncratic risk would increase potential expected returns. He also claims that investors would pay a fixed fee to become informed. Shleifer and Vishny (1997), on the other hand, contend that stocks are not priced rationally, and stocks with high idiosyncratic variance are likely to be overpriced. Idiosyncratic risk deters arbitrage. According to Pontiff (2006), the single greatest cost faced by arbitrageurs is the idiosyncratic risk. The above studies investigate the relationship between idiosyncratic risk and stock price. Afterward, using 12 cross-listed firms from 1980 to 2002, De Jong et al. (2009) leverage the price deviation. They suggest that the arbitrage of cross-listed companies is affected by idiosyncratic return volatility and negative returns are likely to impede arbitrage. According to Gagnon and Karolyi (2010), increases in price disparities are positively correlated with proxies reflecting holding costs that would hinder arbitrage. They argue that idiosyncratic risk is the most significant statistical and economic proxy for holding costs. Similar work are Beckmann et al. (2015), Stambaugh et al. (2015), Wu et al. (2017), and Li and Ran (2020). All the above studies do not emphasize the mispricing of stocks from the perspective of idiosyncratic risk as well as investor sentiment for cross-listed companies. In the parts that follow, we examine how idiosyncratic risk impacts the price variation of stocks of cross-listed companies with varying investor sentiment. When investor sentiment becomes high, investors appear to become hesitant to arbitrage since holding costs would rise (Pontiff, 2006).
Data Description and Empirical Design
Basic Approach
In building the stock market sentiment index, we use both PCA and PLS approaches. To derive the first principal component, Baker and Wurgler (2006) use six proxies to represent market sentiment. PCA approach is used to figure out data’s underlying structure. Baker and Wurgler (2007), Stambaugh et al. (2015), and Wu et al. (2017) employ the same method to prove its validation and test their hypotheses. PCA procedure is as follows. The eigenvalue and eigenvector are calculated after standardizing the sentiment proxies. The composite index is then generated by combining the proxies in a linear fashion using the eigenvector that best represents the total variance.
To predict the aggregate stock market, Huang et al. (2015) use PLS approach instead of PCA, to propose a new aligned investor sentiment index. They argue that, according to Baker and Wurgler (2006, 2007), investor sentiment cannot be distinguished from the common approximation error component of the proxies that are unrelated to returns. To resolve this challenge, they filter out the irrelevant components in sentiment proxies, as Wold (1966, 1975) did, to build a new, better predictor. To construct the PLS index, first, we run N time-series regressions as follows:

where
Second, run T cross-sectional regressions as follows:

where
Data and Sample Periods
This article relies on data from the CEIC and Wind databases. From January 2003 to December 2019, our sample includes A-shares and H-shares that are listed on the Shanghai and Hong Kong stock exchanges, respectively. There are 95 companies issuing both A-shares and H-shares by the end of the year 2019. To ensure that we have adequate data for all the variables, 75 companies are excluded because A-shares or H-shares of the companies were listed after 2003. Finally, we get 20 companies whose listing date is before 2003 on both markets. To calculate market returns, the Shanghai Composite Indices and the Hang Seng Index are used. The risk-free rate is subtracted from the market return to measure the excess market return. The risk-free rate is described as the monthly rate of a 1-year time deposit in Mainland China, according to the convention. The risk-free rate in Hong Kong is the Hong Kong Interbank Offered Rates (3-month HIBOR). We also calculate market returns using value-weighted market indices and obtain similar results.
Investor Sentiment
Following Verma and Soydemir (2009), Baker et al. (2012), Han and Li (2017), Wu et al. (2017), and Li and Ran (2020), the market turnover ratio (aggregate market value-weighted), the price–earnings ratio, and the total number of initial public offerings (IPOs) are used as substitutes to construct the total sentiment index for the stock market in Hong Kong. For stock market in Mainland China, however, we combine the market turnover ratio (aggregate market value-weighted), the price–earnings ratio, and the newly opened accounts number of individual investors (in Shanghai Stock Exchange) to calculate the total sentiment index. It is worth noting that in the absence of IPO data, we use the number of new accounts instead of IPO data for the Shanghai Stock Exchange. The use of the above sentiment proxies in our article is motivated primarily by data availability and economic considerations, and the details of the proxies can be found in Li and Ran (2020).
To create a “total” investor sentiment for the Mainland China and Hong Kong stock markets, we use both PCA and PLS approaches described above. Global and local investor indices are then established. The methods for calculating global and local sentiment indices can be found in Baker et al. (2012).
Idiosyncratic Risk
According to Pontiff (2006), the single greatest cost faced by arbitrageurs is the idiosyncratic risk. As is pointed out, idiosyncratic risk is a component of intrinsic valuation that is irrelevant to market returns or the returns of some other hedge portfolios. Gagnon and Karolyi (2010), as well as Wu et al. (2017), investigate how idiosyncratic risk affects cross-listed markets. Following Gagnon and Karolyi (2010), we estimate a regression of the daily return differential using contemporaneous leading, lagged daily stock index returns from Mainland China and Hong Kong, and the currency shifts, within each company quarter:

where
Table 1 provides the summary statistics of this article.
Descriptive Statistics.

The table shows the summary statistics for the market excess returns (
Control Variables
Our research links investor sentiment and idiosyncratic risk to the price disparity found in Chinese cross-listed companies. Instead of using a single sentiment index, we explore the relationship among investor sentiment, idiosyncratic risk, and stock price differentials using both PCA and PLS sentiment indices.
The stock price premium of A-shares over H-shares is defined as the dependent variable in the study. Previous research has looked at the price disparity between cross-listed stock markets and offered several reasons for the price deviations. We add four commonly used variables in the literature, as well as other control variables for reference.
Demand differential
According to studies such as Sun and Tong (2000) and Darrat et al. (2006),
Asymmetric information
Previous literature has used market capitalization to quantify asymmetric information. According to Chan and Kwok (2005) and Karolyi et al. (2009), larger corporations with higher market capitalizations often release more information. The total amount of market capitalization of the A-shares and H-shares is used to measure
Liquidity differential
Risk differential
Others
We introduce a
Model Specification
First, we plan to look at how investor sentiment differential impacts the price disparity between the two types of shares. We analyze how fluctuations in stock price premiums are correlated to market investor sentiment across companies using a panel data approach. The full models are as follows:


where
As mentioned in prior studies, investor sentiment would influence the mispricing indirectly by idiosyncratic risk (Wu et al., 2017). In the second step, we intend to investigate whether the magnitude of the price premium varies over time in a way that is related to the idiosyncratic risk.
We conduct the following regressions to examine the magnitude of the price premium that arises from idiosyncratic risk, with and without sentiment controls. We add the interaction term of idiosyncratic risk and investor sentiment to explore the indirect impact of investor sentiment. The models are as follows:


where
Empirical Results
Sentiment Differential and Price Disparity Between A-Shares and H-Shares
Table 2 provides empirical results for the impact of sentiment differential on price disparity between A-shares and H-shares. Positive coefficients in the table indicate that the increase of the variables would lead to a larger price premium. The findings in Column (1) of Panel A reveal that by using PCA approach, the difference in investor sentiment between the two markets plays a critical role in deciding the price disparity of cross-listed stocks. The coefficient of
Time Series Regressions for Cross-Listed Companies.
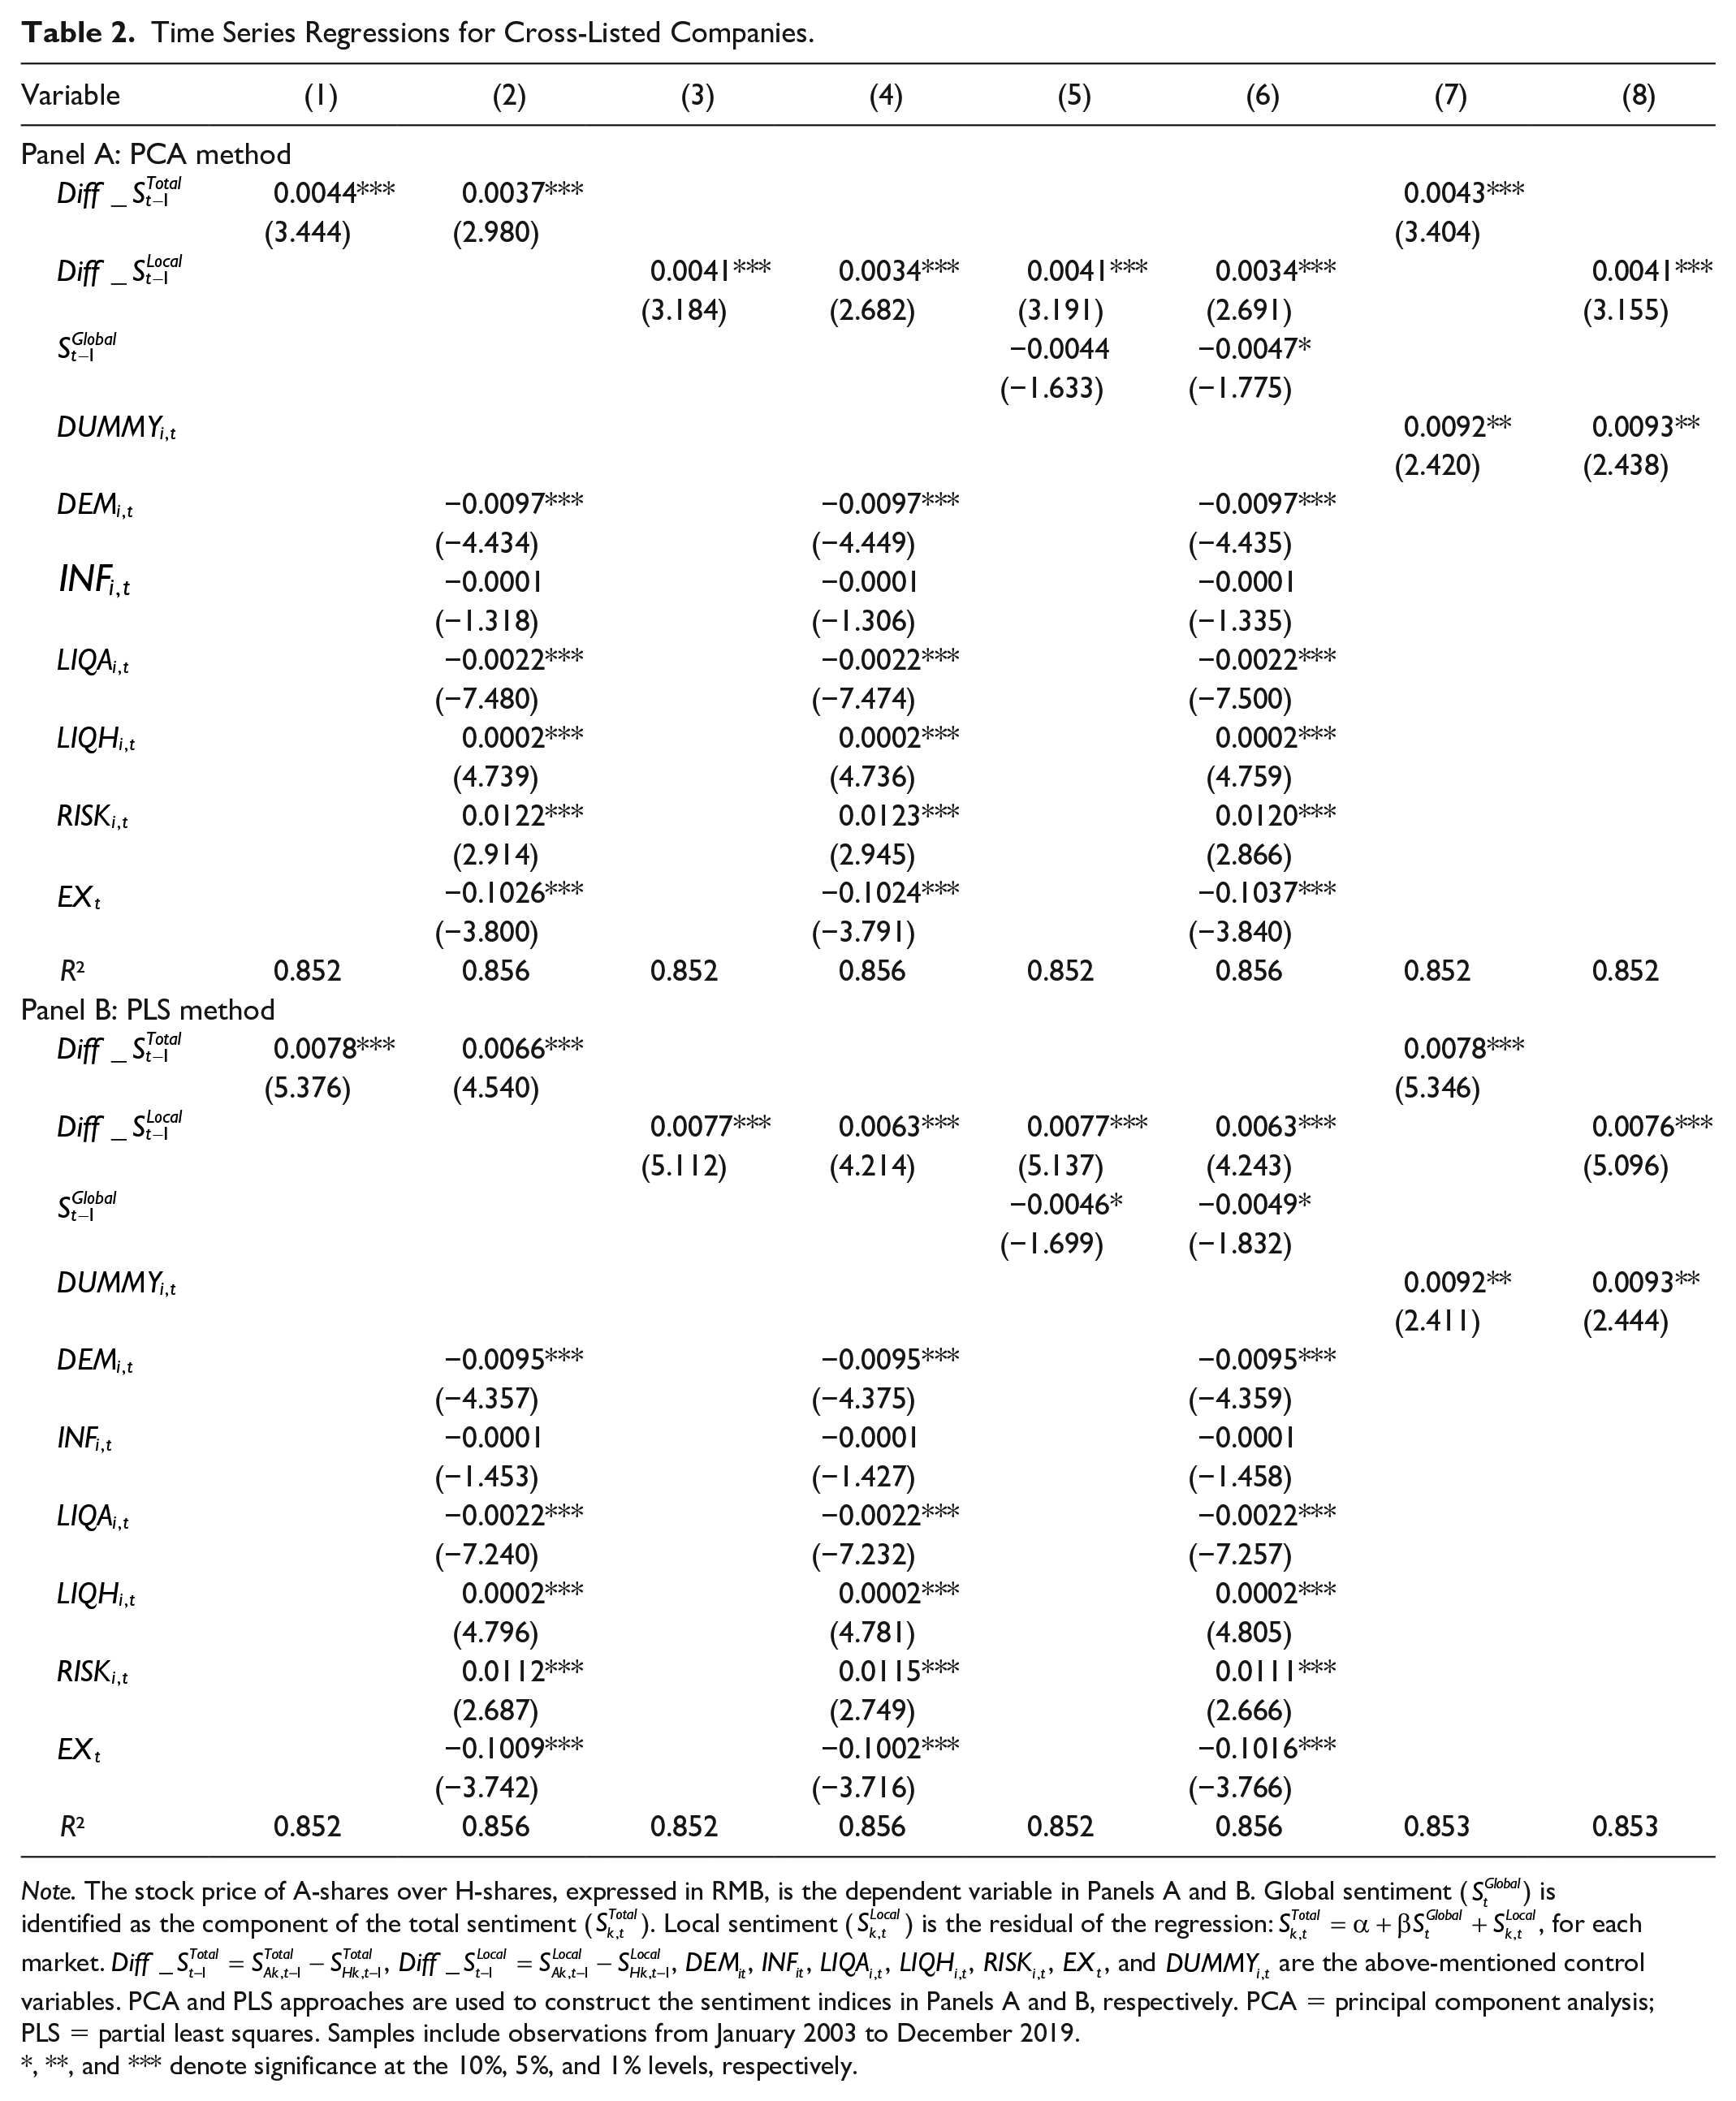
Note. The stock price of A-shares over H-shares, expressed in RMB, is the dependent variable in Panels A and B. Global sentiment (
, **, and *** denote significance at the 10%, 5%, and 1% levels, respectively.
Findings in Panel B are quite close to the results in Panel A. We can conclude from Column (1) that sentiment differential is strongly linked to the A-H stock price gap. The coefficient of
Idiosyncratic Risk and Price Disparity Between A-Shares and H-Shares
Idiosyncratic risk, as stated in previous studies, will increase the price disparity between cross-listed shares. We plan to investigate the primary factors that influence the price gap. We would test how idiosyncratic risk behaves when investor sentiment changes. To begin, we sort the stock price premium between the two types of shares based on investor sentiment indices and company-level idiosyncratic risk. Table 3 shows the simple two-way sorting. On one hand, as idiosyncratic risk grows, the price gap of A-shares compared with H-shares rises in all four of our categories. Regardless of the size of the sentiment differential, the price premium is higher in high-idiosyncratic-risk categories. On the other hand, in most situations, the price premium in small-sentiment-differential categories is relatively small on average. We may infer that the price premium in large-sentiment-differential groups is higher on average than the price premium in small-sentiment-differential groups. Based on this, we will explore whether the difference in investor sentiment has an indirect impact on stock price premium through idiosyncratic risk.
Two-Way Sorts: Idiosyncratic Risk and Sentiment Indices.

Note. We form five portfolios based on idiosyncratic risk for each month, and we offer an equal-weighted price premium across months where the total (local) sentiment differential from the previous month is greater than the within-company median or less than the within-company median. Monthly returns from 2003 to 2019 are included in the sample.
We run several regressions according to Equations 6 and 7. As seen in Table 4, idiosyncratic risk is a statistically important element in the stock price premium of A-shares over H-shares. What should be pointed out is that data for the BW index are only updated to the end of 2018 (http://people.stern.nyu.edu/jwurgler/), so the sample period in Table 4 is from January 2003 to December 2018. The coefficient of
Time Series Regressions for Cross-Listed Companies.

Note. The stock price of A-shares over H-shares, expressed in RMB, is the dependent variable. Each company’s idiosyncratic risk is denoted by
, **, and *** denote significance at the 10%, 5%, and 1% levels, respectively.
Panel B presents the findings while sentiment indices are calculated using PLS method. In all regressions, the idiosyncratic risk in Panel B is positively linked to the stock price premium. When control variables are allowed, the results are robust. The interaction term (
Conclusions
Although investor sentiment and idiosyncratic risk have been extensively studied, previous studies did not decompose the sentiment index into different fragments using both PCA and PLS approaches and combined it with idiosyncratic risk to investigate the price difference between A-shares and H-shares in China. In evaluating the price disparity, we compare the results of PCA and PLS investor sentiment indices. In our research, we discover that the price premium of the two types of shares is closely related to the total (local) investor sentiment differential. In addition, we discover that the idiosyncratic risk of the stock is positively linked to the price premium, and a higher sentiment differential strengthens the impact of the idiosyncratic risk of the stock on the price premium. Our article adds to the current literature on idiosyncratic risk and investor sentiment by decomposing the investor sentiment using PCA and PLS approaches and analyzing the interaction effect of idiosyncratic risk and sentiment in financial markets.
Findings in this article include much food for thought. First, in many ways, investor sentiment could be used as an indicator to help investors track market drift patterns. According to our findings, when investor sentiment differential rises, the price premium increases. We discover that the price premium will continue to climb for a few months when the sentiment differential hits its apex and starts to decrease. We assume that the price premium is 2 to 3 months ahead of the shift in sentiment differential. The lead–lag time intervals can be used by investors to make changes to their positions.
Second, Shanghai-Hong Kong Stock Connect has failed to narrow the price gap between A- and H-shares as predicted. On one hand, there exists a big difference between the two markets in terms of investor structures, regulatory environment, and investment philosophy. Different attitudes toward speculating and investing lead to different portfolio choices. Investors in Mainland China are most likely to focus on the stock price rather than the dividend paid and thereby lead to the pursuit of some particular stocks. The difference in the investment philosophy could not be changed with the launch of the program. On the other hand, the relatively strict restrictions result in limited investment choices for investors in Mainland China, which incurs long-term overvalued A-shares. Besides, the price of A-shares is more volatile and more susceptible to government policies. Overseas investors are prone to invest in A-shares to make profits. The above issues, in our view, would lead to a larger price gap between the two types of shares. It is worth noting that the program’s introduction seeks to promote the openness of the stock market, and narrowing down the price disparity is not the main target of the program. The diathesis of small and medium investors will be strengthened with the gradual opening of the capital market, and a more rational investment atmosphere will be formed under the guidance of the government. The Nasdaq-like Star Market, which debuted in July 2019, is a good example of this transition.
One of the drawbacks of this article is that it only includes companies listed in Shanghai, and hence only Shanghai-Hong Kong Stock Connect is added to our analysis. Since Shenzhen-Hong Kong Stock Connect has already launched on December 5, 2016, the discrepancies between the two programs could be explored in the following study. Furthermore, the influence of stock market transparency on price disparity, as well as investor sentiment and idiosyncratic risk, will be investigated in future studies.
Footnotes
Acknowledgements
We thank several participants in various seminars for their nice feedback and suggestions. All possible remaining errors are ours.
Declaration of Conflicting Interests
The author(s) declared no potential conflicts of interest with respect to the research, authorship, and/or publication of this article.
Funding
The author(s) disclosed receipt of the following financial support for the research and/or authorship of this article: This project is funded by the research grant SM201910020003 of the Beijing Municipal Commission of Education. We gratefully acknowledge this support.