
Abstract
There is a generalized global market trend that tourists and consumers tend to pursue “themed” experiences closely related to their preferences or specific purposes. In the accommodation sector, the concept of “themed” is reflected by various theme hotels such as green hotels, family hotels, E-sports hotels, etc. In the era of Web 2.0, online information has been testified to be one of the most effective data sources for understanding customers and developing relative marketing strategies. Therefore, this research examined online customer reviews with both quantitative and qualitative methods to extract a range of variables reflecting customers’ experiences, and then, to explore their contribution to customers’ satisfaction/dissatisfaction with theme hotels; to understand theme hotels and develop novel insights for the industry, with new data sources. Moreover, a cross-cultural perspective was applied to examine the differences among different markets, so that more specific and targeted marketing strategies could be developed to develop and promote theme hotels. As a result, different clusters reflecting customers’ understanding of two areas have been applied. In addition, it was demonstrated that the connection between customer experience and satisfaction can be utilized to distinguish the differences between the two areas.
This research focuses on the growing trend in the tourism industry for “themed” experiences, where consumers seek accommodations tailored to their specific interests or purposes, such as green hotels, family hotels, and e-sports hotels. The study uses online customer reviews as a data source to better understand theme hotels and develop targeted marketing strategies. By analyzing these reviews both qualitatively and quantitatively, the researchers aim to identify the factors that contribute to customer satisfaction or dissatisfaction in theme hotels. Additionally, the research incorporates a cross-cultural perspective to explore differences among various markets and develop more specific marketing strategies for theme hotels. The study results reveal distinct clusters of customer cognition for the two areas examined, as well as the relationship between customer experience and satisfaction. These findings can be used to inform the development and promotion of theme hotels, ultimately catering to the evolving preferences of tourists and consumers worldwide.
Introduction
Hotels significantly influence the travel experiences of tourists by providing an array of services and amenities, such as dining options, spas, and recreational activities which could improve the overall experience of the tourists’ trip (Gursoy et al., 2015). Moreover, hotels are often among the largest expenditure for tourists, underscoring their importance in the tourism industry (Hu et al., 2021). Chen and Chen (2010) defined “Experience” as an individual’s personal, subjective emotions and responses while acquiring or utilizing a product or service. “Customer Experience” is an essential concept in the tourism and hospitality sector since the major products provided by the tourism and hospitality industry are services which are “experienced” by customers. In 1998, Pine and Gilmore postulated that the 21st century will be an era of “the experience economy.” Along with this trend, theme hotels which concentrate on providing diverse services for customers with entertainment value, have emerged (Hung et al., 2015). Zhang and Kim (2021) stated that due to market segmentation in the hotel industry, theme hotels have undergone a swift expansion and have emerged as one of the most appealing segments in the accommodation market during the last 2 decades.
As suggested by Xiang et al. (2015), hotel customer satisfaction in the hospitality service setting is a very complex and hard-to-evaluate human experience. Studies related to customer satisfaction were started in the 1970s, since it has been claimed that customer satisfaction plays an essential role in motivating customers’ behavioral loyalty, such as positive word-of-mouth, revisiting, or repurchasing (e.g., Hallowell, 1996; Hui et al., 2007). Additionally, measurement and management of hotel customer satisfaction are difficult tasks due to the complexity of the customer experience. Thus, for hotels to survive and flourish sustainably, it is essential to explore factors contributing to customer experience and confirm their importance to customer satisfaction (Xiang et al., 2017). There is no alternative for theme hotels, and it is crucial and fundamental to understand the factors that influence customer satisfaction (Sun et al., 2018).
Most scholars believe that theme hotels take a specific culture as the theme, create a specific cultural atmosphere based on the theme, are characterized by culture, difference, and experience to provide customers with a high-quality service experience. According to Hunt and Frankenberg (2015), due to the enormous success and impact of Disney cartoon movies, the hotels that were designed based on these cartoon series have become a preferred choice for families with children seeking themed accommodation options. It was suggested by Zhang and Li (2017) that previous studies of theme hotels generally focused on qualitative analyses of hotel architectural design, services, cultures, and development strategies, etc. However, the critical issue of customer experience and the factors that impact their satisfaction or dissatisfaction within the hotel industry have only been subjected to limited research.
Furthermore, big data such as online customer reviews from social media have been investigated for solving various problems in hospitality and tourism (Xiang et al., 2017) and these data formats combined with the relative analytics approach, emphasize, and leverage the capacity to collect and analyze data with an unprecedented breadth, depth, and scale, to solve practical problems (Mehraliyev et al., 2020; Yang et al., 2014). Specifically for the hotel sector, Hu et al. (2017) suggested a novel text-based summarizing technique for the development of the hotel industry with online customer reviews, Handani et al. (2022) examined 8,441 textual customer reviews from seven luxury hotels in the Marina Bay area. According to Tao and Kim (2020), studies using online reviews typically use a sample of textual reviews and related data (such as numerical ratings to show customers’ satisfaction level) of any size to extract features or measures that produce valuable insights for researchers to describe, detect, or predict patterns from the dataset.
More importantly, as investment in theme parks, vacation facilities, cultural facilities, and other entertainment industries in China continues to increase, the industry is poised to enter a new era of competition between international and local brands. Thus, to maintain the sustainable development of Chinese theme hotels and other tourism related industries, it is pivotal and instrumental to understand the differences between the well-developed theme hotels of USA and China. Collectively, to fill the research gap concerning the differences between the development of theme hotels in USA and China with insights from online customer reviews, this study was conducted by employing online customer reviews from two identical-brand hotels, that is Hong Kong Disneyland hotel and USA Disneyland hotel, to understand the differences to generate more targeted theoretical and practical implications for industrial development and promotion. Based on the research findings, industry operators may better understand their customers and ensure providing or upgrading their service to keep their customers satisfied. Specifically, different perceptions possessed by customers of these two hotels would be compared respectively by qualitative analysis and furthermore, factors contributing to customer satisfaction or dissatisfaction could be explored and testified by quantitative analysis. Overall, the study was conducted to answer the following research questions, (1) What cognition and knowledge could we determine from online customer reviews? (2) What factors reflect the customers’ experience of Disneyland hotels from online customer reviews and what are differences between these two areas? (3) What are the key dimensions contributing to customers’ satisfaction? (4) What are the variations in factors that lead to satisfaction or dissatisfaction between these two areas?
Literature Review
Big Data Analytics in the Hospitality Industry
The concept of “Big Data” was initially defined in 2001 by Doug Laney, who identified three primary characteristics known as the “3Vs”: Volume (size of data), Variety (different formats/structures of data), and Velocity (rapidity of data generation, modification, and transfer). Over time, this concept evolved additional dimensions: Value (extracting valuable knowledge from data) and Veracity (the governance of data with their reliability), resulting in the development of a comprehensive 5Vs framework (Bello-Orgaz et al., 2016; Gupta & George, 2016; Mariani & Wamba, 2020). Big data originates from various sources, including internet traffic (e.g., clickstreams), mobile transactions, user-generated content, social media, website behavior, and more (George et al., 2014; Xiang et al., 2015).
Big data analytics refers to methods employed to reveal hidden patterns and provide insights into significant relationships within contextual understanding by analyzing, processing, discovering, and presenting outputs. These techniques offer benefits such as cost reduction and timely effectiveness (Kim & Noh, 2019; Tao & Kim, 2019; Zhang & Kim, 2021). Recent studies have highlighted the diverse applications of online consumer reviews across various industries. Especially, regarding hospitality and tourism, big data analytics are commonly used to analyze online customer reviews which contain both written feedback and numerical ratings (such as star ratings) indicating the customers’ level of satisfaction. Online consumer reviews can be used to understand consumer behavior and construct market strategies (Liu et al., 2020; Tao & Kim, 2022), to evaluate the product and address potential problems (An et al., 2020), to explore the impact of online consumer-generated reviews on hotel booking intentions and hotel room sales (Sparks & Browning, 2011; Ye et al., 2009), and so forth.
Specifically, in the context of commercial accommodation like theme hotels, application of online customer reviews is still rare though (Zhang & Kim, 2021). However, prior studies (i.e., Guo et al., 2017; Li et al., 2018; Xiang et al., 2017, etc.) have been verified the great potential and abundant information contained in online customer reviews, especially in the context of the commercial accommodation industry. Therefore, valuable insights and knowledge for the advancement and theoretical underpinning of theme hotels could be obtained from online customer reviews, which are convenient research tools that extract information from customers without the constraint of predefined questions (Guo et al., 2017).
In summary, big data analytics emerges as a new and versatile research approach, encompassing not just one methodology but a range of analytical tools to extract insights from large datasets. This shift in perspective highlights the ability to make informed conclusions about reality by thoroughly analyzing vast data resources.Based on previous studies and the research purposes, the big data analytics performed in this research consists of text mining, semantic network analysis, and quantitative analysis (factor analysis and linear regression analysis).
Customer Experience and Satisfaction with Theme Hotels
Theme hotel refers to any lodging establishment that bases its tangible assets (design, decoration, facilities, amenities), staff, and intangible assets (such as service and unique activities) on a distinctive and powerful theme and provides a memorable experience for its customers (Wei, 2005; Xiao, 2012). In the fierce competition of the hotel industry, creating special hotel themes are essential to a marketing strategy, by building a socially constructed environment that conveys meanings by using symbolic motifs to attract customers (Wassler et al., 2015).
It is necessary to comprehend the factors or antecedents of hotel customer satisfaction since they have already been extensively examined in the literature on hospitality management (Xiang et al., 2015). Various studies in hospitality and tourism settings have attempted to understand the dimensions of experience, and dimensionality approaches to experience have been proposed, for instance, Knudsen et al. (2009) recognized the environment, accessibility, driving advantages, and incentives as the four elements of the customer experience in the hospitality industry.
Specifically for theme hotels, Wassler et al. (2015) conducted a qualitative study from the perspective of practitioners to comprehend the evolution of themes in the hotel industry, producing four analytical dimensions (the current state, perceived facilitators, inhibitors, and future prospective) for formulating marketing strategy in China. Zhang and Kim (2021) applied online customer reviews to explore dimensionality and satisfaction among customers of Hong Kong Disneyland hotel based on the analysis of online customer reviews and they postulated that Disneyland hotels are one of the important sectors of theming hotels with popularity from its Disney cartoon series. Additionally, according to their summary, the investigation of theme hotels with online customer reviews, especially for children and family-oriented theme hotels, was seldom processed previously.
Methods
Data Collection
This research was performed to compare the variations between Disneyland hotels in the United States and China, based on analytics of online customer reviews. In terms of data sources, for the Disneyland hotel in China, customer reviews from Hong Kong Disneyland hotel were selected, since between two Disneyland hotels in China, Hong Kong Disneyland hotel and Shanghai Disneyland hotel, the former is the first world-class theme park introduced to China and it has significance. There are three theme hotels in the Disney resort. Hong Kong Disneyland hotel is the second one which was opened on September 12nd, 2005. As for the Disneyland hotel of USA, it was selected as the Disneyland hotel in Los Angeles, California as one of the research subjects since this hotel is the only hotel with the name of “Disneyland Hotel” among three hotels in California. Therefore, reviews from these two Disneyland hotels were collected as data sources of this study.
Google Travel (https://www.google.com/travel/) which is a trip planning service developed by Google for the Web, was applied as a data source of data collection. The process of data collection was conducted by SCTM 3.0 which was developed by Wellness and Tourism Big Data Institute, Kyungsung University (Aralbayeva et al., 2018). Moreover, online customer reviews posted from Oct 1st, 2017 to 2021 were collected as data sources. The keywords “Disneyland Hotel” + “Hong Kong” and “Disneyland Hotel” + “California” were inserted into the system to collect respectively relative research data.
Data Analysis
When dealing with textual reviews in the form of text, it is instrumental to transfer the unstructured data into a structured format. Therefore, the text mining technique was utilized to divide textual reviews with the format of sentences modified into single word or phrases, with their corresponding frequencies. Furthermore, high frequency and close relationships with the research subjects were utilized to select significant words. As results, a total of 140 words (70 words for each hotel) were summarized. A word co-occurrence matrix (keywords × keywords) was generated by coding in RStudio to process the semantic network analysis of top-frequency words. UCINET 6.0 with Netdraw was performed to conduct semantic network analysis with Freeman’s degree centrality and Eigenvector centrality performed to demonstrate the semantic network of top-frequency words. In order to explore the subgroups of these words, CONCOR analysis was applied to procure different clusters reflecting customers’ preferences or interests. Lastly, dependency modeling was applied to generate factors contributing to customer satisfaction. Collectively, the differences between Disneyland hotels from China and USA were compared based on various facets of their top frequency words, semantic network, different dimensions generated by clustering analysis, and finally, factors impacting on customer satisfaction.
Results
Descriptive Statistics
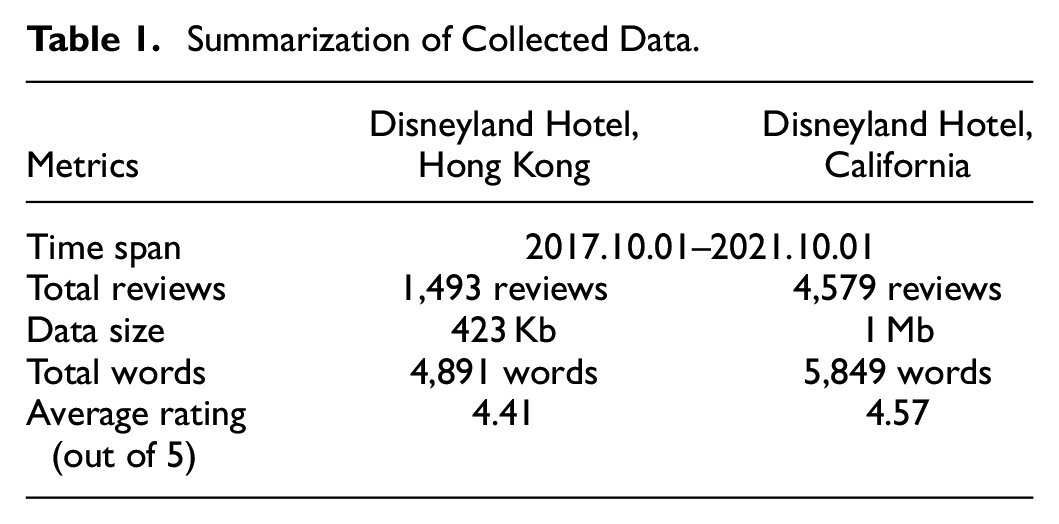
As for results, from the Hong Kong Disneyland hotel, a total of 1,493 reviews with 4,891 single words were collected. For the California Disneyland hotel, a total of 4,579 reviews with 5,849 words were gathered. The overall rating, representing customer satisfaction levels, was compiled, revealing that customers from California generally expressed slightly higher satisfaction with their stay compared to those at Hong Kong Disneyland hotel. Californian customers had an average rating of 4.57, which was 0.16 points higher than the rating of 4.41 for Hong Kong Disneyland hotel.The descriptive statistics of the two hotels were outlined in Table 1, revealing clear differences between them based on the data gathered.
Summarization of Collected Data.
Frequency Analysis
The 70 top frequency words were extracted for each hotel from online customer reviews, and they were identified in Table 2. Additionally, the frequency of occurrence and rank of these 70 words were illustrated. It can be seen that for Hong Kong Disneyland hotel, there is no surprise that the word “Hotel” had the highest frequency of 826 times, ranked at 1 followed by “Disney” (572 times), “Good” (481 times), “Room” (340 times), etc. In terms of California Disneyland hotel, words such as “Disney,”“Hotel,”“Great,”“Room,” and “Nice” were frequently used in customer reviews.
Comparison of Top 70 Keywords Frequency of Two Disneyland Hotels, Hong Kong, and California.

Comparing the top frequency words between Hong Kong and California, it could be found that words related to core products like “Room,” staff performance with words “Service,”“Friendly,” etc. were revealed in both hotels simultaneously. Specifically, the word “Kids” was found to have a very high frequency (237 times, ranked at 7) for Hong Kong Disneyland hotel which is different from California Disneyland hotel with “kids” ranking at 28. This implicitly suggests that customers with kids for family stays are the major guest group of Hong Kong Disneyland hotel. Additionally, words related to the dining experience of Hong Kong Disneyland hotel were found to be frequently usedin customer reviews, such as “Food” (242 times, ranked at 6), “Restaurant” (175 times, ranked at 11), “Buffet” (118 times, ranked at 18), etc. Expressions such as “Good food in their restaurants. A bit pricey which is expected with all Disney establishments,”“Food is very expensive—but worth it for the breakfast,” were collected. For California Disneyland hotel, the entertainment and amenities sections receive considerable attention from customers, as indicated by frequently mentioned words such as “Drink” (579 times, ranked 11th), “Night” (202 times, ranked 37th), and “Bar” (402 times, ranked 20th). Trader Sam’s bar stands out as a highlight of the hotel, with the words “Trader” and “Sam’s” appearing frequently and ranking highly in the word list. Many customers have mentioned this aspect in their reviews, expressing satisfaction with the service provided at this bar Customers posted reviews like “Beautiful hotel really close to the parks and has my favorite place for a drink- what more could I ask for?”“The staff is fun and entertaining the drinks are delicious and have a good kick. If you’re staying at the hotel you can get drinks to take back to your room or to the pool,”“Went to Trader Sam’s for drinks after a wonderful day in the park,” to express their feelings to the dimension of entertainment and amenities related to beverages provided by the hotel.
The histogram of the top 70 most frequently occurring words (Hong Kong and California, respectively) was plotted in Figure 1. As can be seen, the distribution pattern of frequency words of two the hotels are similar to each other with highly-skewed scores from left to right; for example, the proportional share of top 10 words (only one seventh of the top frequency words) among 70 words was 43.59% for Hong Kong Disneyland hotel and 46.52% for California Disneyland hotel.

Distribution of the most frequently used words in customer reviews.
Results of Semantic Network Analysis
According to Kim and Noh (2019), the semantic network analysis method was utilized to find and examine the relationships between nodes in a semantic network. Freeman’s degree centrality and Eigenvector centrality were used to investigate the hidden connections among nodes in the semantic network, that is, the analysis of the semantic network of Disney theme hotel customer reviews. Freeman’s degree centrality is a measure of the extent to which a node is directly connected to other nodes in the network. Eigenvector centrality is a measure of the influence of a node in a network. If a node has many connections with other nodes, it is suggested that this node in the network has a high Eigenvector centrality (Oh & Kim, 2020).
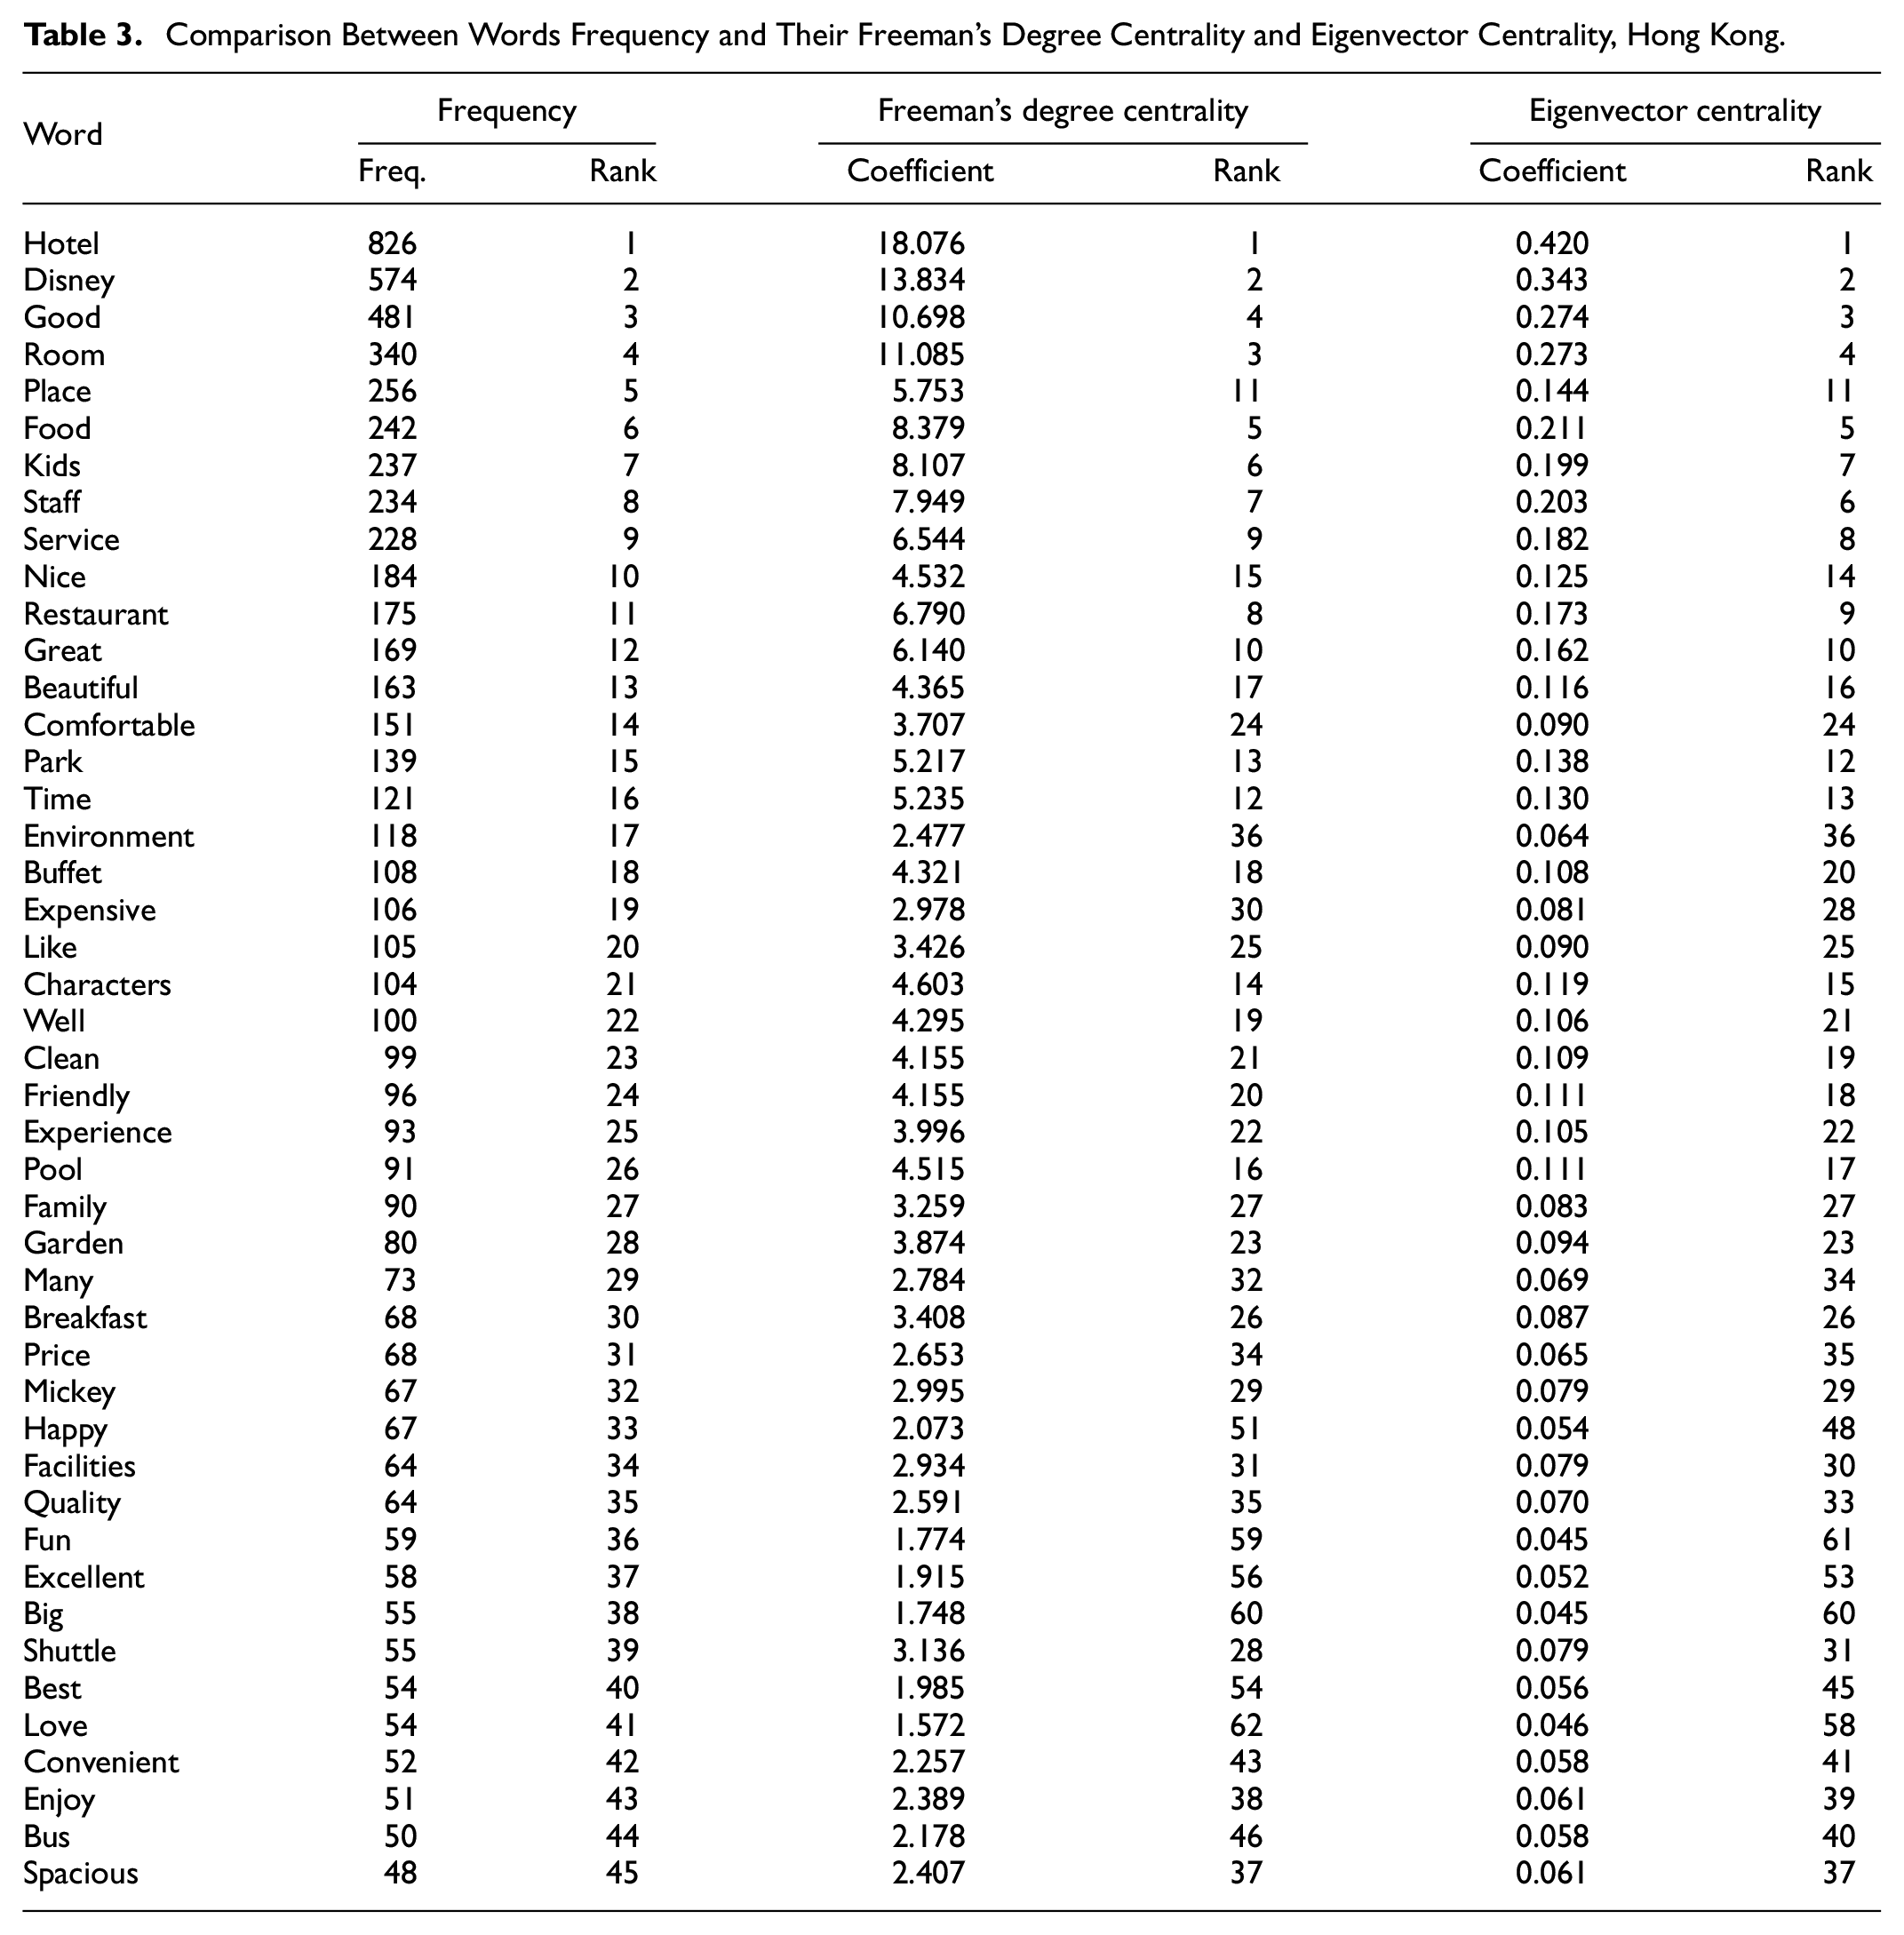
The results of centrality analysis for both hotels were summarized in Tables 3 and 4. The ranks of centrality coefficients were compared with word frequency. Generally, ranks of Freeman’s degree centrality and Eigenvector centrality were mutually similar while compared to word frequency, there are some obvious differences; for example, in reviews from Hong Kong Disneyland hotel, “Place” was used by customers 256 times, ranked at 5 while its Freeman’ degree centrality and Eigenvector centrality were ranked at 11, respectively. This may suggest that this place was frequently exposed in customer review. However, its connection and influence on other nodes in the network is relatively low. Searching back through the original reviews, it could be seen that the word “Place” is simply the alternative word for hotel itself, like “Relax nice food and family friendly! Great place for staycation!,”“A fabulous place for vacation and relief,” etc. Surprisingly, words like “Comfortable,”“Expensive,”“Happy,”“Fun,”“Excellent” showed the same distribution pattern with “Place” which is related to high frequency but relatively low centralities. In the meantime, these are all adjectives that show customers satisfaction level or their emotions about their staying experience. On the contrary, some words like “Spacious,”“Dinner,”“View,”“Lobby,”“Pool” showed low frequency rank but relatively high ranks of centralities. This showed that although these words were not frequently used in customer reviews, their links to and influence over other nodes were highly significant. Thus, to a great extent, dimensions related to amenities with the words “View,”“Pool,”“Lobby” and dining, with word “Dinner,” etc. were key dimensions reflecting customer experience and demonstrating their satisfaction.
Comparison Between Words Frequency and Their Freeman’s Degree Centrality and Eigenvector Centrality, Hong Kong.
Comparison Between Word Frequency and Their Freeman’s Degree Centrality and Eigenvector Centrality, California.

As for reviews from California Disneyland hotel, “Place” possesses the same distribution pattern as “Place” from reviews of Hong Kong Disneyland hotel which ranks with frequency but low ranks of centralities. Besides, words like “Fun,”“Best,”“Awesome,” etc. also shared the same distribution pattern as “Place.” Furthermore, words such as “Downtown,”“Pool,” were calculated to have high centralities but relatively low frequency. Specifically, some terms such as “Clean,” had relatively low frequency (ranked at 17) and Freeman’s degree centrality (ranked at 17), but its Eigenvector centrality ranked at 11. This showed that customers didn’t talk about “Clean” a lot in their reviews, and it’s not strongly connected to other parts of the network, but it does affect their satisfaction.Collectively, semantic network analysis and top frequency centralities taken together may help us uncover the relationships between words that are not immediately apparent and produce a more data-driven understanding of the meaning of words.
Results of CONCOR Analysis
CONCOR analysis was used to identify the blocks of nodes based on the correlation coefficient of the matrices of the current keywords and forms different groups which include similar keywords (Kim & Noh, 2019; Wasserman & Faust, 1994). The labeling process of each group was carried out by the authors and was determined by the significant words in each group. As a result, for Hong Kong, four clusters were generated which were “Transportation,”“Family Friendliness,”“Dining” and “Facility” and could be seen easily from Figure 2. Additionally, words in each group and significant words from individual groups were summarized in Table 5. In terms of California, four clusters “Entertainment,”“Family Friendliness,”“Dining” and “Facility” were extracted (see Figure 3) and relative words were described in Table 6.

Visualization of CONCOR analysis, Hong Kong, China.
Summary of Words Extracted from CONCOR Analysis (Hong Kong and California).


Visualization of CONCOR analysis, California, USA.
Result of Factor Analysis (Hong Kong).
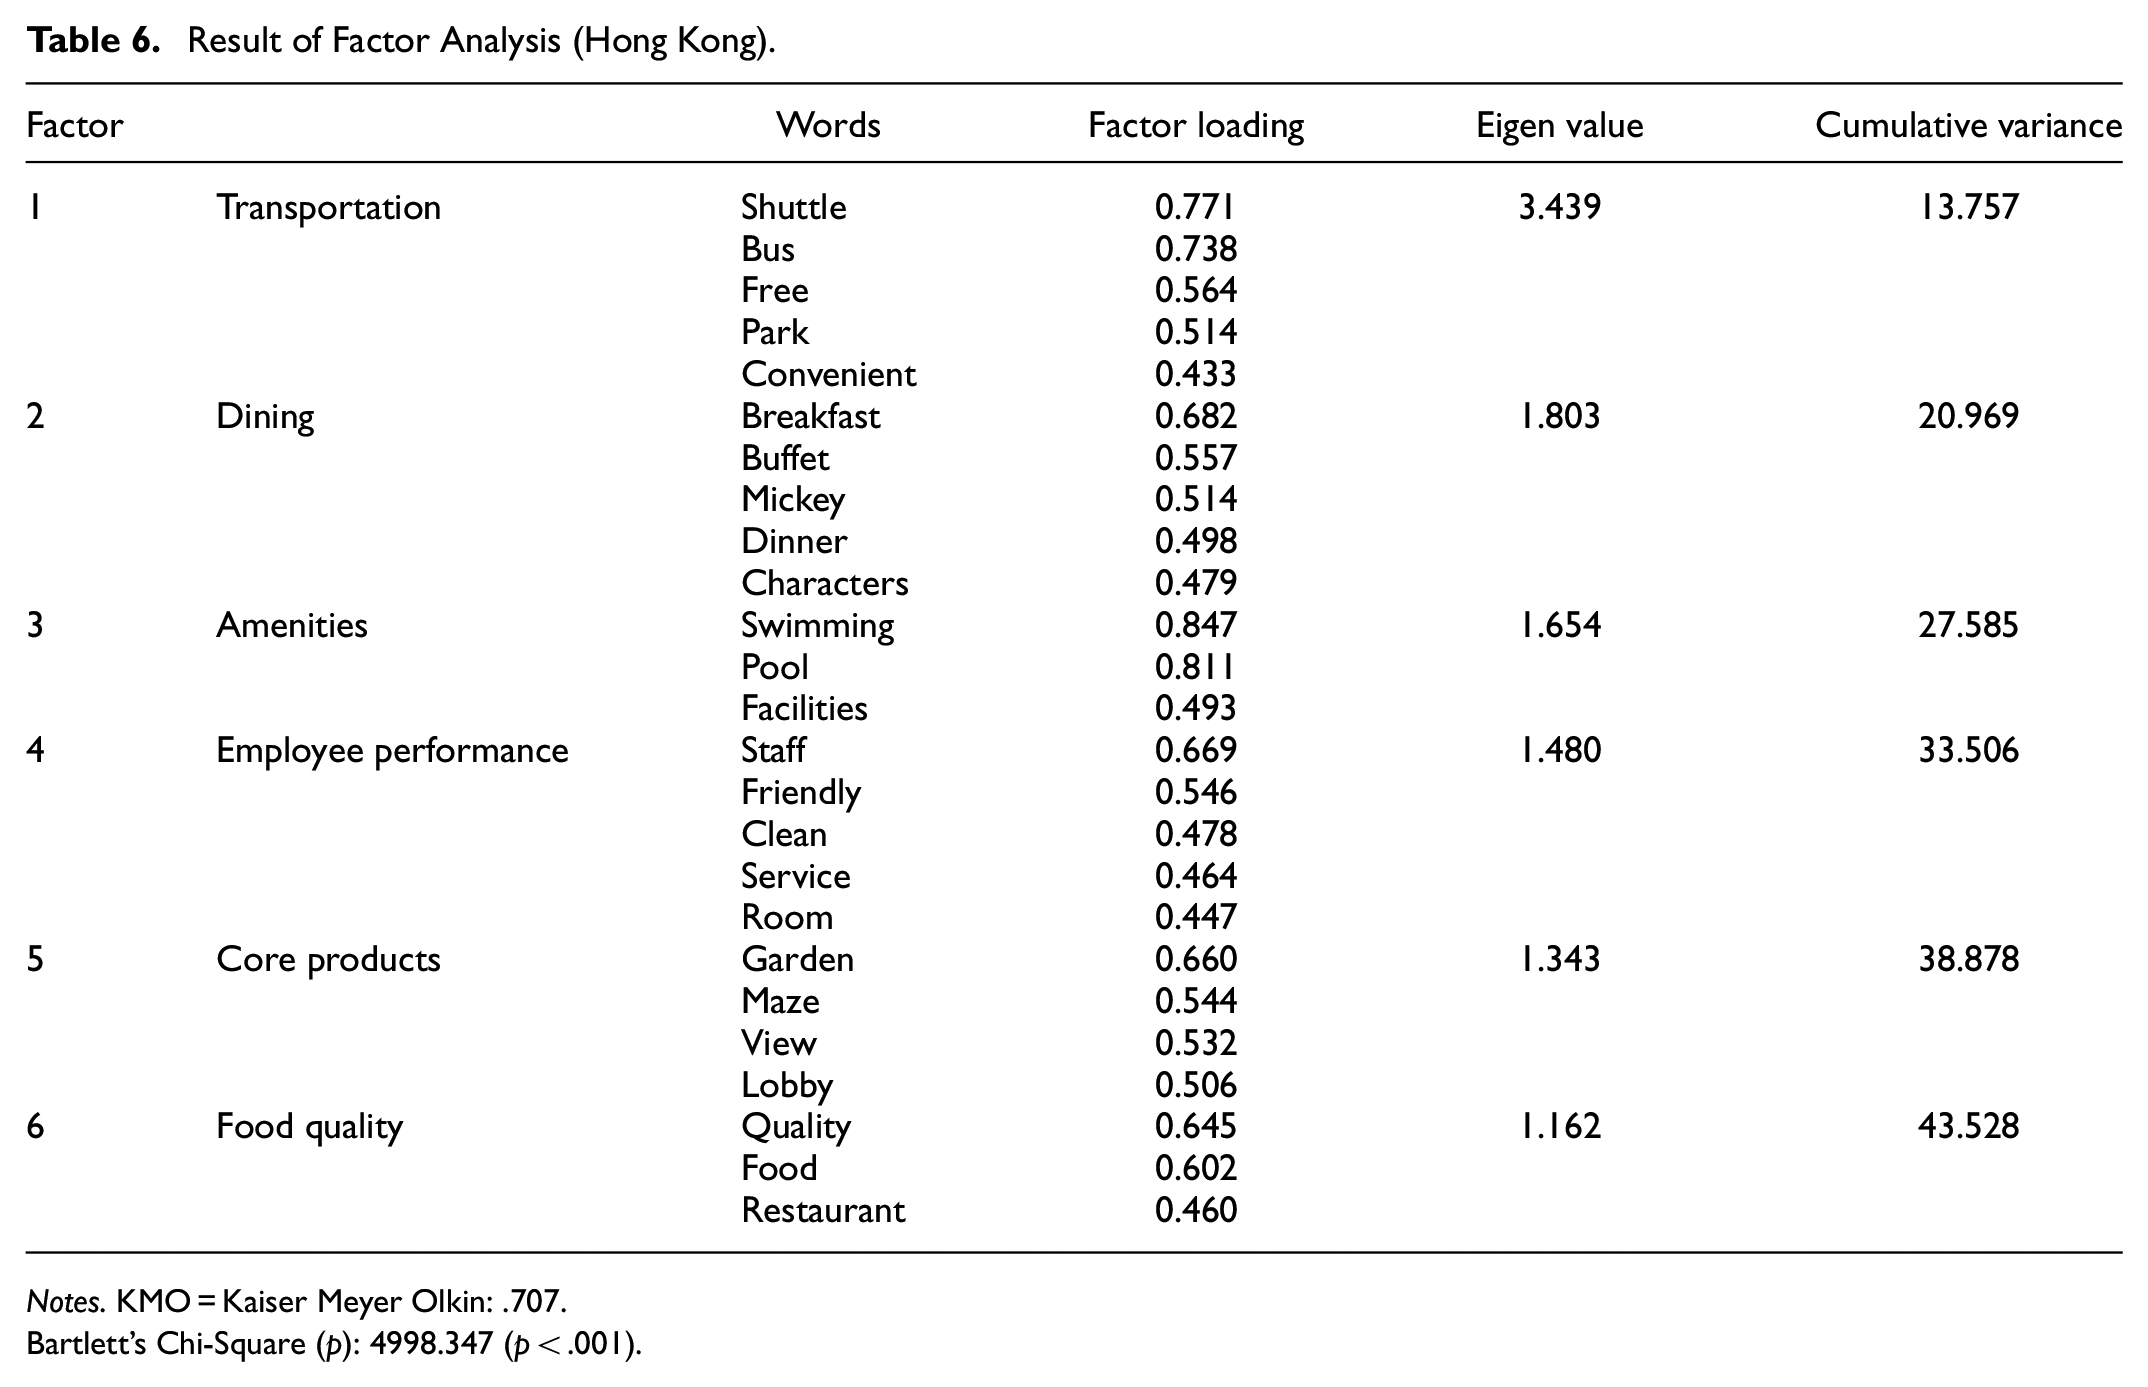
Notes. KMO = Kaiser Meyer Olkin: .707.
Bartlett’s Chi-Square (p): 4998.347 (p < .001).
To sum up, three clusters were the same both for Hong Kong and California while “Transportation” with words like “Convenient,”“Walk,”“Bus,”“Shuttle,” etc. was typical for Hong Kong, and “Entertainment” containing words such as “Atmosphere,”“Drink,”“Bar,”“Night,” etc. is specific for California. The difference related to this point could provide us with the general idea that customers of Hong Kong and California are concerned about different dimensions except the other three dimensions. For instance, among reviews from Hong Kong, reviews like “Bus shuttles go to the park all the time,”“…and the transportation is convenient,” etc. which are intimately associated with the transportation service at the hotel were mentioned frequently by customers.
Results of Quantitative Analysis
An exploratory factor analysis (EFA) with dummy variables was conducted firstly to extract factors reflecting customers experience as the words contained in the reviews (Table 5- “significant words”), would be coded as “1,” otherwise it would be coded as “0.” Next, a linear regression analysis was performed to examine the relationship between factors generated by EFA and customer satisfaction. Significant words extracted from the semantic network CONCOR analysis were analyzed by using a maximum likelihood method that was combined with Varimax rotation and Kaiser normalization (Kim & Noh, 2019). Only variables with factor loadings exceeding 0.400 were included in the final model, in accordance with conventional factorial criteria (Kaiser, 1974). Additionally, some factors listed in both groups were deleted. Consequently, in terms of reviews of Hong Kong Disneyland hotel, after six rotations, 25 words within 6 factors constituting 43.528% of variation were generated which were “Transportation,”“Dining,”“Amenities,”“Employee Performance,”“Core Products” and “Value for Money” (in Table 6). Meanwhile, the value of KMO is 0.707 (higher than 0.7) and Bartlett’s chi-square is 4998.347 with p < .001 and the appropriateness of applying factor analysis was justified. Overall, the conceptual framework to testify the association between customers’ experience and satisfaction was developed based on the EFA results and indicated in Figure 4.

Conceptual framework related to customers’ experience and satisfaction.
As shown in Table 7, “Dining” (β = −.012, p > .05), “Employee Performance” (β = −.022, p > .05), and “Core Products” (β = .041, p > .05) were testified to insignificantly affect customer satisfaction. While “Transportation” (β = −.054, p < .05) “Amenities” (β = −.073, p < .01), and “Food Quality” (β = −.095, p < .001) were examined to be significant but negatively associated with customer satisfaction which suggested that customers of Hong Kong Disneyland hotel tend to be dissatisfied with their experience in terms of “Transportation,”“Amenities” and “Food Quality.” More specifically, “Food Quality” had the highest standardized coefficient (negative), suggesting this aspect was the most important part impacting customer dissatisfaction.
Result of Linear Regression Analysis (Hong Kong).

Notes. Dependent variable: CS = customers satisfaction. R2 = .20; Adjusted R2 = .16; F = 4.969.
p < .05, **p < .01, ***p < .001.
As for California Disneyland hotel, 21 words within 5 factors constituting 40.261% of variance were extracted after 5 rotations. The KMO value is 0.660 (close to 0.7) which is acceptable and Bartlett chi-square is 7768.096 with p < .001 which confirmed the reliability of conducting factor analysis. It could be seen in Table 8 that five factors were extracted which are “Dining,”“Employee Performance,”“Core Products,”“Location” and “Bar.” Moreover, linear regression analysis was conducted to examine the relationship between these five factors with customer satisfaction, as shown in Table 9. The factors “Employee Performance” (β = .018, p > .05) and “Bar” (β = .011, p > .05) were insignificantly associated with customer satisfaction, factors “Dining” (β = −.049, p < .001), “Core Products” (β = −.047, p < .001) and “Location” (β = −.074, p < .001) significantly impacted on customer satisfaction. Surprisingly, these three significant factors were all negatively associated with customer satisfaction, indicating these dimensions were dissatisfied by customers. “Location,” with terms like “Park,”“Downtown” was found to be with the highest coefficient to explain customer satisfaction level while it negatively impacts customer satisfaction. Thus, to a great extent, suggested that the setting of park or location of this hotel can be improved a lot.
Result of Factor Analysis (California).
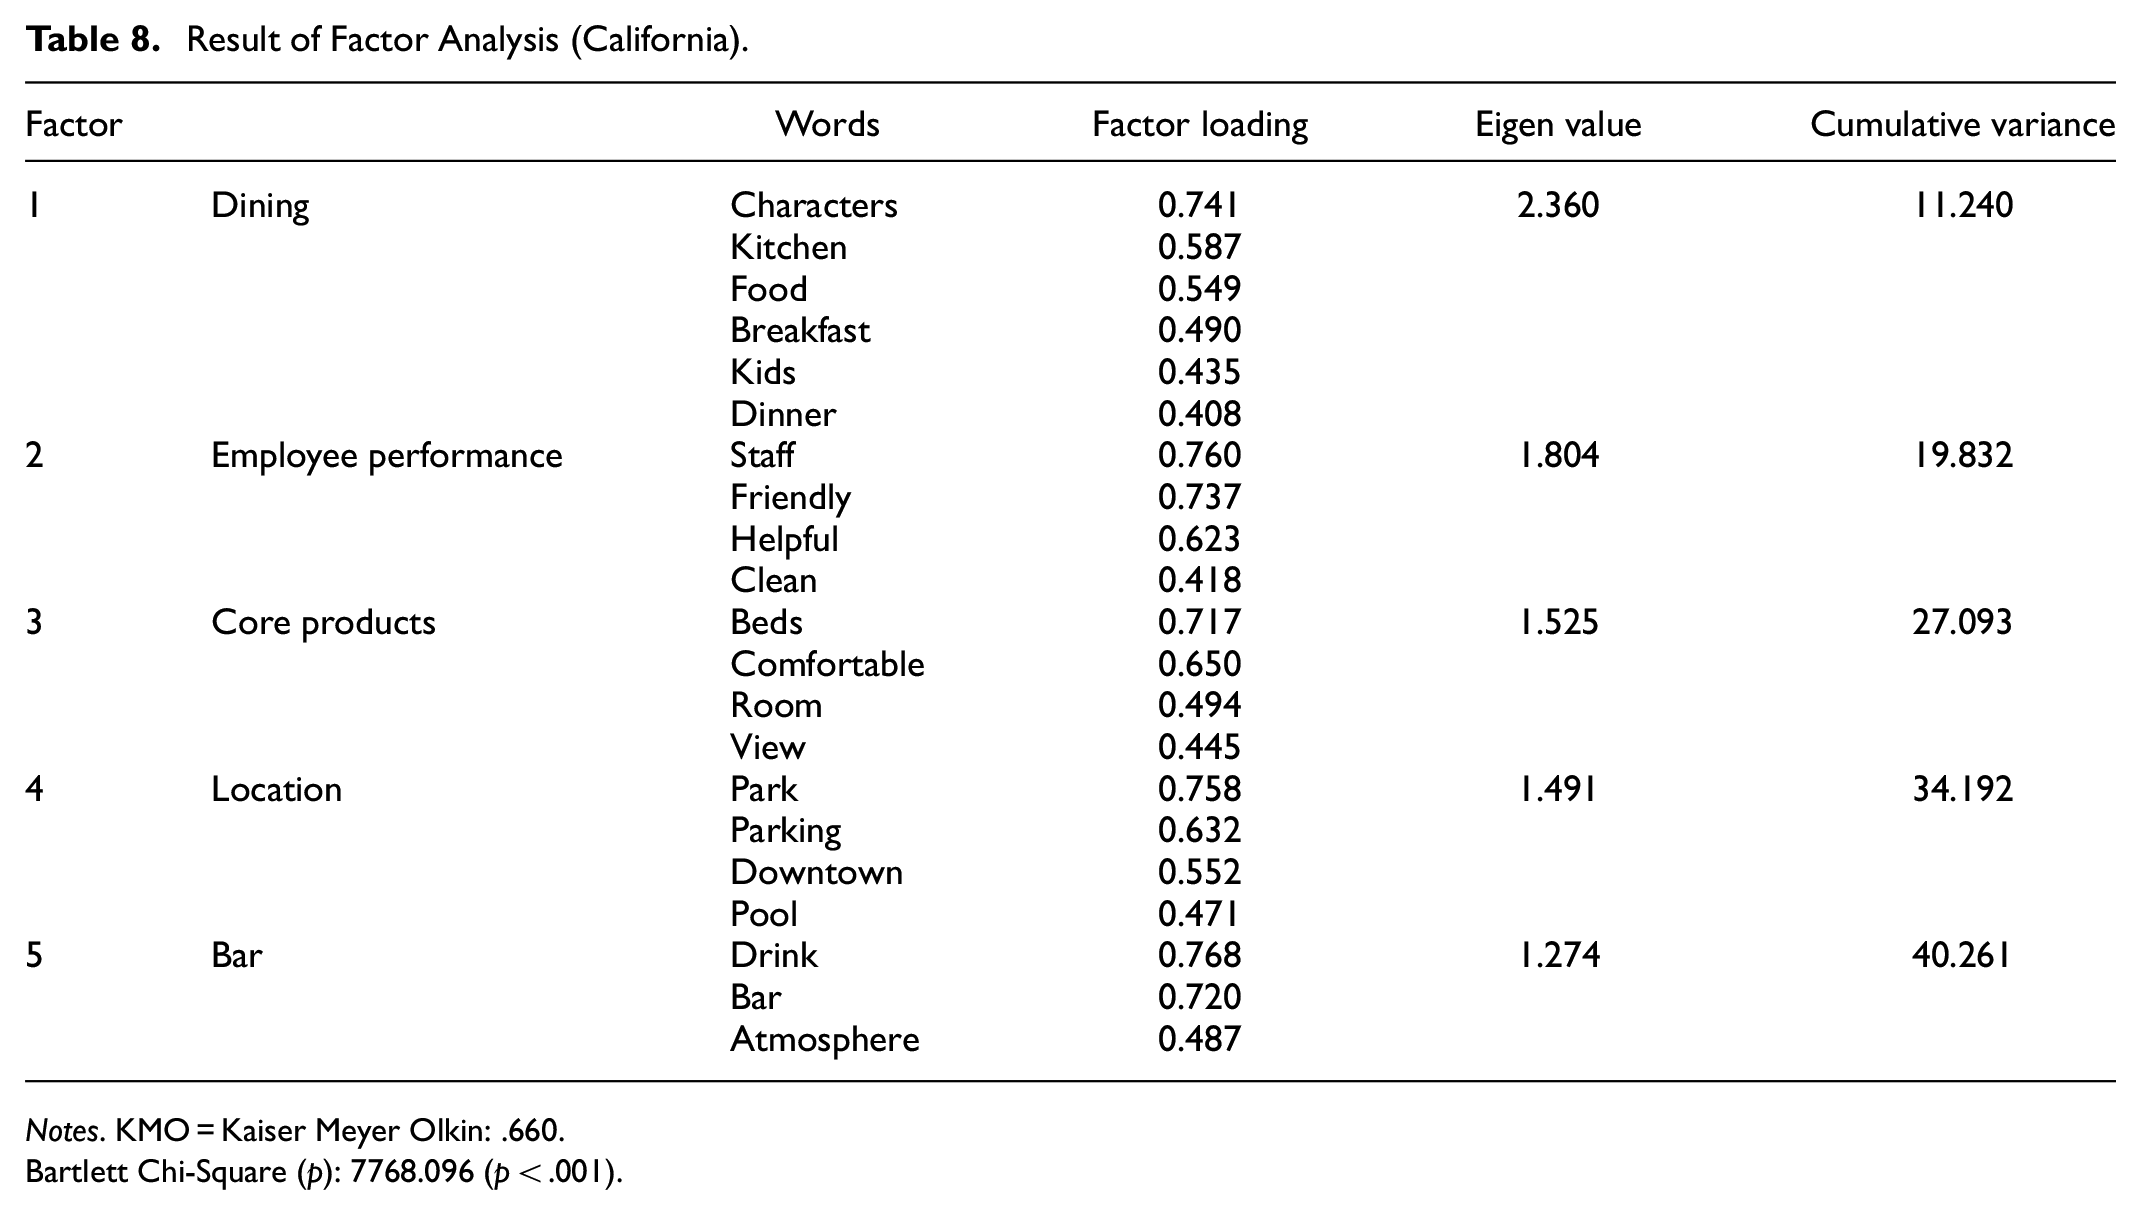
Notes. KMO = Kaiser Meyer Olkin: .660.
Bartlett Chi-Square (p): 7768.096 (p < .001).
Result of Linear Regression Analysis (California).
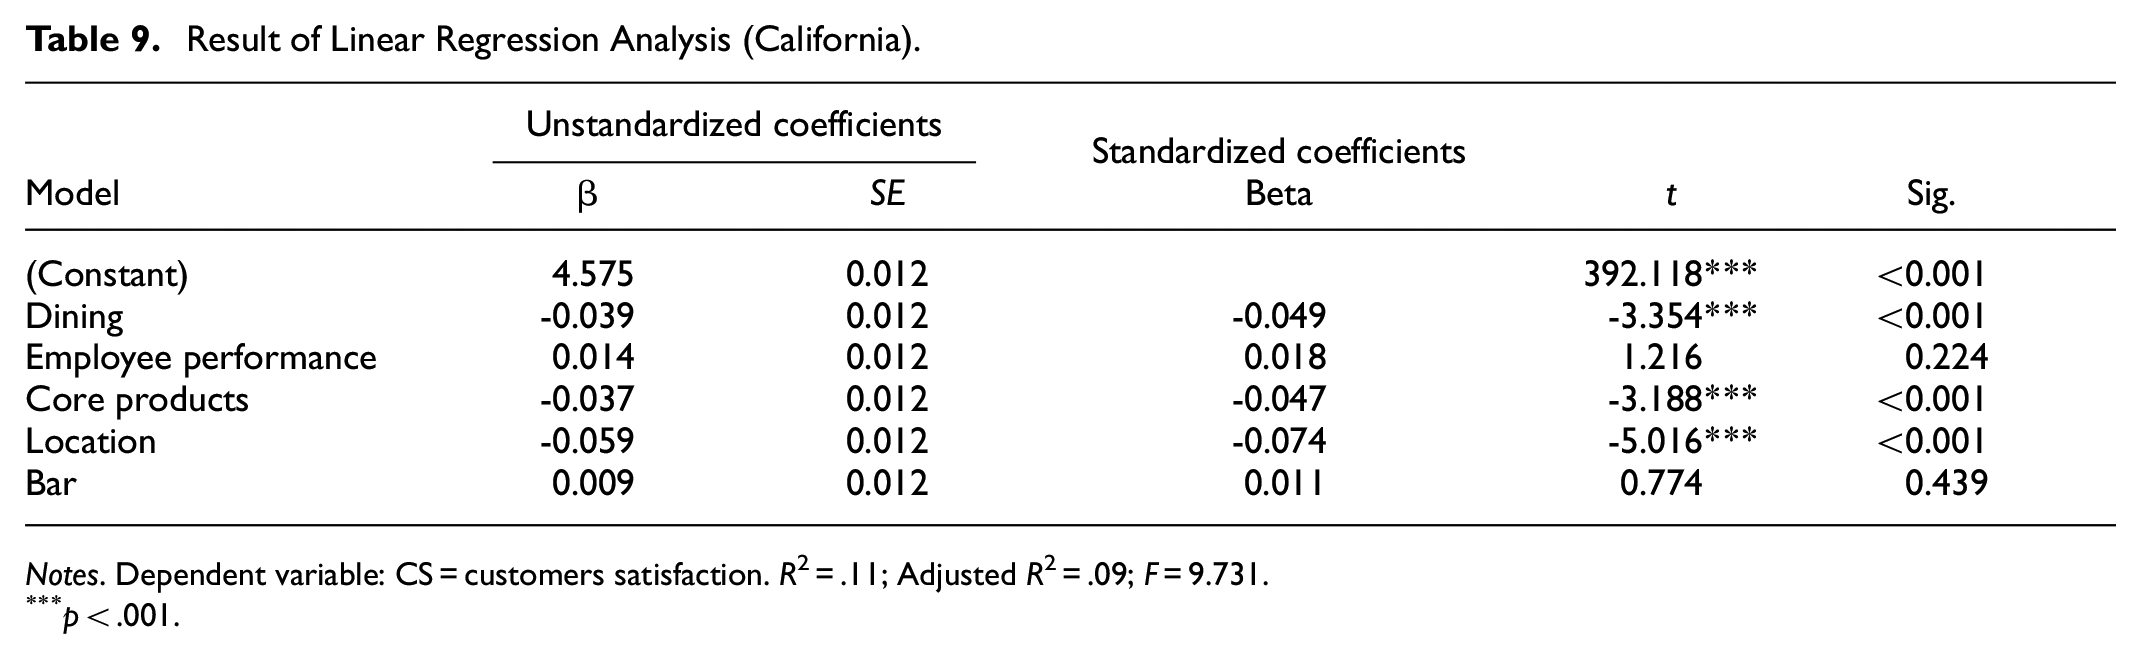
Notes. Dependent variable: CS = customers satisfaction. R2 = .11; Adjusted R2 = .09; F = 9.731.
p < .001.
Conclusions and Discussions
Conclusions
Online customer reviews have gained substantial popularity in the hotel and tourism industries, making it one of the most important data sources for academics and professionals trying to understand their clientele. This study collected online reviews from Google Travel by inserting keywords “Disneyland Hotel” + “Hong Kong”/“California” respectively to understand the differences in Disneyland hotel development between China and USA. As a result, a total of 6,072 reviews (1,493 reviews for Hong Kong and 4,579 reviews for California) were collected. After conducting the text mining process, a total of 70 very frequent and topic-relevant words were chosen for each hotel. It is not a surprise that words like “Room,”“Service,”“Staff,”“Restaurant,” etc. were frequently expressed in customer reviews, in line with other studies conducted with online customer reviews (e.g., Xiang et al., 2015, 2017) that core products, staff performance, factors related to dining or food ad beverage are key attributes reflecting hotel customers experiences.
Then, the extracted top frequency words were analyzed by the program of UCINET 6.0 to determine the value of their Freeman’s degree centrality, Eigenvector centrality and several distribution patterns were generated with which some words were of high frequency, while its connectivity to other nodes in the network were not that strong (e.g., comfortable, best, wonderful, etc.). Furthermore, different clusters were grouped for the two hotels respectively. “Dining,”“Family Friendliness” and “Facility” were explored for two hotels while cluster “Transportation” is typical for Hong Kong and “Entertainment” is typical for “California.” These obvious differences between Hong Kong Disneyland hotel and California Disneyland hotel could be caused by the early-establishment of California Disneyland hotel, therefore, the basic facilities and amenities of these hotels are well-developed and customers are satisfied with these dimensions already.
According to Maslow’s hierarchy of needs, once people feel secure, they tend to focus on social and self-esteem needs rather than leisure activities. This is reflected in the frequent mentions of “Drink,”“Night,”“Atmosphere,” and the name of a specific bar in the reviews of California Disneyland hotel, highlighting the importance of entertainment.
At last, after conducting quantitative analysis, three factors “Dining,”“Employee Performance” and “Core Products” were generated for both for two hotels while after performing linear regression analysis, for Hong Kong Disneyland hotel, none of the three factors were significantly associated with customer satisfaction and for California, “Dining” and “Core Products” were identified to negatively contribute to customer satisfaction. Additionally, “Location” was found to have a negative correlation with customer satisfaction. It is notable that for California Disneyland hotel customers that “Location” factor has the greatest and highest influence on customer satisfaction, although it has a negative impact overall. However, for Hong Kong Disneyland hotel customers, the factor of “food quality” has the greatest impact on customer satisfaction. This discrepancy has been mentioned in previous literature byPoon and Low (2005) stating that pricing, food, and hospitality were the three most influential factors affecting Asian customers’ satisfaction. However, security and safety, hospitality, and food were the three most important factors for Western customers.
Research Implications
Based on the research findings, implications provided by this study could be summarized into theoretical and practical perspectives. In terms of theoretical implications of this research, firstly, this study could be considered as one of the paradigms for processing online reviews both qualitatively and quantitatively since the process of data analysis performed in this study was valid and testified to be reliable. With this study, the area of customer experience research was testified to be instrumental in the setting of theme hotels. However, previous studies utilizing big data analytics or data source mainly concentrate on hotels, studies concerning theme hotels are still rare (Guo et al., 2017; Xiang et al., 2015). Therefore, by investigating the factors that impact customer satisfaction, this study enhanced our comprehension of customer behavioral intention with theme hotels. Hence, the study could contribute to the advancement and improvement of our knowledge in this field.
Secondly, a comparative study with online customer reviews was performed and instrumental implications were obtained, for future research to compare the differences between different products or services, online customer reviews would be used as one of essential data sources varying differences between qualitatively analytical result and quantitatively analytical findings. Similar to Tao and Kim’s (2022) study, which utilized online customer reviews to compare independent coffee shops and franchised coffee shops, aimed to explore their impact on customer satisfaction. Thirdly, differences found between Hong Kong and California Disneyland hotel could be a research project for further investigating differences among the development of theme hotels in China and the United States. The findings could offer valuable insights and recommendations for enhancing systems, service quality, and sustainable development in Chinese theme hotels (Lee et al., 2020).
Regarding the practical applications of this research, first of all, the process for assessing customers’ experiences and satisfaction in theme hotels based on online customer reviews was presented in this study. Consequently, operators can leverage this tool to gain deeper insights into their customers and enhance their understanding of their customers to maintain their revenue and improve their competitive competence. The results of CONCOR analysis and factor analysis could provide managers with aspects that customers are interested in, like “Transportation,”“Facility” for Hong Kong, “Entertainment,”“Dining” for California. These clusters and factors extracted from factor analysis are dimensions customers may, to a great extent, care about. Consequently, attention and more relative marketing strategies oriented to these dimensions should be paid and established. Especially, different factors were obtained for two countries, suggesting the focus of their customers was different.
In addition, differences between two hotels with the same brand could suggest that at different development stages, customers’ needs are also different. Thus, for the growth of the Disneyland hotel in both countries, the dissatisfaction factors from this study are supposed to attract attention. For instance, Hong Kong Disneyland hotel, as solving the problem of “Transportation,”“Amenities” and “Food Quality,” it is significant to prevent the factors like “Core Products,”“Location” and “Dining.” Furthermore, negative relationship between factors and customer satisfaction suggested that several factors are dissatisfied by customer, for instance, “Transportation” of Hong Kong implicitly suggested that managers should provide more convenient or free vehicles like shuttle, or bus to overcome the inherent shortcoming caused by the location of hotel. “Location” of California revealed that more attention should be paid to offset the disadvantage of its location by providing convenient transportation. Besides, the dissatisfied factors extracted from each hotel could be a warning point for the future development of mutual hotel. At last, since the abundant information contained in online customer reviews and clear cognition of customers to their experience and perceived satisfaction, managers or business operators are essential to perform relative online marketing strategies to deal with these feedbacks from customers. As suggested by Zhao et al. (2019) prompt online responses with a commitment to service improvement and compensation can be helpful to reduce the dissatisfaction.
Limitations and Suggestions for Future Research Development
At last, this research is subject to some limitations, and it is essential to deal with caution. Accordingly, related suggestions for future research were discussed as well. First of all, it’s crucial to note that the reviews gathered for this study were exclusively in English, with non-English reviews filtered out. This deliberate selection process inevitably constrained the volume of data available for analysis to some extent. Moreover, the difference between different language expressions and the hidden information caused by customers from different cultural backgrounds could be neglected. As for future research, it is crucial and vital to investigate reviewers’ different language expressions for a specific product or certain service so that the differences caused by reviewers could be explored (Liu et al., 2017). In addition, demographic characteristics of reviewers (e.g., gender, age, etc.) were difficult to collect and then were neglected these variables have been proven to be significant indicators for customer satisfaction by previous research, for example, gender differences showed by Karatepe (2011), the moderating effect testified by Ko et al. (2019) and so forth. Thirdly, some results of qualitative analysis are lack of objectivity since they are on the basis of researchers’ professionalism, processing, and coding, for example, labeling of each group of CONCOR results, elimination of irrelevant words, etc. Consequently, it would be more precise to adopt more-scientific or data-driven methods to lessen the subjectivity of analytical results.
Supplemental Material
sj-docx-1-sgo-10.1177_21582440241255827 – Supplemental material for Exploring Customers Experience and Satisfaction with Theme Hotels: A Cross-Cultural Analysis of Hotel Reviews
Supplemental material, sj-docx-1-sgo-10.1177_21582440241255827 for Exploring Customers Experience and Satisfaction with Theme Hotels: A Cross-Cultural Analysis of Hotel Reviews by Xiaobin Zhang, Jun Yu and Hak-Seon Kim in SAGE Open
Footnotes
Declaration of Conflicting Interests
The author(s) declared no potential conflicts of interest with respect to the research, authorship, and/or publication of this article.
Funding
The authors disclosed receipt of the following financial support for the research, authorship, and/or publication of this article: This work was supported by the Ministry of Education of the Republic of Korea and the National Research Foundation of Korea (NRF-2022S1A5A2A03052622).
Ethics
Our research does not involve ethical concerns related to animal or human studies, as it solely relies on publicly available data from online hotel reviews. This method of data collection does not require any intervention or interaction with human subjects or animals, and thus, there is no need for obtaining written consent from a local Ethics Committee or Institutional Review Board. We have ensured that our study complies with all relevant ethical guidelines and maintains the privacy and anonymity of the individuals who contributed to the online reviews.
Consent
In our study, we used publicly available online hotel reviews as our data source, which does not involve direct interaction with human study participants. Therefore, obtaining informed written or verbal consent from the participants is not applicable in this context. We have adhered to all relevant ethical guidelines and have ensured the privacy and anonymity of the individuals who contributed to the online reviews.
Supplemental Material
Supplemental material for this article is available online.
Data Availability Statement
Data sharing not applicable to this article as no datasets were generated or analyzed during the current study.
References
Supplementary Material
Please find the following supplemental material available below.
For Open Access articles published under a Creative Commons License, all supplemental material carries the same license as the article it is associated with.
For non-Open Access articles published, all supplemental material carries a non-exclusive license, and permission requests for re-use of supplemental material or any part of supplemental material shall be sent directly to the copyright owner as specified in the copyright notice associated with the article.