
Abstract
Understanding customers’ purchase intentions toward meal-sharing is critical for market expansion. The purpose of this study is to develop and validate a scale based on customer perceived value for measuring customers’ purchase intentions toward meal-sharing. This study analyzed 252 favorable reviews using a feature selection approach that derived seven attributes of customer recommendations. Customer perceived value measurement would be developed from the seven attributes. To explore and confirm the structure of measurements, exploratory factor analysis, and second-order confirmatory factor analysis were used. Using the random sampling method, the 437 respondents were asked to answer a researcher-made questionnaire. A structural equation modeling approach was used to test the hypotheses. Results showed that the multi-dimensional scale known as customer value scale (CVS) had good validity and reliability. The structural model confirmed that both utilitarian and hedonic values positively influenced consumers’ meal-sharing purchase intentions. Findings can be used as a reference tool for managers to evaluate and promote meal-sharing services.
Keywords
Introduction
Tourism is a labor-intensive industry (Hajiabadi et al., 2021; Nourbehesht & Mohammad Shafiee, 2020; Rezaei Hajiabadi et al., 2022). A downturn in this industry might jeopardize millions of jobs, threatening to halt a country’s progress. Because of the tourism industry’s importance, stakeholders may pay attention to changes in this sector (Mohammad Shafiee et al., 2018, 2021). Research has confirmed that the global tourist industry is currently undergoing substantial changes as a result of disruptive digital innovations, including changes in production, distribution, and consumption (Mohammad Shafiee et al., 2016; Mohammad Shafiee & Najafabadi, 2016). From this point of view, the changes in production, distribution, and consumption are highly related to the sharing economy concept.
The sharing economy is a socioeconomic system in which individuals work together to develop, produce, distribute, and consume commodities and resources (Tussyadiah & Pesonen, 2016). The tourism industry’s sharing economy can be divided into four categories: transportation (e.g., Uber), tour guide services (e.g., Vayable), accommodation (e.g., Airbnb, Couchsurfing, and Homeaway), and dining (e.g., Eatwith) (Ert et al., 2016). Meal-sharing is a dining service in which local hosts cook meals for customers and share their cooking knowledge (Mhlanga, 2020). The idea of meal-sharing differs from food sharing. Food sharing is a compelling case for sustainable development because it aims to reduce waste generation while also providing nutrient-rich food to those who are socially excluded (Morone et al., 2019). Dining at home with hosts provides customers with unique and authentic food experiences (Sotiriadis & Nduna, 2019). It is a great opportunity for tourists to enjoy the hospitality, social interactions, and local culture.
Several meal-sharing startups, such as EatWith.com, have provided services between hosts and travelers on their websites. While meal-sharing websites compete for customers, hosts are oblivious to how to provide their services to new customers (Atsız & Cifci, 2021b). In fact, many meal-sharing providers have little information about their customers, particularly how much value they perceive (Lin et al., 2022). How to attract customers has become a challenge for hosts due to a lack of practical marketing knowledge in the meal-sharing business.
Potential customers, on the other hand, believe it is difficult to evaluate meal-sharing offers due to a lack of information because foods cannot be tasted prior to purchase (Martin-Fuentes et al., 2018). As a result, potential customers’ desire to participate in meal-sharing may be diminished. Previous research has found that consumers’ purchasing decisions on products or services are frequently influenced by perceived value (Siering et al., 2018; Xu et al., 2017). Similar to meal-sharing services, potential customers may learn from someone else’s comments when making purchase decisions (Bashir et al., 2018). Customers’ motivations (Ketter, 2019) and experiences (Atsız et al., 2022) influenced their purchasing decisions, according to research on meal-sharing consumer behaviors. Recommendations from previous customers may easily persuade potential customers. However, customer perceived value has not been addressed in the meal-sharing literature.
To better understand the role of value in predicting potential customers to accept meal-sharing, two questions are asked: (1) How can the perceived value of meal-sharing among customers be measured? (2) Can a customer’s perceived value influence their purchase intentions? It is assumed that experienced customers’ recommendations can include customer perceived value, and that value influences the decisions of potential customers as well. Based on this assumption, the purpose of this study is to develop a scale of customer perceived value and validate how it correlates with potential customers’ purchase intentions for meal-sharing.
The findings of this study broaden the meal-sharing literature and practices in the following aspects. First, the verified customer value scale can be used as a managerial instrument for assessing customer value toward meal-sharing. Second, key attributes extracted from customer recommendations serve as a benchmark for customer loyalty programs and brand equity. Third, customer perceived value can be used to forecast prospective customers’ intentions to purchase meal-sharing.
Literature Reviews
Customer Recommendations as Value Endorsement
When someone recommends something to someone else, it implies that they have a strong opinion about it. A recommendation is the recommender’s enthusiastic declaration that others will enjoy the same thing (Siyal et al., 2021). The source of recommendation could be from experienced customers. Future consumers look for signs of customers when deciding whether to choose a service (Tsao, 2014), and rely on the advice of more experienced customers who are aware of more cues than they are (Sardar et al., 2021).
Customers who are satisfied are more likely to return and to spread favorable word-of-mouth (recommendations) to others. Negative word-of-mouth from disgruntled consumers, on the other hand, can be disastrous to a firm (Roozen & Raedts, 2018; Siering et al., 2018). Positive or negative word-of-mouth is a crucial element in influencing the amount of new business. This is especially true for services that rely largely on word-of-mouth to generate new customers like meal-sharing which highly depend on new customers.
An recommendation mirrors to endorsement because, according to the Oxford Dictionary (Oxford Dictionaries, n.d.) An endorsement is a public remark or action indicating your support for someone or something. An endorsement is when a customer is satisfied enough with something to recommend it to others, such as “I recommend this one” (Packard & Berger, 2017). According to (Seno & Lukas, 2007), There are four different kinds of endorsements: imperative (“You should use this service”), implicit (“I use this service”), co-presentational (“I simply appear with the service”), and explicit (“I endorse this service”).
Following the logic, customer recommendations act as value endorsement which have some implications to the business side. A willingness to recommend is one of the best indicators of repurchase (Xu et al., 2017), which boosts brand equity (Chakraborty & Bhat, 2018). As a result, recipients may interpret the sender’s willingness to recommend a product or service as endorsement that (s) he has a particularly positive opinion of the good/service in question.
Customer Perceived Value
Customer perceived value has received a lot of attention from service marketing researchers in the last few decades because more customers have become value-driven (El-Adly, 2019), and because it is the antecedent of many behavioral outcomes such as patronage, re-patronage intention, customer satisfaction, and customer loyalty (Z. Chen & Dubinsky, 2003). Over time, the notion of customer perceived value has evolved. However, the concept of “value” used in this study is “all variables, qualitative and quantitative, subjective and objective, that make up the full consumer experience” (Zeithaml, 1988).
According to (Heinonen, 2004), customer perceived value is generated by the trade-off between benefit and sacrifice. Many of the conceptualizations include quality as a benefit and price as a cost. According to (Cronin et al., 1997), According to Heinonen (2004), customer perceived value is generated by the trade-off between benefit and sacrifice. Many of the conceptualizations include quality as a benefit and price as a cost. According to Cronin et al. (1997), the perspective of value taken is either a multiplicative or additive function of gain and sacrifice. In the first instance, value was defined as the ratio of benefit (numerator) to sacrifice (denominator). The additive model acknowledges the integrative nature of benefit and sacrifice and denotes the compensatory trade-off between benefit and sacrifice.
The benefit and sacrifice value paradigm are relevant, however it is not applied in this study. In many ways, the benefit and sacrifice components do not signify cognitive-affective sources with rational and emotional dimensions. In contrast, this research argues that, while admitting the relationship between service value and cognitive-affective nature (Ahn & Kwon, 2020; Sánchez-Fernández & Iniesta-Bonillo, 2007; Sweeney & Soutar, 2001), cognitive-affective nature can be used to conceptualize perceived service value.
However, cognitive-affective nature was defined as a single-dimensional construct in P2P research (Aruan & Felicia, 2019; C. C. Chen & Chang, 2018). On the other hand, the dining experience is influenced by a variety of factors such as food quality, service, social contacts, emotions, and so on. Dimensionality of customer perceived value to meal-sharing needs further investigation. Later studies assessed perceived value based on utilitarian and hedonic perspectives (Liu et al., 2021). The utilitarian elements refer to functional and task-related and rational consumption behavior, whereas hedonic processing of pleasure, pain, and displeasure is necessary to motivate behavior and has a strong influence on decision-making (Babin et al., 1994; Mohammad Shafiee & Es-Haghi, 2017; Noorani Kootenaee et al., 2021). Although many used hedonic and utilitarian values in P2P studies, none incorporated them to identify customer perceived value as a multidimensional construct in the meal-sharing setting. Developing context-specific measurements for customer perceived value is thus in demand.
Customer Perceived Value and Purchase Intention for P2P Services
The likelihood that a consumer will buy something is referred to as purchase intention (Zeithaml et al., 1996). Among the factors influencing someone’s purchase decision, a customer’s purchase intention is critical for predicting his or her actual purchasing behavior. A customer’s purchase intention may or may not become a real purchase depending on a variety of factors such as shifting motivations, needs, purchasing or consuming circumstances, new information, or the availability of desired alternatives. These factors may also impede or otherwise affect the process, influencing the customer’s decision (Ariffin et al., 2018; Mohammad Shafiee & Rahmatbadi, 2015; Mohammad Shafiee et al., 2016; Tabaeeian & Mohammad Shafiee, 2023).
In P2P services, previous research discovered a link between customer perceived value and customer intention to share a room (J. Wu et al., 2017). Fauzi & Sheng (2020) found that utilitarian and hedonic values positively influenced ride-sharing purchase intentions. Zhang et al. (2019) observed that high customer perceived value increased the likelihood of a user acquiring a P2P service. Other research has discovered that utilitarian and hedonic values influence consumers’ intentions to purchase P2P services (S. Lee & Kim, 2018; Kozlenkova et al., 2021). According to previous findings, the more positive customers’ perceptions of a P2P service, the more likely they are to purchase it.
Research Methods
The empirical method employed was divided into two stages. The first stage adopted a feature selection approach to extract the salient attributes of customer recommendations from online customer reviews of meal-sharing. Key attributes serve as dimensions of customer perceived value. The second stage developed measurements for each dimension and established the scale’s dimensionality. Finally, the correlation between customer perceived value and purchase intention in the meal-sharing context was investigated using the validated scale.
The First Stage: Identifying Key Attributes of Customer Recommendations
According to utility theory, customers purchase bundles of attributes that collectively represent a product or service of a certain level of quality at a cost in order to obtain utility (Lancaster, 1971). Customers’ perceptions of the value of a product or service attribute influence utility (Xu, 2019). Customers recommend that others join that meal-sharing service if the value of the attributes is worthwhile (Al-Ansi et al., 2019).
To extract salient attributes from online customer recommendations, a feature selection approach was used to extract salient attributes from online customer reviews, which included the following steps: collecting online customer reviews and cleaning the data, generating TF-IDF, applying LASSO, labeling extracted attributes, and selecting key attributes as dimensions of customer perceived value construct (Figure 1).

Steps in the stage one.
Data Collection
The online customer reviews were gathered from a meal-sharing website called Eatwith.com (https://www.eatwith.com/). Eatwith is the world’s largest marketplace for meal-sharing services, providing a platform for food entrepreneurs to profit from their art at this stage (Atsız & Cifci, 2021a). Customers must provide overall ratings ranging from 1 to 5 stars on Eatwith.com. The rating reflects the entire review content to distinguish between the positive and negative sentiment of their recommendations. A negative review is represented by 1 to 3 stars, while a positive review is represented by 4 and 5 stars (Atalık et al., 2019).
The online customer reviews for Eatwith were collected by a crawler from import.io (https://www.import.io/). Customer reviews for 35 meal-sharing hosts in Barcelona, London, and Paris from May 2013 to June 2022 were collected. After data cleansing, 252 reviews with the keywords “recommend, recommended, or recommendation(s)” were retained from the 1,532 online posts screened. These keywords provided an indication of why customers endorsed and recommended the services to others. To maintain topic focus, irrelevant reviews or comments were removed. The binary mode (zero and one) is often used by the least absolute shrinkage and selection operator (LASSO) method, which is more precise and powerful than the continuous-dependent mode (Dastjerdi et al., 2019). In this study, the binary approach was used to express whether customer recommendations were positive or negative.
TF-IDF Generation
The sentences in the screened online customer reviews were broken down into individual words based on their frequency using a Term Frequency-Inverse Document Frequency (TF-IDF) technique performed with RapidMiner Studio®. TF-IDF is a statistical measure that evaluates how relevant a word is to a document in a collection of documents (Salton & Buckley, 1988). The notion behind TF-IDF is derived from language modeling theory, which states that terms in a document can be divided into two categories: useful words and useless words (Robertson, 2004), that is, whether a term is related to the topic of the document. The TF-IDF formulation is used to estimate the relevance of a word in the document collection in order to estimate its usefulness for a given document (Zhao et al., 2021). The TF-IDF function is defined below.


In equation (1), N is the total number of documents and ni is the frequency of term i in the total number of documents. In equation (2), tfij denotes the number of occurrences of term i in document j, whereas idfi denotes the overall significance of term i in the total number of documents. The TF-IDF metric multiplies the two variables tf and idf. This method was used to determine which words appeared the most in a review. As a result, a term with a high TF-IDF score appears frequently in a document (Sebastiani, 2002).
The texts were restructured into lowercase letters during the TF-IDF operation using a tokenization process that removed symbols, unrelated characters, punctuations, and emoticons such as “from,”“that,” and “this.” This procedure prevents words with fewer than three letters from conveying insufficient information, such as “in,”“at,”“to,” and so on. Non-letter separators are used to divide the comments into discrete parts to tokenize the text. The token was further purified using a stem approach; for example, “beautifully” and “beautify” are refined into a collective token “beauty,” representing the meaning of similar words. Segmenting corpus with a bigram model when two terms are frequently found together in the document, such as “delicious food” and “beautiful design.” Words that appeared less than five times in the corpus were ignored to obtain more essential words. As a result, a TF-IDF consisting of 793 selected keywords in 252 samples was constructed for measuring customer reviews.
Feature Selection Using LASSO
After the TF-IDF was established, LASSO regression was used over regression methods for a more accurate prediction. The Least Absolute Shrinkage and Selection Operator (LASSO) is a function that combines regression and feature selection to extract relevant features based on the selection criteria shown in equation (3), where x is the explanatory variable, T is the number of data points, and is the adjustment coefficient (Tibshirani, 1996).

In equation (3), when the value of λ is gradually increased from 0, the independent variable x, which is strongly correlated with yt, will change and differ from 0, indicating that the explanatory variable is significant. As a result, if one of the input variables has a coefficient that is greater than zero, it is considered an important factor. The ultimate goal of reducing variables to zero is to identify the feature subset that has the lowest prediction error for the variable (Tibshirani, 1996).
LASSO generates a more refined model by generating a valve function, decreasing the sum of coefficients using the square of the least square approach, and compressing the sum of absolute coefficient values to less than the constant (W. Wu & Riantama, 2022). LASSO has several advantages. First, LASSO is used to reduce the variation of the slope coefficients without significantly increasing the bias (C. Y. Lee & Cai, 2020). Reduce the dimensionality of the production model to reduce the estimator’s variance. Second, LASSO chooses fewer variables to improve the predicted function’s accuracy and reduce over-fitting (Elyasiani et al., 2019). LASSO, on the other hand, has one drawback: it can only capture linear relationships (He et al., 2019). It is important to remember, however, that linear and nonlinear models have trade-offs. Linear models may fail if they are unable to capture nonlinear relationships. Calibration of nonlinear models is difficult due to the small number of samples.
Previous research has demonstrated that LASSO outperforms other regression algorithms like decision trees (DT) and support vector machines recursive feature elimination (SVM-RFE). J. R. Chang et al. (2020) discovered that LASSO outperforms SVM-RFE in determining the most important factors influencing customers’ trust in an O2O topic. W. K. Chen et al. (2021) compared LASSO to Chi-square in selecting the most important characteristics of live streaming views and found that LASSO was more accurate than Chi-square. LASSO was performed using Matlab® software in this study. Results of LASSO showed 17 extracted key words in Table 1.
LASSO’s Results.

Cross-Validation
Cross validation is used to classify the significant keywords based on their frequency of occurrence. According to (W. K. Chen et al., 2021), the more times a keyword appears in the dataset the more important it is. When the amount of training data is limited, J. R. Chang et al. (2020) suggested using a five-fold cross-validation method. The keywords were classified based on their frequency of recurrence in five-time experiments. The most important keywords by randomly partitioning the sample data were set into five mutually exclusive subgroups, with one subgroup subset serving as a testing subset and the other four as training subsets, and it was run in turn. Accordingly, five-fold cross-validation was used in this study to rank the keywords based on their frequency of occurrence. Table 1 summarizes the keywords based on their frequency of occurrence resulting from the five-fold cross-validation experiment. According to the findings, there were two groups that had five and four appearances with a coefficient greater than zero in LASSO operation (Tibshirani, 1996).
Keywords Association
The next step is to interpret the keywords in their respective groups. To reduce subjectivity in word labeling, important keywords with comparable meanings and objectives were grouped together. After categorizing and grading the words based on their frequency of occurrence, the following terms were discovered to be meaningfully significant: “food’s history telling,”“delicious & unique meals,”“money’s worth,”“friendly hosts,”“fun atmosphere,”“number of guests,” and “creative decoration.” However, there were a few irrelevant words that existed. The first group had three meaningless keywords (I_love, we_were, and given), while the second had two meaningless keywords (seat and I_was). After removing the irrelevant words, the computational attributes extraction was completed, as shown in Table 2.
Key Attributes of Customer Recommendations.

Transforming Key Attributes into Dimensionality
Customers’ reviews are not only thoughtful expressions of their feelings, experiences, evaluations, and emotions, but they are also critical references for potential customers to evaluate the value of a product/service (W. K. Chen et al., 2020). Accordingly, the extracted key attributes of customer recommendations are equivalent to candidate dimensions of customer perceived value. Extracted terms in customer reviews such as welcoming, knowledgeable, history, and so on can be utilized as sources for designing measurements (Table 3).
Dimensions of Customer Perceived Value.

The Second Stage: Validating and Applying Customer Value Scale
Based on the findings of the previous stage, this stage utilized an empirical methodology to validate the customer perceived value scale and applied this scale to examine prospective consumers’ purchase intentions for meal-sharing. As depicted in Figure 2, the second stage included the development of hypotheses, instrumentation, pilot research, data collection, and data analysis.

Research steps for the second stage.
Development of Scale and Hypotheses
To measure customer perceived value for meal-sharing, seven dimensions derived from key attributes of customer recommendations were proposed. These dimensions were linked to hedonic and utilitarian values, which are synthesized propositions of customer perceived value adapted by several studies (Oliver, 1999; Sánchez-Fernández et al., 2009). Furthermore, it was hypothesized that hedonic and utilitarian values would influence customers’ meal-sharing purchase intentions. Figure 3 shows the proposed research framework.

Research framework.
Previous research has shown that customer perceived value has multiple dimensions (Liu et al., 2021). In this study, customer perceived value is proposed as a second-order construct including utilitarian value and hedonic value. Three dimensions related to task performance of a service contained in utilitarian value could exist, according to seven dimensions extracted from customer recommendations, namely sacrifice, offering availability, and physical environment. The hedonic value may encompass four other aspects of service enjoyment including history telling, host friendliness, atmosphere, and food quality.
Customers evaluate P2P services in accordance with the theory of reasoned action (TRA) (Fishbein & Ajzen, 1975), considering their logical evaluation of service benefits based on whether the service facilitates the provision of high-quality task-oriented services and the enjoyment on offer, according to (S. Lee & Kim, 2018). Fauzi and Sheng (2020) supported utilitarian value as a key factor in customers’ favorable purchase intentions of P2P services based on their rational evaluation of the benefits of service performance. From this standpoint, consumers evaluate the utilitarian benefits of meal-sharing services, and their willingness to pay for the service is expected to increase as utilitarian value increases. Thus, the relationship between utilitarian value and purchase intention can be hypothesized as H1.
H1: Utilitarian value positively influences purchase intentions toward meal-sharing.
Hedonic value, as a source of pleasure, is more individualized and subjective than utilitarian value (Holbrook & Batra, 1987). Unlike traditional restaurants, meal-sharing allows patrons to interact more intimately with other patrons through amusing small talk, etc., resulting in a more engaging patron experience. Customers’ hedonic value for the meal-sharing service rises in direct proportion to the emotional benefits they perceive, which increases their purchase intentions (Yuan et al., 2022). Hypothesis H2 suggests that hedonic value had a positive effect on purchase intentions for meal-sharing.
H2: Hedonic value positively influences purchase intentions toward meal-sharing.
Instrumentation
The operational definition of each variable is specified in accordance with meal-sharing services based on the conceptual definitions proposed by prior studies, as shown in Table 4.
Operational Definition of Variables.

Hedonic and utilitarian values are proposed as multidimensional constructs, with operational definitions for each dimension listed in Table 5. In the context of meal-sharing, seven dimensions are classified into Hedonic and utilitarian values.
Operational Definition of Dimensions.

There is no measurement for either utilitarian or hedonic values, which were proposed as latent constructs for customer perceived value. Measurements for each dimension of utilitarian and hedonic values are designed based on attributes extracted from online reviews. Items for measuring purchase intent were adapted from (Alalwan, 2018). Table 6 shows the measurements for each variable after the pre-test.
Measurements of Variables.

Pre-Test
With a small sample pre-test, qualified questionnaire measurements were reserved (Anderson & Gerbing, 1991). Three volunteers who often traveled abroad were invited to participate in the pre-test to ensure that all measurements were appropriate for respondents. Based on the preliminary analysis of the pre-test data, the questionnaire was revised further.
The revised questionnaire included 9 items for measuring utilitarian value, 12 items for hedonic value, and 3 items for purchase intention. Initially, the questionnaire was written in English. Back-translation of questionnaire items was used to ensure that the local language translation matched the English meanings (Sperber, 2004). Then, on a seven-point Likert scale ranging from 1 (“completely disagree”) to 7 (“completely agree”), eligible respondents were invited to rate all measurements.
Data Collection
This study collected mostly data from Indonesia, with a rate of 95.5% because Southeast Asian countries adore traveling to Europe (European Travel Commission, 2019). To date, meal-sharing is mostly available in Europe. The questionnaire was distributed to respondents who met the following criteria to better understand future customers in other regions of Europe: (1) have never used a meal-sharing service; (2) have heard about meal-sharing; (3) are interested in meal-sharing; and (4) are travelers from Asian countries.
During June and July 2022, data were collected in Taiwan and Indonesia using both online and paper-based survey questionnaires. The online survey was housed on an online survey server, and invitations to participate in the study were distributed through numerous online forums, resulting in 19 completed questionnaires. The online response rate was unavailable because the number of respondents addressed during the invitation stage was unknown. The paper-based survey questionnaires were conducted in Jakarta, Medan, Bandung, and Surabaya, Indonesia. It was carried out in travel affairs and exhibitions held by a group of travel agents, hospitality, and tourism industries to promote travel to other countries. Trained data surveyors addressed 463 suitable respondents and received 418 questionnaires, resulting in a 90% response rate. Together with the online survey, a total usable sample of 437 respondents was collected. The sampling technique used in the current research was systematic random sampling (Lepp & Gibson, 2003).
Results
Following data screening, 437 valid respondents from Indonesia, Malaysia, Taiwan, and Vietnam were gathered. For exploratory factor analysis (EFA) and confirmatory factor analysis (CFA) testing, the samples were randomly divided into two groups. Table 7 shows the distribution of each demographic attribute.
Profile of Samples (n = 437).

Table 8 shows the descriptive statistics of all measurements, including mean and standard deviation (SD) for each item.
Descriptive Statistics (n = 437).

EFA Test
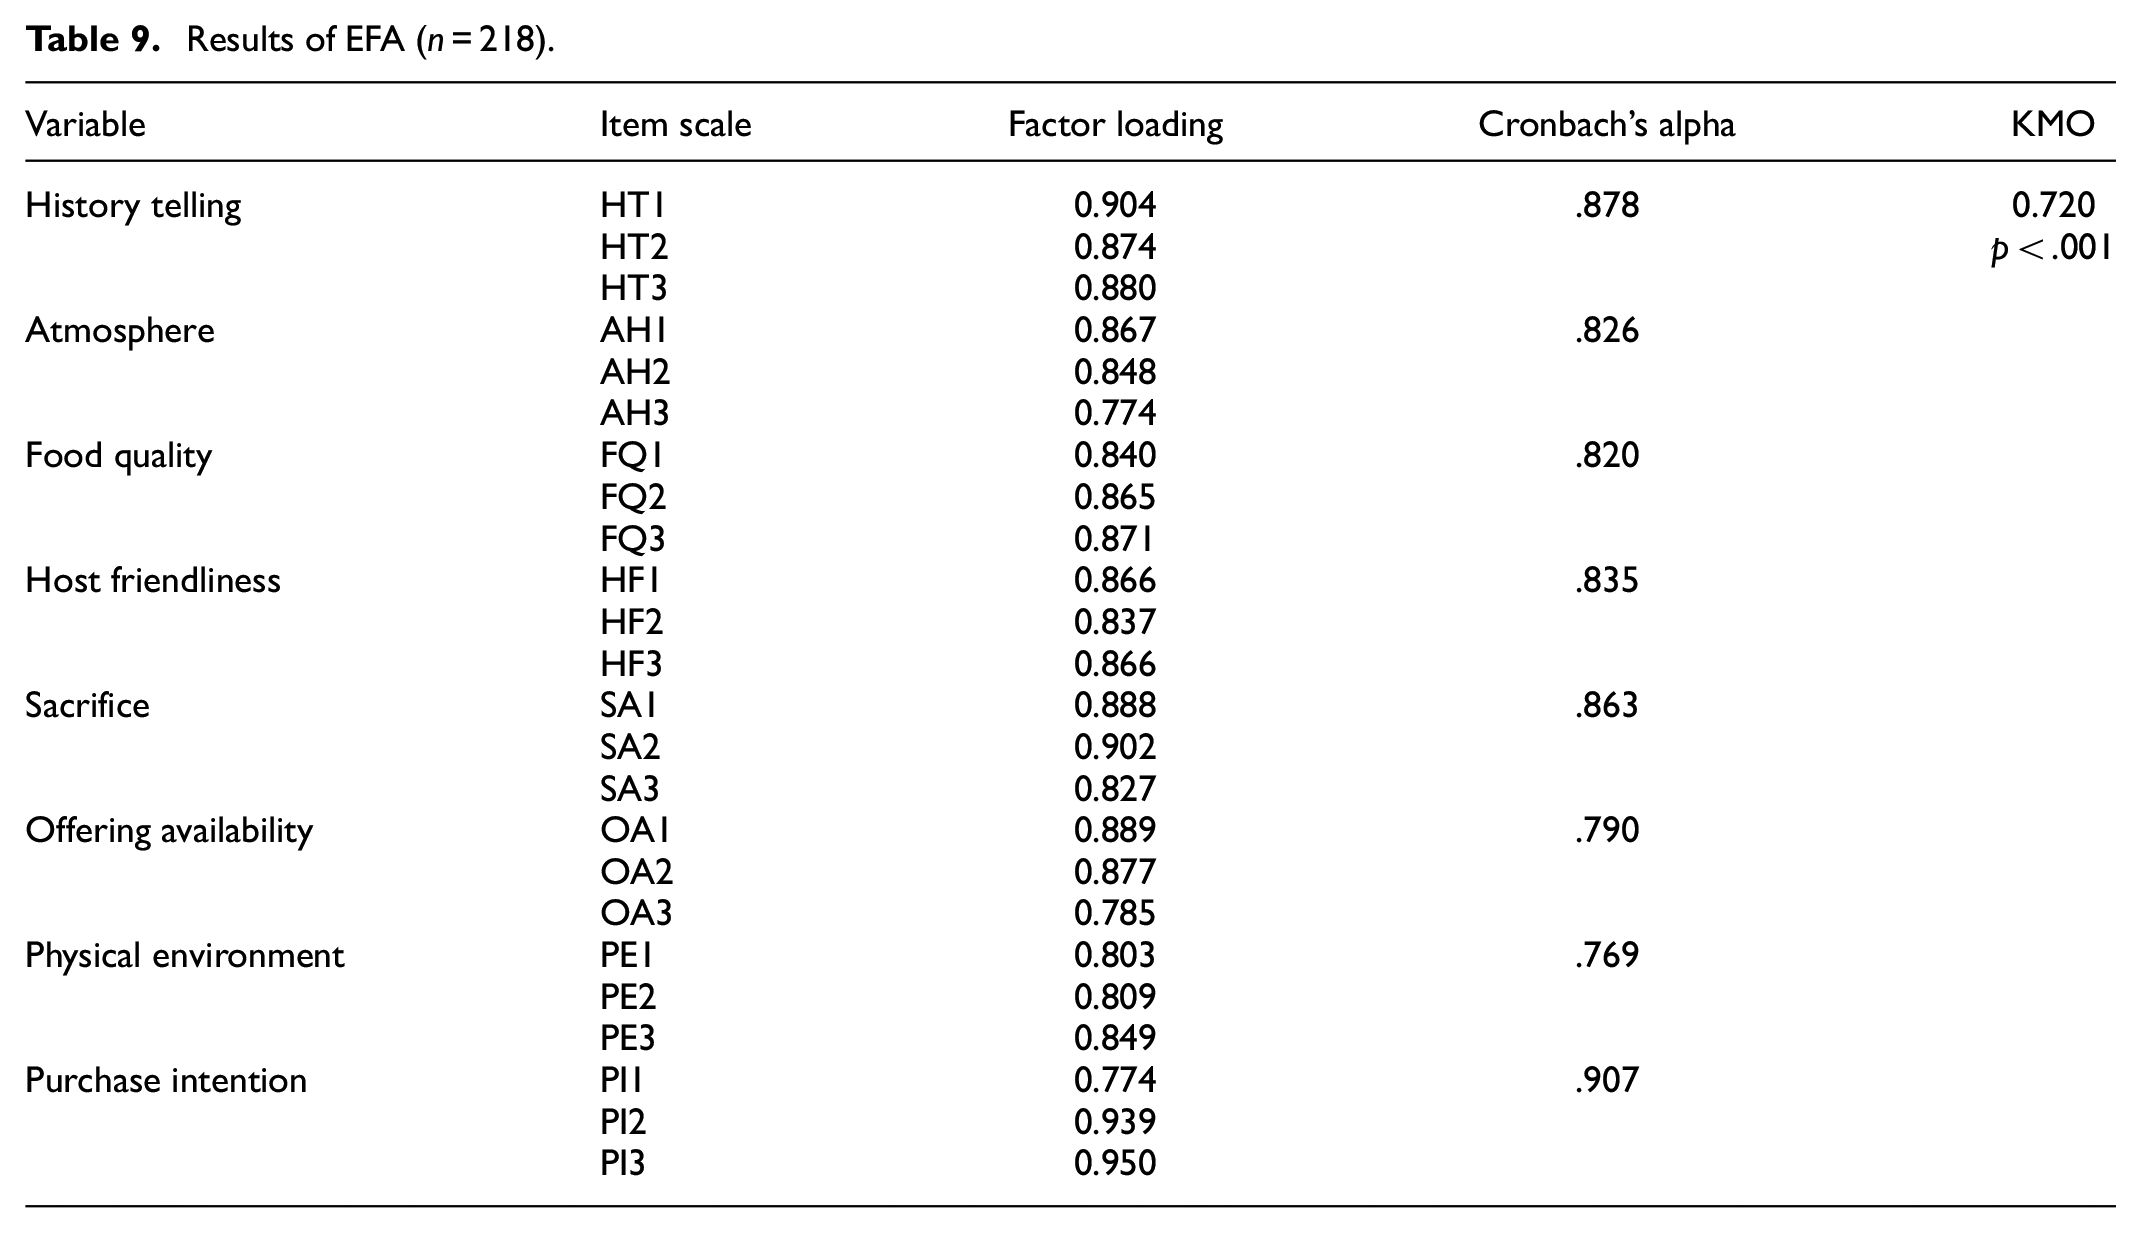
Randomly selecting 218 of the total valid samples were used to perform the EFA test. Before proceeding with further analysis, the Kaiser-Meyer-Olkin (KMO) test for sampling adequacy and Bartlett’s test for sphericity were performed. The KMO must be greater than 0.6, with the significance of Bartlett’s Test of Sphericity less than 0.05 (Roger-Monzó et al., 2015). The KMO and Bartlett tests both met their thresholds, according to the results. The KMO was 0.720, and Bartlett’s test result was p < .001. On the total 24-item scale, the total variance explained was 77.839%. Factor loadings of all items were examined after the orthogonal varimax rotation with Kaiser Normalization. The EFA results showed that all factor loadings were greater than 0.5, ranging from 0.774 to 0.95, indicating good construct validity for all seven dimensions (Asmelash & Kumar, 2019). Cronbach’s Alpha was used to assess the internal consistency of variables (Cronbach, 1951). Cronbach’s alpha should be greater than .7, according to various reports (Hinkin, 1998). Results showed Cronbach’s alpha of variables were all greater than .7, ranging from 0.769 to 0.907. The factor loadings and Alpha values for each variable are shown in Table 9.
Results of EFA (n = 218).
CFA Test
Another valid 219 samples were used to perform the CFA test. The purpose of CFA here is to test the second-order factor model for utilitarian and hedonic values. There are several criteria that must be fulfilled to examine the measurement and structural models’ overall goodness of fit in SEM.
Table 10 lists all the needed criteria, First, chi-square/degree of freedom (x2/df) has a value lower than the acceptable fit score of 3.00 (Schreiber, 2008). This result explains that x2/df value had an acceptable fit. Second, comparative fit index (CFI), goodness-of-fit index (GFI), and normed fit index (NFI) have values greater than 0.80, which is better than an acceptable fit score of 0.80. This result indicated that CFI, GFI, and NFI represented a good fit (Hu & Bentler, 1999). Third, for other fit indices, the adjusted goodness-of-fit index (AGFI) is also above the acceptable threshold value of 0.70; the root mean square error of approximation (RMSEA) and the standardized root mean square residual (SRMR) also have a value score lower than the acceptable fit value of 0.10 (Hu & Bentler, 1999; Schreiber, 2008). This result indicated that AGFI, RMSEA, and SRMR showed a good fit. Table 10 revealed that good model fit had been achieved for the customer value scale for second-order factor model for utilitarian and hedonic values.
Goodness of Fit Indices (n = 219).
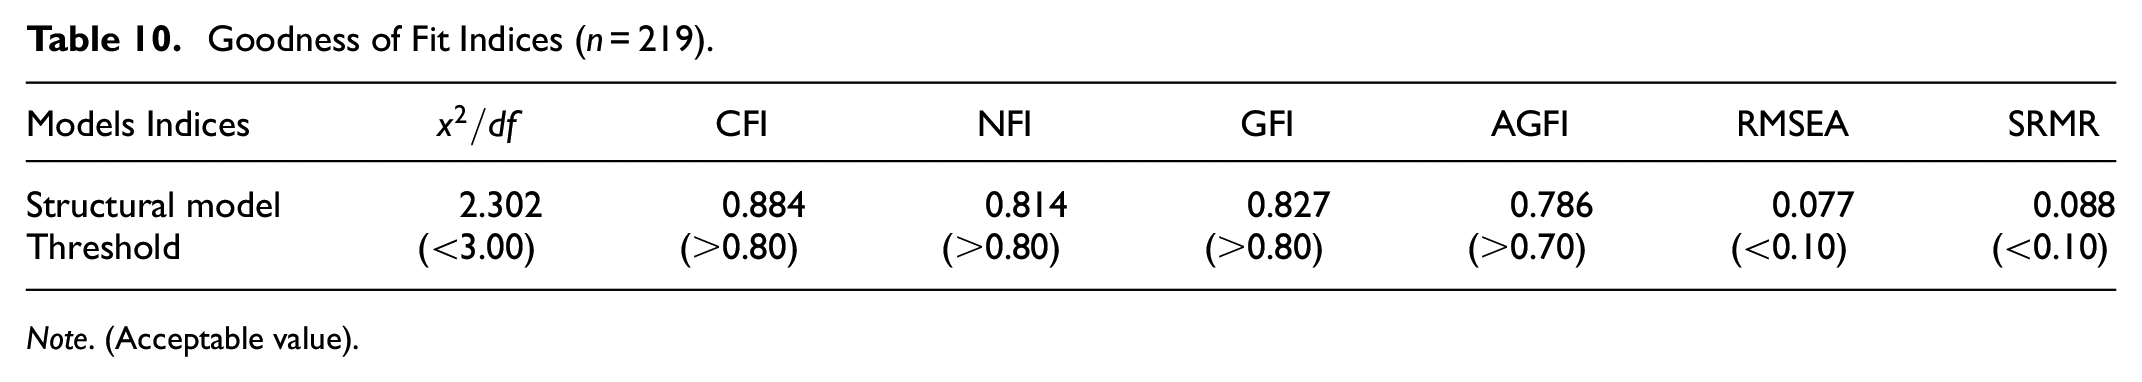
Note. (Acceptable value).
To ensure the reliability and validity of the variables, once the goodness-of-fit indices were satisfied, convergent validity & discriminant validity, composite reliability (CR), and the extracted average variance (AVE) were tested (Campbell & Fiske, 1959). Cross-factor loading and average variance extraction (AVE) were used to assess convergent validity. A factor loading value of >0.7 and an AVE value of >0.5 imply that an item has excellent convergent validity (Hair et al., 2014). Convergent validity is also indicated by highly connected and positively associated indicators inside a construct with high factor loading values (Wixom & Watson, 2001).
As indicated in Table 9, the overall cross-factor loadings are greater than 0.7, indicating that the construct validity is satisfactory (Fornell & Larcker, 1981). Table 11 shows that all of the items have an AVE value more than 0.5, indicating acceptable convergent validity. Furthermore, as recommended by (Hair et al., 2009), the square root of the AVE value for each construct is bigger than the correlations with other constructs, showing good discriminant validity. Furthermore, the table shows that the composite dependability (CR) value above the permitted threshold value of 0.6. (Fornell & Larcker, 1981). Therefore, the proposed scale was validated and named as customer value scale (CVS) for measuring customer perceived value in the context of meal-sharing.
Results of Measurement Model (n = 219).

Note. Numbers in diagonal line are square roots of AVE.
Hypotheses Test
Path coefficients, which show the strength of the interactions between independent and dependent variables, were used to estimate the structural model in this investigation (Sarstedt et al., 2022). The significance of these coefficients was determined using a bootstrapping approach. The results, as given in Table 12, demonstrated that all pathways had statistically significant positive coefficients. Results of structural model showed the path attributes utilitarian value (β = .61, p < .001) and hedonic value (β = .45, p < .001) both positively influenced purchase intention. H1 and H2 were thus statistically supported. Overall, with an R squared value of .57, customer perceived value had a moderate explanatory power on predicting future purchase intentions for meal-sharing.
Result of Hypothesis Testing (n = 219).

Note.
p < .001.
Discussion and Conclusions
Summary of Findings and Contributions
Customer perceived value is defined as reasonably priced, good value for money, economical, consistent quality, social approval, and pleasure aspects (Sweeney & Soutar, 2001). This study validated the customer value scale (CVS), a multidimensional scale for measuring customer perceived meal-sharing value. According to Dagger and O’Brien (2010), both experienced and inexperienced customers evaluate the same set of service features. In this study, all CVS dimensions were identified by experienced customers and are effective in potential meal-sharing customers’ purchase decisions. This finding suggests that the same core factors influence both experienced and inexperienced customers’ meal-sharing purchase intentions.
A customer value scale was validated and used in this two-stage study to determine customers’ perceived value of meal-sharing and how it predicts potential consumers’ purchase intentions. The first stage used a feature selection approach to extract seven customer recommendations attributes that customers perceived as dimensions of meal-sharing value. The second stage validated the structure of customer value scale using exploratory and confirmatory factor analysis methods. The findings revealed that CVS was a multidimensional scale with utilitarian and hedonic values as latent constructs. Using the CVS as an instrument, significant correlations between consumer perceived value and meal-sharing purchase intention were discovered. The findings reveal that consumer perceived value, which includes seven dimensions under hedonic and utilitarian values, influences prospective customers’ meal-sharing purchase intentions. Previous research has investigated the effects of utilitarian and hedonic values on purchase intent (S. Lee & Kim, 2018).
Theoretical Implications
The findings have various implications for peer-to-peer research. Firstly, the current study emphasizes the importance of the customer value scale in determining how they intend to select a meal-sharing service. Previous research that did not consider the effect of the customer value scale in their models of meal-sharing purchase intention may not have reflected the genuine psychological processes underpinning behaviors. This study recommends that purchase intention researchers, whenever possible, include the CVS scale to determine customer purchase intentions toward other P2P services. The benefits could be enormous; more crucially, the findings could improve comprehension of intricacies that a simple pooled sample analysis could not detect.
Secondly, CVS was identified as a second-order factor of customer perceived meal-sharing value, which strengthens the dimension of customer perceived value. The seven dimensions of utilitarian and hedonic values, particularly their measurements extracted from customer reviews, are relatively new for P2P services.
Finally, compared to attributes of customer perceived value in prior studies, history telling is novel among CVS dimensions. Consumers are driven to enjoy a pleasure aspect because customers who want to join a meal-sharing service not just want to try the local food, but also, they want to enjoy the process of the core service. This notifies the P2P researchers that customers of P2P services pay some attention toward the pleasure aspect of the service.
Practical Implications
This study brings contribution to practical to maintain and to attract customers. Meal-sharing’s managers can take some strategies to maintain customers based on this study’ findings that sacrifice, offering availability, physical environment, history telling, food quality, host friendliness, and atmosphere are important factors for experienced customers. These factors are valuable because they are written by customers.
To attract new customers, managers may pay more attention to utilitarian and hedonic value because they affect customer purchase intention. Confirm with previous research, utilitarian value is related to rational evaluation of the benefits of service performance which customers expecting how good or bad the service providers deliver the core services (Fauzi & Sheng, 2020). On the other hand, hedonic value rises in direct proportion to the emotional benefits they perceive which customers expect that service providers bring some emotional relief (Yuan et al., 2022). Customers who are going to meal-sharing the majority are travelers that want to release their stress from daily activity in their own countries. Marketers can use utilitarian and hedonic value as an endorsement trigger for meal-sharing promotions (Sezgen et al., 2019).
Directions for Future Research
As with earlier studies, some limits must be addressed. Recognizing them should help to improve future research efforts. First, the fact that most of the samples in this study originated from a single country raises concerns about how broadly the findings may be applied. As a result, the ability to generalize results to other domains should be questioned. Second, while online customer reviews are an excellent source of data for hospitality and tourism research, their applications are still being explored. This study only collected samples of online consumer reviews from a single meal-sharing website.
To improve the external validity of the results, future studies should collect online consumer reviews from other meal-sharing platforms. Furthermore, it is suggested that the sampling unit be enlarged to cover other groups. For example, further research might be conducted across different nationality groups to compare the impact of their cultural origins. Clearly, this study is simply the beginning of learning about travelers’ meal-sharing intentions. Finally, future research would be more extensive if CVS was included as an essential criterion for future tourists to choose other comparable tourism services such as cooking courses, food excursions, and so on.
Footnotes
Declaration of Conflicting Interests
The author(s) declared no potential conflicts of interest with respect to the research, authorship, and/or publication of this article.
Funding
The author(s) received no financial support for the research, authorship, and/or publication of this article.
Ethics Statement
Not applicable.
Data Availability Statement
Data sharing not applicable to this article as no datasets were generated or analyzed during the current study.