
Abstract
This study investigated the possible contributing factors to the digital gender divide and the spatial spillover effects of submarine communication cables on neighboring areas. Using spatial statistical models and global data, this study examined the Internet penetration rate and the digital gender divide in 186 countries. Data sources included open source data, social media, ITU and UNCTAD databases, and the World Bank. The study estimated the average male and female Internet users in 186 countries using Facebook API. The number of submarine communication cables between countries was used as the basis for constructing the spatial weights matrix. The countries with the highest Internet penetration rate were mostly in Europe. Those with the lowest Internet penetration rate were in Africa, Central Asia, and West Asia. Thirteen of the 15 countries with the worst Internet penetration rate were located in the African region. A significant digital gender divide arose in the developing and the least-developed countries. We argue that connectivity is key to the reduction of the digital gender divide and to ensuring that more women have access to the Internet. The study ascertains that the Internet penetration rate is related to the digital gender divide in individual countries and has a spatial spillover impact in surrounding nations connected by submarine communication cables. The study demonstrates that submarine cables serve as important infrastructure for closing the digital gender divide and deserve increased analytical attention.
This study looked into why there is a difference in how men and women use the internet, and also how undersea communication cables can affect nearby areas. We used models and data from around the world to study how much the internet is used and how it’s used differently by men and women in 186 countries. We gathered information from various sources like social media, ITU, UNCTAD, and the World Bank. We used Facebook data to estimate the number of male and female internet users in each country. The number of undersea communication cables between countries helped them see how connected they were. The countries in Europe had the most internet users, while countries in Africa, Central Asia, and West Asia had the fewest. Especially in Africa, there were many countries with very low internet usage. We found a significant difference between men and women in how they use the internet in developing and less-developed countries. The researchers suggest that better internet access is important to reduce this gap and make sure more women can use the internet. We also found that the internet usage in one country can affect neighboring countries connected by undersea cables. These cables play an essential role in bridging the digital gender gap and should be given more attention when analyzing internet usage patterns.
Keywords
Introduction
The number of people using the Internet around the world has increased to 4.54 billion, with 298 million additional users arising in January 2019. In July 2021, 4.80 billion individuals worldwide would be online—about 61% of the world’s entire population (Datareportal, 2021). The global penetration rate climbed from about 17% in 2005 to more than 53% in 2019 (International Telecommunication Union [ITU], 2019). In September 2015, the United Nations adopted Sustainable Development Goals (SDGs), thereby officially replacing Millennium Development Goals (MDGs) in the work to reduce current gender inequality (UN, n.d.). Gender inequality exacerbates the plight of women in poverty by limiting their options and talents (Messerli et al., 2019). Gender Equality, the fifth goal of SDGs, is not only a basic human right, but also contributes to societal economic development (Maceira, 2017). Furthermore, Woman Empowerment in Information and Communication Technologies (ICTs) is a key tool to eliminate gender inequality (Manzoor & Farooq, 2017). Asongu and Odhiambo (2020) assessed how ICT modulates the effect of inequality on female employment. With the rapid development of science and technology, the Internet provides a platform upon which ICT applications can be applied (Alderete, 2017; Asrani & Kar, 2022; Edo et al., 2023; Herath & Mittal, 2022; Kar et al., 2019). Tjoa and Tjoa (2016) point out that “No other domain in the recent past has had a stronger influence on the development of countries and societies than information and communication technologies.” However, leaders face the predicament of how to allocate ICT resources fairly between men and women. Differences in the amount of information accessed by people of races, countries, and genders have resulted in a digital divide (Lee, et al, 2015; Scheerder et al, 2017).
The digital gender divide, characterized by unequal access to and use of digital technologies between men and women, has a significant impact on the achievement of the United Nations’ SDGs. Bridging this divide is crucial for fostering gender equality, promoting economic growth, and achieving a range of other SDGs. Addressing the digital gender divide directly supports SDG 5: Gender Equality, which aims to empower women and girls and ensure their equal rights and opportunities. Through bridging this divide, women can access vital information, educational resources, and employment opportunities, empowering them to make informed decisions about their lives and participate in the digital economy. Additionally, it contributes to SDG 8: Decent Work and Economic Growth, as equal access to digital technologies enables women to enhance their skills, seek better job opportunities, and contribute to inclusive economic growth. Moreover, by narrowing the digital gender gap, we can advance progress toward SDG 9: Industry, Innovation, and Infrastructure, as it requires universal access to ICTs to foster innovation and enhance productivity. By recognizing the importance of digital inclusion and ensuring equal access to and use of digital technologies, we can make substantial progress toward achieving a more equitable and sustainable future for all.
Digital inclusion has a profound impact on various stakeholders, influencing their lives, opportunities, and overall well-being. For individuals, digital inclusion opens doors to new possibilities and empowers them to participate fully in the digital society. Access to digital technologies and skills enables individuals to connect with others, access information and resources, and enhance their education and employment prospects. From a societal perspective, digital inclusion has wide-ranging implications for communities, governments, and businesses. A digitally inclusive society benefits from the collective participation and contributions of its members. By ensuring equal access to digital technologies and opportunities, communities can promote social cohesion, bridge gaps in communication, and foster civic engagement.
The term “digital divide” first appeared in the publication “Falling Through The Net: Defining The Digital Divide” issued by the National Telecommunications and Information Administration (NTIA) in the mid-1990s. The term refers to the information gap between those who benefit from the new technology and those who do not (NTIA, 1999). In the past, measurement of the digital divide was based on whether people had access to computers and the Internet (Scheerder et al., 2017). However, as the digital divide definition is not generally acknowledged, its meaning has shifted significantly with the rapid development of ICTs. Consequently, a second and third digital divide emerged, leading to discussion regarding access provision to the Internet, bandwidth, and ICT equipment; comparing differences in information ability; and evaluating the impact of information on social roles (Aydin, 2021; Helsper et al., 2015; Scheerder et al., 2017; van Deursen & van Dijk, 2019). As a result, the digital divide is now determined by comparing differences between different groups, research regions, occupations, and genders (Asongu & Odhiambo, 2020; Galperin & Arcidiacono, 2021; Rajam et al., 2021).
According to a report published by the ITU in 2019, women use the Internet at a lower rate than males, with only 48% of women utilizing it globally compared to 52% of men, which means a digital gender divide could exist. Although Internet subscription rate is increasing, the gender gap is widening, which is a concern raised in the ITU 2019 report. Narrowing the digital gender divide benefits society and technology (OECD, 2018; Marzano & Lubkina, 2019). However, restrictions in terms of education, traditional culture, and social norms contribute to significant differences in the proportion of males and females using the Internet in most developing countries (Antonio & Tuffley, 2014; Aydin, 2021; Puspitasari & Ishii, 2016). Figure 1 illustrates Internet penetration rate by gender in different regions. The 2013 and 2019 data indicate that the digital gender divide is expanding, especially in developing and under-developed countries in the Asia Pacific region and Africa. South Africa’s restricted Internet availability is confirmed by international and national data sources (Oyedemi, 2012). Globally, the gender divide has increased from 11% in 2013 to 17% in 2019. While the disparity is minimal in developed countries, it is significant in developing countries, particularly LDCs (ITU, 2020; Mumporeze & Prieler, 2017).

The digital gender divide by region.
Bringing the over 3.5 billion unconnected people online is a top priority for the ITU and the UN Broadband Commission, but lacking infrastructural and financial constraints limit connectivity (del Portillo et al., 2021). Submarine cables are key components of the world’s interconnected networks, transporting approximately 99% of international communications traffic (Brake, 2019). Governance of submarine communication cables aids in achieving SDG (IGF, 2018). This article attempts to find inherent and dynamic links between connectivity and penetration (Arvin et al, 2021). Is it possible for a country to benefit from the broadband infrastructure of its neighboring countries? In a digitally connected world, can countries connecting by submarine communication cables produce greater spillover effects to other areas? The study is primarily concerned with the use of spatial statistical models and global data, as well as an empirical examination of Internet penetration rate spatial dependence and digital gender divide. This paper subsequently presents a brief review of the literature on the digital gender divide and Internet penetration. The research method section constructs the spatial econometric models for cross-sectional data. The results obtained from in-depth statistical analysis are then presented pertaining to how spatial variables interacted with the digital gender divide. Finally, the findings are discussed and conclusions are drawn.
Literature Reviews
As previous studies on the digital gender divide have been constrained by data collection difficulties, especially in underdeveloped countries (World Wide Web Foundation, 2020), and quantitative analysis obstacles (Hafkin, 2007), research is limited to specific regions (Alozie & Akpan-Obong, 2017; Hilbert, 2011). Fortunately, the ITU has devoted greater attention to the digital gender divide issue and has begun to determine Internet subscription rates by gender. However, the ITU database only contains 110 countries, and many areas are excluded, especially underdeveloped countries (ITU, 2019). If these countries are omitted from consideration, the resulting analysis may exhibit bias, thereby underrepresenting the severity of the digital gender divide.
Tobler’s first law of geography states that “All things are related, but nearby things are more related than distant things” (Tobler, 1970). Because of the interaction of spatial objects, if the spatial relationship between them is ignored, the analysis result could be biased. Figure 2 shows the world Internet penetration rate. On the Choropleth map, the deeper the color, the higher the subscription rate. In contrast, the lighter the color, the lower the penetration rate. Qatar is represented by the darkest shade, owing to its Internet penetration rate of 1. Contrarily, Chad has the lowest Internet penetration rate at 0.063 in 2019. We see that countries with higher penetration rates are distributed across North America, Northern Europe, East Asia, West Asia, and Oceania. Countries whose neighbors have higher Internet penetration rates also exhibit this characteristic, indicating that the penetration rate of these areas is geographically clustered. Similarly, countries with low penetration rates are also surrounded by those with low penetration rates.

Choropleth map showing internet penetration rate and submarine cables.
Figure 3 shows the world penetration rate by gender. In this map, penetration rates relate to the number of women and men who use the Internet as a percentage of the total female and male population. When the difference between male and female Internet penetration rates is less than two percentage points, the ratio is considered equal. Blue countries are those in which male use of the Internet is higher than female use. In contrast, red-shaded countries are those in which female use of the Internet is higher. The digital gender divide and spatially clustering phenomena are clearly significant. The assumption of independence between samples might be invalid, thus the attribute value of the digital gender divide could be spatially autocorrelated. The use of visualization alone cannot explain the difference between the attribute values of spatial objects. It is also necessary to analyze the data using spatial statistical methods. Further, if we want to identify factors contributing to the relationship between spatial objects, we must apply spatial econometric models (Anselin et al., 2013).

Proportion of internet users by gender and submarine cables.
The growing digitalization of our society has given rise to novel and emerging data forms, which offer fresh possibilities and enhanced potential for data-driven multimedia services (Radanliev & De Roure, 2023; Sharma et al., 2022). Kashyap and Weber (2018) and Kashyap et al. (2019) collected Google multimedia advertising data, estimated the number of clicks by different customer bases, and separated these figures by gender to emphasize how aggregated, real-time data from online advertising platforms can be utilized to supplement the existing data sources to monitor crucial global development indices. In addition to Google, other social media platforms, such as Facebook, are excellent data sources (Araújo et al., 2017). With the rapid development of the Internet, average users per month of Facebook, which provides a good advertising platform for companies, has reached 2.7 billion (Facebook, 2020). Through Facebook’s marketing API, companies can ascertain how many potential customers can be reached according to country, gender, and age. Furthermore, companies can be informed how much they need to pay to place an advertisement in advance as a basis for evaluating whether to proceed. As this method exhibits the characteristic of nowcasting, some scholars suggest that Facebook users are representatives of the Digital Census. This perspective not only reflects the real-time performance of data but also reduces the cost of census and data processing (Araújo et al., 2017). Zagheni et al. (2017) states that, “given the importance of demographic data for monitoring development, the lack of appropriate sources and indicators for measuring progress toward the achievement of targets is a significant cause of uncertainty.” Nevertheless, the study asserts that the data obtained through Facebook’s marketing API is useful for demographic analysis, even without correction. Fatehkia et al. (2018) collected data on average users per month by gender according to specific criteria and considered the difference between the male and female population. After taking the population into account, research indicated a good coefficient of determination, even when this indicator was used alone. Garcia et al. (2018) and Mejova et al. (2018) also used similar data collection methods to establish indicators of the digital gender divide. The study involved the creation of a Facebook gender index to measure the digital gender divide.
The study explores the spatial dependence problem of digital gender divide. This spatial patterning—spatial autocorrelation—can be treated as useful information about unobserved influences, but it does challenge the application of methods of statistical inference that assume the mutual independence of observations. The infrastructure to support higher Internet penetration in one country is not independent of whether neighboring countries have sufficient infrastructure to support Internet penetration or not. We suggest that there is feedback among proximate countries that influences their Internet penetration and digital gender divide. We also explore several questions: Are high levels of average Internet infrastructure requisites for a lower digital gender divide? Are these average values of neighboring observations correlated with each country’s own score on the digital gender divide or Internet penetration rate? Spatial association in the case of measures of the digital gender divide would join a measure of how close countries are to one another in terms of some spatial measurement, with a measure of the similarity of digital gender divide for each pair of countries examined. This study specifies countries as neighbors if they are linked by submarine communication cables. To combine information about the connected countries, we usually assume that all neighbors carry equal weight and that the weight of each is proportional to 1 over the total number of connectivity. The lag of the digital gender divide over space is the mean or average of digital gender divide score across all connected countries. The main goal of getting a spatial lag is to derive an average value that exists in neighboring regions. We have seen that the distribution of the digital gender divide displays spatial clustering in the sense that countries are more likely to have higher values on the digital gender divide score if they are surrounded by countries that also have greater digital gender divide. Although some of the clustering regarding the digital gender divide obviously could be due to spatial clustering in the Internet penetration rate, which thereby is positively related to the digital gender divide, we have shown that the spatial clustering in the digital gender divide data does not completely disappear when we condition on a country’s level of Internet penetration rate. Given that the distribution of digital gender divide still displays spatial clustering after conditioning on a country’s Internet penetration rate, we should look for possible ways to incorporate this spatial dependence in the regression model.
Research Method
This section elucidates the procedures to investigate the spatial patterns and relationships underlying the digital gender divide. We commenced by acquiring data from diverse sources and data processing. Subsequently, we constructed a spatial weight matrix to account for spatial dependencies among observations, enabling a robust exploration of spatial autocorrelation. To analyze the spatially structured data, we employed advanced Spatial Autocorrelation and Econometric Models, leveraging their effectiveness in capturing spatial relationships and providing insights into the spatial determinants influencing the phenomenon’s dynamics.
Data Collection
The Gender Digital Divide
The study involved the creation of a Facebook index to measure the digital gender divide. In this section, we first introduce the data sources and explain how a spatial weight matrix was constructed for subsequent spatial autocorrelation analysis and the utilization of spatial econometric models. Using Facebook API, we obtained the average number of male and female Internet users in 186 countries. Countries’ male and female populations were taken into account, thereby avoiding the gender divide caused by differences in the population base, as in Equation 1. When the value of the FB gender ratio is close to 1 or greater than 1, the digital gender divide is said to have been eliminated.

Gill et al. (2010) posited that the digital gender divide in developing countries arose from women’s insufficient technological education and training due to childrearing and other domestic responsibilities, social norms, and national financial and institutional obstacles. As a result, we contend that, in those developing countries with low female Internet penetration rates, men are given a higher priority in accessing ICT resources, which in turn creates gender inequality in access to digital information and lead to a digital gender divide. Spatial regression models were constructed and compared using the ordinary least squares regression model through statistical software program Stata. As a result, spatial effects were taken into account, which confirmed whether Internet penetration rate was an explanatory variable for the digital gender divide.
The Spatial Weights Matrix
One characteristic of spatial analysis is that it quantifies spatial relationships. The spatial weights matrix had therefore to be constructed first. Simple methods for constructing the spatial weights matrix include Queen Contiguity, Rook Contiguity, Inverse Distance, and K-nearest. The spatial weights matrix can also be constructed according to the research topic, travel time between locations, and travel cost. Since relevance to the research topic needed to be considered in the construction of the spatial weights matrix, in this research, we used the number of submarine communication cables between countries as the basis. By employing submarine cables instead of using the actual distance between countries as a spatial framework to study digital gender divide, we can gain a more accurate understanding of the issue. Firstly, submarine cables represent the physical infrastructure that underpins global internet connectivity. These cables form the backbone of international data transmission, directly linking countries and continents. Secondly, geographical distance alone may not capture the variations in internet speeds and reliability that users encounter across different regions. Thirdly, submarine cables provide a comprehensive picture of global internet infrastructure, allowing us to account for connectivity between countries and regions that might not share a border but are linked through undersea data cables. Submarine communication cables facilitate 99% of data transmission in the world (Brake, 2019). More than a million kilometers of undersea cables now crisscross the world’s oceans, connecting tens of millions of kilometers of fiber on land (Pullar-Strecker, 2021). If a single cable fails, communications traffic can readily be diverted, albeit at a slower rate. However, if they were all suddenly disconnected, that would be the end of the internet until they were repaired. The aforementioned illustrate the importance of submarine cable connectivity and use of the number of submarine cable connections as the basis for the construction of the spatial weights matrix. In Equation 2, the


Spatial Autocorrelation and Econometric Models
Space autocorrelation is the relationship between spatial objects and their attribute values in space. Spatial autocorrelation is detected by combining the global Moran’s I index and statistical hypothesis testing. The degree of similarity and variation between neighboring countries were used to calculate the Global Moran’s I index. On the basis of the Global Moran’s I index, the spatial pattern was hypothesis tested statistically. These statistics facilitated the determination of whether if the digital gender divide was global. If the null hypothesis is rejected, the Global Moran’s I index can only determine whether the attribute value is clustered. A spatial clustering pattern is also indicated by the Local Indicators of Spatial Association (LISA). With the standardized Z-score and statistical hypothesis testing, we can assess the presence of spatial autocorrelation.
The study then established an ordinary least squares regression model, explaining its fit through the coefficient of determination. However, the OLS model must comply with the assumption of Independent and Identical Distribution (i.i.d.) among error terms. From the spatial analysis viewpoint, the assumption could be invalid due to the spillover effects in neighboring areas or an unexplainable spatial heterogeneity. As a result, the spatial effect should be taken into account, and the spatial econometric model should be applied. The study used the Internet penetration rate as an independent variable, adding the product of the spatial weights matrix and the response variable of neighboring countries (the digital gender divide indicator) to the spatial econometric model. As such, the problem of non-independence between error terms caused by spatial spillover effects could be solved, and we could further examine the impact of the digital gender divide by neighboring countries. The structure of an spatial lag model (SLM), illustrated in Equation 3, implies that a one unit change in the digital gender divide in one country will impact other country if

where:
If the coefficient of spatial lag term
Results and Discussion
In this section, we first examine the spatial pattern of the Internet penetration rate and the digital gender divide. We then conduct the spatial autocorrelation analysis, and finally, the spatial econometric models are used to deduce the relationship between the Internet penetration rate and digital gender divide.
Spatial Distribution of Internet Penetration Rate and Digital Gender Divide
After grouping 186 countries by interquartile range, about one quarter of countries’ internet penetration rates was below 0.34, indicating that broadband in these countries was only available to a minority of groups. Another quarter of the countries’ Internet penetration rate was between 0.34 and 0.62, indicating that broadband usage was still not widespread, and the countries’ economic development performance was relatively poor. About a quarter of the countries’ Internet penetration rate was between 0.62 and 0.83, and this group mostly comprised of developing countries. Because of the vast geographical lands of some of these countries, it is difficult to establish telecommunication infrastructures and provide broadband services. Moreover, the gaps between the haves and have-nots can lead to a high Internet penetration rate in metropolitan areas, but a low penetration rate in remote areas. China, Russia, Mexico, and Brazil were all countries included in this group.
The top quarter of countries with the best performance were located mostly in Europe and other areas with stable economic development. Our investigated revealed that 70% of countries with Internet penetration rates of less than 70% are in Africa, Central Asia, South Asia, and West Asia. Of the 15 countries with the lowest Internet penetration rate, 13 are in the African region, with a penetration rate of less than 10% in some countries. This suggested a low-value spatial clustering phenomenon, which requires further testing. On the other hand, although Qatar is located in West Asia, its Internet penetration rate is higher than other countries in West Asia, up to 100%. According to data from the International Monetary Fund, the World Bank, and the United Nations, Qatar’s GDP per capita in 2019 was on the list of the top 10 richest economies.
The Facebook gender ratio was used to measure the attribute value of the global digital gender divide. Figure 4 illustrates the clustering of FB gender ratio in 2019. On the map, high FB gender ratios are clustered in neighboring countries, while low FB gender ratio countries are clustered in different regions of the world. Countries with higher FB gender ratios are depicted in darker shades of blue. Qatar has the darkest shade, owing to its FB gender ratio of 1.51319. In contrast, Yemen has the lowest FB gender ratio of 0.17827 in 2019. Of the 186 countries investigated, 128 had an index value of less than 1, indicating that the digital gender divide still exists in most countries, which supports past research results (Galperin & Arcidiacono, 2021; Mignamissi & Djijo, 2021). The data from the descriptive statistical summary presented an obvious left-skewed distribution, and the Pearson moment coefficient of skewness was .64. About one-quarter of those countries had an index value less than .5; the index value of one-quarter fell between .5 and .75; and that of about half of the countries was over .9. The findings indicated that a significant digital gender divide still existed in half of those countries. Africa, Central Asia, South Asia, and West Asia show a low attribute value distribution. The regions with the lowest Facebook index value were located in Africa, Central Asia, West Asia, and South Asia. Of these, the populations of Bangladesh, Pakistan, and India in South Asia, namely 160 million, 210 million, and 1.35 billion, respectively, account for one-fifth of the global population. According to Hilbert (2011), due to the lack of statistical data in developing countries, in the past, when global technological issues and policies have been discussed in the past, the authorities focused only on the populations of the top 20% of developed countries and ignored those in the remaining 80% of developing countries. Moreover, in these developing countries, women encounter gender discrimination issues more often.

Choropleth map showing the Facebook gender ratio.
Spatial Autocorrelation Analysis
Figure 5 shows the spatial distribution of Local Indicators of Spatial Association (LISA). The pink areas represent high-value local clustering, while light blue areas represent low-value local clustering. The dark red areas represent the LISA attribute value, which are higher than those of neighboring ones, while the dark blue areas represent lower values. Since the spatial weights matrix of the study was based on the number of submarine cables connections between countries, the LISA value was also affected by these connections. In the Americas, due to the large number of connected submarine cables, the Facebook index performed better in this region, and the area exhibited high value clustering. The countries represented by dark blue in this region were Guatemala and Peru, which have poorer economic performance. Consequently, the Facebook index performance was also worse there. In the Eurasia region, although the Facebook index performed well, the connection of submarine cables between countries was less obvious than that in the Americas. In most countries in Africa, the distribution pattern is light blue, representing poorer Facebook index performance and low value clustering. However, the economic development of South Africa and Namibia in South West Africa is significantly better than that of their neighboring countries. Namibia’s economy is tied closely to that of South Africa’s due to their shared history. Namibia gained its independence from South Africa in 1990. It has a stable multi-party parliamentary democracy, and World Bank classified it as an Upper Middle income country (World Bank Group, 2020). In West Asia, Oman has become a wealthy country in the Arab region through the export of natural resources and the development of tourism. It is also defined as a high-income economy by the World Bank (World Bank Group, 2020), and the country’s infrastructure is complete. As a consequence, people can enjoy broadband Internet service equally, thus eliminating the digital gender divide.

LISA value of the spatial distribution of the Facebook Index.
Spatial Econometric Model
Table 1 shows the ordinary least square (OLS) estimates of the FB gender ratio as a linear function of the Internet penetration rate without a spatial lag of the FB gender ratio. The Chi-Square test statistic for the Breusch-Pagan test is 8.23 and this p-value is less than .05, we conclude heteroscedasticity is present and the residuals are not distributed with equal variance. Therefore, one of the key assumptions of linear regression is violated and we incorporated the spatial term into the linear regression model and re-examined the appropriateness for the data at hand. Table 2 shows the maximum likelihood (ML) estimates with a spatial lag of the FB gender ratio. Table 1 shows an OLS estimate of the coefficient for Internet penetration rate (.6246) that is higher than the ML estimate (.5603) for the spatially lagged FB gender ratio model. Including a spatially lagged FB gender ratio term notably improved the model’s ability to account for variations in the FB gender ratio across countries. The model results indicated that the coefficients of the predictor (
Parameter Estimation of Linear Regression Model for FB Gender Ratio.

Parameter Estimation of Linear Regression Model for FB Gender Ratio.

Parameter Estimation of SLM for FB Gender Ratio.


After completing the parameter estimation of the spatial econometric model, the spatial multiplier matrix
Direct and Spillover Effects of Internet Penetration Rate for FB Gender Ratio.
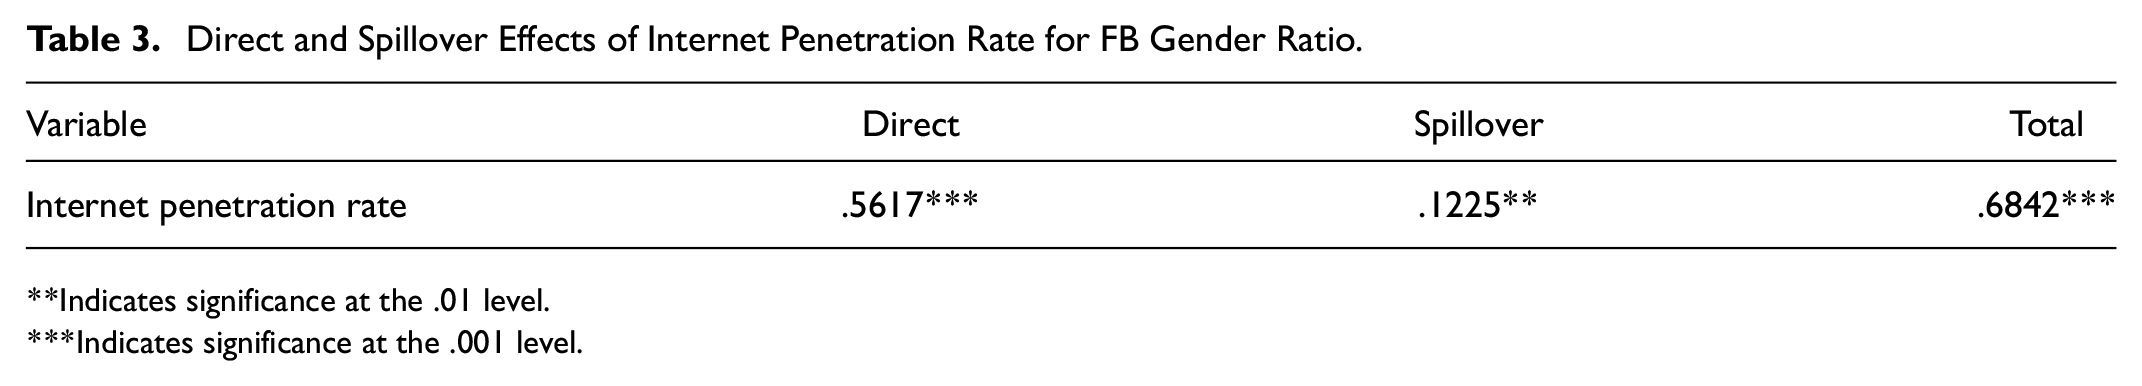
Indicates significance at the .01 level.
Indicates significance at the .001 level.
Having calculated the maximum likelihood estimates for the SLM, we explore the direct and spillover effects of the Internet penetration rate on the FB gender ratio. Table 3 shows an average direct effect of .5617, therefore a 1% change in one country’s Internet penetration rate would increase its own expected value of FB gender ratio by .5617%. Considering the spillover effect, on average, a 1% change in country i’s Internet penetration rate results in a .1225% change in other countries’ FB gender ratio. This could cause a chain reaction in other countries, which would come back to affect country i’s FB gender ratio through the spatially lagged item. Overall, a 1 % increase in the Internet penetration rate results in a .6842% increase in the expected number of FB gender ratio. Based on the OLS coefficient estimate of .6246 in Table 1, the effect of Internet penetration rate on FB gender ratio could be underestimated, owing to the lack of a spatial lag term. Spillover effects of Internet penetration are significant, which can be explained by the fact that these spatial variables affect not only the digital gender divide in one country but also the digital gender divide in neighboring countries via the submarine cable linkages.
Conclusion
The study is primarily concerned with the use of spatial statistical models and global data, as well as an empirical examination of the Internet penetration rate spatial dependence and digital gender divide. According to these findings, although not all countries regularly report Facebook index data, the use of these results to measure the digital gender divide is still useful. It not only helps reduce the lack of available relevant data, but also reduces data collection costs. Future research could incorporate time factor in addition to spatial considerations, and panel data can be used to conduct a spatiotemporal analysis of digital gender divide issues. Understanding how other nations influenced the digital gender divide and Internet penetration service performance via spatial linkages, allows us to grasp the future trend of information traffic changes, as well as the telecoms and ICT sector performance between linked countries.
To describe the global spatial characteristics of the digital gender divide in one country in terms of the Internet penetration and digital gender divide in neighboring countries, the SLM model is chosen. The findings indicate that Internet penetration is positively correlated with the digital gender divide. We develop cross-sectional models to examine their spatial variables for digital gender divide and the residuals of OLS are tested for spatial dependence indicating that spatial econometric models that account for spatial autocorrelation should be used in further interpretation. According to the model fitness result, the SLM model is the most appropriate model to explain the spatial characteristics of the digital gender divide, which explain the digital gender divide in one country in terms of the digital gender divide in neighboring countries. Overall, a 1% increase in the Internet penetration rate results in a .6842% increase in the expected number of FB gender ratio. Internet penetration affects not only the digital gender divide in one country but also the digital gender divide in neighboring countries via the submarine cable linkages.
Submarine cables are critical for the global economy and nation security. The number of submarine communication cables connected in the study determined elements of the spatial weights matrix, which was then used for subsequent spatial autocorrelation analysis and spatial econometric models. The study finds that continuing to share the seabed in harmony contributes to reduce digital gender divide. The governance of submarine cables is not only critical to monitor and prevent Internet shutdowns globally but also helps in strengthening ongoing information exchange for both genders. Nations have developed policies and laws that undermine the integrity of international telecommunications systems. Technocrats need to be diligent in integrating resources. Unique collaboration among service providers, regulators, industries, international lawyers and experts from the submarine cable industry. Future studies should look into the law and policy issues that affect the protection of submarine cables, as well as the laying, maintenance and operation of such cables. For instance, the most effective option to address the security gap in submarine cable regulation is to adopt a new counter–terrorism agreement that criminalizes intentional damage to submarine communication cables (Matley, 2019; Bueger & Liebetrau, 2021).
Spatial statistical methods and worldwide data can provide the Internet penetration rate and digital gender disparity in 186 nations, however there are restrictions. First, this study heavily relies on secondary data sources, such as national surveys and reports, which may vary in terms of data quality, methodologies, and consistency across countries. As a result, there might be discrepancies and biases in the reported Internet penetration rates and gender-specific data, potentially impacting the accuracy and reliability of the findings.
Another potential limitation is the generalizability of the results. Although this study covers a wide range of countries, it is crucial to recognize that variations in geographical, cultural, and socioeconomic factors may exist, influencing Internet adoption and gender disparities differently across regions. Consequently, the findings of this research may not be directly applicable to every country or adequately capture the nuances of local contexts. To mitigate these limitations, future studies could consider incorporating primary data collection methods and conducting in-depth qualitative research to complement the quantitative findings, allowing for a more comprehensive understanding of the Internet penetration rate and digital gender divide worldwide. By explicitly addressing external validity concerns, researchers can ensure that the findings accurately reflect the Internet penetration rates and digital gender divide on a global scale. To ensure the robustness and accuracy of the methods employed. Future study can utilize reliable data sources for different years, implement rigorous data cleaning and preprocess techniques, and conduct appropriate statistical tests to validate the models.
Footnotes
Acknowledgements
The authors gratefully acknowledge the helpful comments of the editor and the anonymous reviewers who provided valuable input and comments that have contributed to improving the content and exposition of this paper.
Declaration of Conflicting Interests
The author(s) declared no potential conflicts of interest with respect to the research, authorship, and/or publication of this article.
Funding
The author(s) disclosed receipt of the following financial support for the research, authorship, and/or publication of this article: This research was supported in part by grants from the Ministry of Science and Technology of the Republic of China in Taiwan (Grant N: MOST 108-2629-E-992-001). Lin was also supported in part by a grant from the High Education Humanities and Social Science Subjects Benchmark Project, Ministry of Education, Taiwan.
Data Availability Statement
Data sharing not applicable to this article as no datasets were generated or analyzed during the current study.