
Abstract
The concept of clean beauty lacks a precise definition and its defining attributes remain unclear. This study assesses the impact of clean beauty on Millennial and Generation Z consumers, identifies its main attributes, and provides a new index for determining products’cleanness. To this end, 120 Korean participants were recruited; they used 10 cosmetic products and completed relevant questionnaires. Clean beauty awareness and product satisfaction were assessed from the cognitive and emotional perspectives. The Reliable Cleanness Score (RCS) was calculated using emotional product satisfaction. Participants’ preference for clean beauty products was correlated with engaged cosmetic shopping behaviors. The key clean beauty attributes were sustainability, safety, and ethicality—in that order. Machine learning-based regression analysis showed that objective and subjective data could be used to calculate the RCS, resulting in an R2 value of .721. With the results of this study, manufacturers, retailers, and consumers will be able to predict RCS.
Introduction
The trend of clean beauty has grown in tandem with the rise in the global wellness industry’s awareness of global warming and animal rights, and has received exponentially increasing attention since the beginning of the coronavirus disease 2019 (COVID-19) pandemic. Consumers have become more conscientious about their individual well-being and therefore prefer safe and non-toxic products (Guinaugh, 2020). However, there is no government definition for clean beauty yet; thus, this concept has been openly interpreted by non-dermatologist retailers, bloggers, and celebrities (Mora & Ross, 2021; Rubin & Brod, 2019). The increase in demand for safe and non-toxic products has expanded the boundaries of clean beauty, which is now associated with natural, organic, vegan, and eco-friendly products (Lee & Kwon, 2022b; Park & Lee, 2022). Thus, the attributes of clean beauty have not been clearly defined; however, they can be categorized as follows: clean for the skin (safety), clean ethically (ethicality), and clean (sustainability) (Chin et al., 2018; Lee & Kwon, 2022a; Mora & Ross, 2021; Salim Khraim, 2011; Suphasomboon & Vassanadumrongdee, 2022). Given the limited information presently available, it is difficult for manufacturers, retailers, and consumers to reach a consensus on a clear standard for selecting or labeling clean beauty products. This may cause confusion in the cosmetic market. To address this lack of clarity concerning the definition of clean beauty, it is necessary to narrow down its most important attributes.
Understanding the shopping preferences and behaviors of future consumer groups is essential for targeting current cosmetic trends. The cosmetic industry is fast paced, and both manufacturers and retailers must constantly innovate to capture the market (Kumar et al., 2006). The rising cosmetic consumer groups are Millennials (i.e., individuals born between 1980 and 1995) and Generation Z (hereafter Gen Z or Gen Zers; those born between 1996 and 2010) (Chaney et al., 2017). Each generation’s shopping behavior before and after the pandemic has been of interest for researchers (Gharzai et al., 2020; Parment, 2013). Thus, in order to understand clean beauty’s position in the market, it is important to identify Millennials and Gen Zers’ perspectives and shopping behavior patterns regarding clean beauty.
As clean beauty is undefined, consumers find it difficult to identify clean products. Consumers are provided with vast information and services that tell them what they should consume (Milkman, 2008). Popular retailers, such as Sephora or Olive Young, award their clean beauty logos to cosmetic products that fulfill their respective clean beauty standards (Lee, 2021; Sephora, 2021). Studies show that consumers are highly dependent on brand names, logos, colors, packaging, or websites that provide information about the product in question (Anjana, 2018; Lee, 2021). Even though many consumers rely on logos provided by retailers or apps that analyze cosmetic ingredients to find products that meet their skin needs, these alone cannot represent the products’ overall clean beauty standards, since there is no definition for clean beauty. Hence, a standardized scoring method that considers the aspects of clean beauty—safety, ethicality, and sustainability—from the perspectives of the manufacturer, consumer, and retailer is needed.
Through this study, we seek to understand the clean beauty trend among general consumers in Seoul, South Korea, as well as the attributes considered important in defining clean beauty. Moreover, we aim to introduce a statistical clean beauty index that incorporates safety, ethicality, and sustainability. The index has the potential to serve as a valuable tool for manufacturers, consumers, and retailers alike, facilitating comparisons and enhancing comprehension regarding the “cleanness” of cosmetic products.
Literature Review
The COVID-19 pandemic has had a drastic impact on cosmetic trends by affecting both skin conditions and social behaviors. The usage of facial masks to prevent the spread of COVID-19 became associated with variety of skin problems such as facial itching, contact dermatitis, acne, and redness (Al Badri, 2017; Battista et al., 2021; Szepietowski et al., 2020). Since then, consumers began to desire gentle, safe, and non-toxic cosmetic products that did not irritate the skin (Guinaugh, 2020; Lee & Kwon, 2022b; Park & Lee, 2022). This shifted and spread consumers’ preferences toward clean beauty. Thus, consumers experienced direct skin changes during the pandemic, while the general need for safe cosmetics and personal care products increased significantly.
Millennials and Gen Zers represent the current and future cosmetic market segment for manufacturers and retailers. Reports have predicted that the population share of Millennials and Gen Zers in the United States will be approximately 23.2% and 17.8% in 2021, respectively (Mintel, 2021b). Millennials and Gen Zers tend to spend more on cosmetic or personal care products for their beauty routines (compared with previous generations)—additionally, following beauty routines tends to decline with age, as personal health is prioritized over appearance for adults 45 years of age and older (Mintel, 2021a). This proves that Millennials and Gen Zers are a growing and influential consumer group, especially in the cosmetics industry. Interestingly, these two generations share similar decision-making patterns, as both are highly resourceful at obtaining information and show a greater preference for emotional benefits (Jílková & Králová, 2020; Staniewski & Awruk, 2022). Moreover, both generations are known for emphasizing value consumption and seeking a lifestyle that values sustainability, the protection of animals, and social contributions (Bilos et al., 2021; Dabija et al., 2020; Ordun, 2015). However, even though Millennials and Gen Zers share similarities, recent studies have highlighted the differences between them. Gen Zers are more likely to be more exploratory with their beauty routines and generally have less disposable income, compared with Millennials (Lee et al., 2021; Mintel, 2021b). These factors may influence where consumers shop and receive their information, and could drive do-it-yourself behaviors (Lee et al., 2021). As the future major consumer groups, it is important to assess Millennial and Gen Zers’ perspectives on clean beauty, while discriminating between young and older groups’ characteristics, to determine the attributes of clean beauty that are valuable to them.
Consumer groups’ cosmetic shopping behaviors have been analyzed extensively to understand the critical factors that affect purchase decisions or brand loyalty. As a trendy industry, stakeholders in the cosmetics industry heavily invest on identifying the rhythm of fashion and consumers’ changing preferences every year to predict their buying patterns (Anjana, 2018).
Previously, concerning cosmetics, their safety, ethicality, or sustainability were not prioritized, as consumers made purchase decisions based on brand value, product quality, attractive packaging, or reasonable prices (Anjana, 2018; Salim Khraim, 2011). Further, consumers typically purchased cosmetic products at brick and mortar stores. Omar (1999) emphasized that the store environment was considered one of the most important factors in retail marketing. However, nowadays, consumers’ purchase motivation and intentions show very different patterns, as they are heavily influenced by social media and frequently purchase cosmetic products on the internet (Alghamdi & Bogari, 2020; Pop et al., 2020; Tamara et al., 2021). Various cosmetic manufacturers and retailers have used social media to promote their brands or products through celebrities or social media influencers (Alghamdi & Bogari, 2020). Studies have reported that Millennials and Gen Zers are significantly influenced by celebrities or influencers when determining their attitudes or purchase intentions regarding beauty products, whether it is for green (i.e., sustainable) or cruelty-free products (Alaouir et al., 2019; Dalziel, 2019; Pop et al., 2020; Tamara et al., 2021). Millennials and Gen Zers show different shopping behaviors, compared with previous generations (Parment, 2013). Understanding consumers’ behavior patterns, especially for new cosmetic trends such as clean beauty, can help cosmetic manufacturers and retailers efficiently develop or sell products that are preferred by Millennials and Gen Zers.
Currently, clean beauty is a collaborative category defined by manufacturers, retailers, or social influencers. Popular clean beauty manufacturers advertise their product with a variety of attributes. Biossance, Youth To The People, and Dr. Bronner’s were some of the most popular clean beauty brands in 2021, according to Sephora, Forbes, and Olive Young (Constantino, 2021; Olive Young, 2021; Sephora, 2021). Biossance’s take on clean beauty includes saving sharks, banning over 2,000 ingredients that are known to be toxic to the skin and the environment, using recyclable and renewable packages as well as carbon-neutral shipping through a partnership with CarbonFund.org, and collaborating with international organizations that educate on environmental, social, and legislative issues (Biossance, 2021). Youth To The People creates vegan and cruelty-free products using ingredients from local suppliers; organizes funds that support the climate, gender and racial equity, and human rights; and partnered with Heinz and FSC-certified mills and printing presses to produce sustainable and recyclable packages (Youth To The People, 2021). Dr. Bronner’s products are made with organic and fair-trade ingredients; they also plan various sustainable projects, such as the regenerative organic farming project, as well as soil-enrichment and tree-planting programs (Dr. Bronner’s’s, 2021). Popular retailers, such as Sephora or Olive Young, have begun providing clean beauty emblems. Sephora has been issuing “Clean at Sephora” emblems to products that do not contain 50 specific ingredients, including parabens and mineral oils, since 2018 (Sephora, 2021). Similarly, since June 2020, Olive Young has been issuing “Clean Beauty” emblems according to their own standards, under which a product should not include 16 specific harmful ingredients. Along with the Clean Beauty mark, they also issue separate emblems that certify animal-protection brands or environment-friendly brands (CJ Newsroom, 2020). Moreover, celebrities have a strong impact on expanding clean beauty standards through their social status and beauty brands. For instance, Gwyneth Paltrow’s wellness, lifestyle, and beauty brand, Goop, introduces not only clean beauty skincare products, but also various objects that are closely related to wellness and lifestyle (e.g., beverages and dresses, and so on). Miranda Kerr’s eco-beauty brand KORA uses certified organic and natural products (KORA Organics, 2021). Thus, manufacturers, retailers, and influencers all adopt diverse but unified stances in marketing clean beauty, which can be categorized into safety, ethicality, and sustainability.
In sum, the attributes of clean beauty have not been clearly defined; however, through literature and market review, the most frequently mentioned concepts can be categorized into clean for the skin (safety), clean for the environment (sustainability), and clean ethically (ethicality) (Chin et al., 2018; Lee & Kwon, 2022a; Mora & Ross, 2021; Salim Khraim, 2011; Suphasomboon & Vassanadumrongdee, 2022).
Safety as an Attribute of Clean Beauty
The pandemic saw a significant surge in the sales of disinfectants, driven by heightened consumer awareness regarding the virus’s ability to survive on surfaces for extended periods (Suman et al., 2020). Concurrently, the pandemic’s uncertainty heightened the demand for safety and security in personal care products, including clean beauty cosmetics (Trend: The Impact of the Pandemic on “Clean Beauty”, 2021). Consumers typically expect clean beauty products to include only safe ingredients and organic or natural products. Talavera and Sasse (2019) reported that “safe for sensitive skin,”“gentle,” and “protects” were some of the most important attributes for skincare products, according to consumers. Avoiding toxic ingredients is essential because they are known to be absorbed through the skin and eventually enter the bloodstream following long-term exposure, potentially causing various side effects including skin allergies and heart disease (Akhtar et al., 2022; Shomar & Rashkeev, 2021). In a similar context, natural skincare is also highly associated with skin safety, as natural or organic cosmetics do not contain parabens or chemical preservatives (Rubin & Brod, 2019). Lee and Kwon (2022a) report that consumers prefer and use oral and topical herbal as a form of therapy. However, interestingly, recent studies state that natural or organic cosmetics have a higher potential of irritating the skin, as most common allergens are fragrances or botanical ingredients (Rubin & Brod, 2019; Tran et al., 2022). Considering safety, consumers focus on “free-from” claims or “dermatologically-tested” labels, which effectively confirm and advertise cosmetic products’ safety (Grappe et al., 2022).
Ethicality as an Attribute of Clean Beauty
Since the onset of the COVID-19 pandemic, various social concerns have emerged, including civil peace, climate action, economic growth, and gender equality (Barbier & Burgess, 2020). Clean beauty brands strongly advocate and market ethical consumption, while various studies have shown that consumers are willing to pay more for ethical products (Davies & Gutsche, 2016; Leary et al., 2019; Sheehan & Lee, 2014). Some ethics-related issues that are addressed by cosmetic companies include, but are not limited to, products being vegan and cruelty-free, as well as consumer altruism or brand philanthropy toward social and environmental causes (Lee, 2021; Magano et al., 2022). Veganism was originally described as a food consumption pattern that originated from the need to protect animals from unethical and cruel treatments, and protect the ecosystem from environmental pollution caused by livestock industries and harmful substances generated during the manufacturing and processing of materials (Lee, 2021). However, recently, veganism has expanded to a lifestyle that includes clothing and cosmetics (Lee, 2021; North et al., 2021). Vegan cosmetics and personal care products do not contain any animal-origin ingredients (North et al., 2021). The interest and purchase intention for vegan cosmetics has been increasing constantly, as consumers believe that such products are made with safe ingredients and that using them raises awareness (Lee & Kwon, 2022b). While vegan cosmetics emphasize the origin of their raw ingredients, “cruelty-free” claims refer to the materials and final products not being tested on animals (United States Food & Drug Administration, 2022). Cruelty-free brands are more positively received by consumers, who feel that those brands are more socially responsible (Sheehan & Lee, 2014). Additionally, direct or indirect engagement in ethical corporate actions are strong positive indicators for marketplace influences (Leary et al., 2019). For example, consumers focus on attributes such as “fair trade” or “country of origin” because they feel a sense of social justice by knowing that their money goes back to the producers (Davies & Gutsche, 2016).
Sustainability as an Attribute of Clean Beauty
Before the pandemic, the beauty trend focused on having multiple ingredients that could provide multiple skin efficacies; however, after the pandemic, “free-from” claims, which indicate that a product was created using only the essentials, have become more common (Lee & Kwon, 2022a). This “free-from” feature has expanded throughout products’ life cycle, which includes design, sourcing, manufacturing, packaging, distribution, consumer use, and post-consumer use (Fortunati et al., 2020; Lee & Kwon, 2022a). Parabens, triclosan, and microplastic particles are some of the cosmetic ingredients that are known to have negative environmental effects in the sourcing and manufacturing stages (Bilal et al., 2020). Bom et al. (2019) suggest various sustainable replacements for emollients, exfoliators, surfactants, solvents, colorants, fragrances, ultraviolet filters, preservatives, pH adjustments, chelating agents, and antioxidants. The development of sustainable packaging, such as rechargeable, returnable, or recyclable packages, can affect the packaging, consumer use, and post-consumer use stages of the product life cycle (Coelho et al., 2020; Fortunati et al., 2020). To provide confidence in sustainability, verified eco-labels are commonly used as a visual indicator that allows manufacturers to show consumers their commitment toward sustainability (Tang et al., 2004). Eco-labels are logos that convey information to consumers about the environmental implications of buying a product; they are known to have a positive effect on consumers’ purchase intentions (Rahbar & Abdul Wahid, 2011; Rashid, 2009).
Each key player in a cosmetic product’s life cycle (i.e., the manufacturers, retailers, and consumers) has an important role in determining the attributes of clean beauty. As mentioned, a cosmetic product’s life cycle can be categorized into seven stages: design, sourcing, manufacturing, packaging, distribution, consumer use, and post-consumer use (Bom et al., 2019). Manufacturers are involved in all stages of the product life cycle; for example, they design products to be environmentally friendly, source sustainable raw materials, manufacture products that reduce water consumption, package products in recyclable materials, distribute and transport products in a method that reduces CO2 emissions, commit to providing both health and social care for employees at the consumer-use phase, and pay attention to recycling, recovering, or reusing product waste (Fortunati et al., 2020). Retailers are typically more involved in the latter part of the product life cycle, that is, the distribution, consumer use, and post-consumer use phases. They can distribute products using methods that reduce emissions or provide clean beauty standards or logos that are easily communicable to consumers (Bom et al., 2019; Fortunati et al., 2020). Not only retailers, but also Global ISO standards, specifically ISO 16128-1 and ISO 16128-2, are available to measure the degree to which the cosmetic products are “natural” or “organic” (International Organization for Standardization, 2016, 2017). Once consumers purchase cosmetic products, they actively become a part of the final stages of the cosmetic product life cycle, during which they use the product and dispose the package. Consumers exhibit buying behaviors based on various factors, including brand or product familiarity, personal or social experiences with the product, prices, designs, etc. (Anjana, 2018; Salim Khraim, 2011).
Conceptual Framework and Hypotheses
Attitude, intention, and behaviors can be predicted by personal considerations and consumers’ values (Grappe et al., 2022; Weng & de Run, 2013). Prior studies have demonstrated that beliefs influence individuals’ attitudes toward objects, eventually affecting their behavior (Fishbein & Ajzen, 1974). Consumers who are concerned with skin safety and sustainability are known to show greater engagement with the skin-safety data of cosmetic raw materials, and they show confidence regarding the safety ratings of products’ ingredients, which are issued by third-party agencies, such as the Environmental Working Group (EWG), Hwahae, or Glowpick (Choi & Lee, 2019). Yamane and Kaneko (2021) report that younger generations demonstrate higher pro-sustainable behavior, compared with older generations. Moreover, younger generations have a stronger presence on social media and are highly equipped in using third-party agencies to receive safety information (Bilos et al., 2021; Jílková & Králová, 2020; Parment, 2013). Accordingly, we suggest the following:
Research on the clean beauty trend has demonstrated that consumers who purchase clean products buy them because they are safer, have high-quality ingredients, and are better for the environment (Mintel, 2021a). Conversely, those who do not purchase clean products do not buy them because they do not understand the benefits (Mintel, 2021a). Lee and Kwon (2022a) report that, since the pandemic, consumers’ key focus has been on safety. However, even though Millennials and Gen Zers share similar decision patterns, Gen Zers are more influenced toward ethical issues, such as cruelty-free characteristics, when purchasing cosmetic products (Bilos et al., 2021). Therefore, we posit the following:
Past studies have introduced calculators or indices based on product information to assess the sustainability of cosmetic products (Bom et al., 2020; L’Haridon et al., 2018). Bom et al. (2020) developed a sustainability calculator in which 23 professionals in the cosmetic and science fields rated specific parameters relating to the sustainable level of cosmetic products’ life cycle. The sustainability calculator was verified by comparing the evaluation scores between a sustainable and non-sustainable product. The calculator was designed so that products in development could be easily compared, which may allow manufacturers to identify certain product characteristics that need improvement to produce a more sustainable product. L’Haridon et al. (2018) also developed an eco-design instrument for calculating the biodegradability, gray water footprint, and global indicator complementary of cosmetic formulas. The three eco-design indicators aim to provide guidance for formulators to develop more eco-friendly products. Unfortunately, these methods do not hold any importance for the consumers, as they are aimed toward manufacturers. Therefore, we will include retailers and consumers’ perspective in generating an index for clean beauty.
According to Anjana (2018), consumers undergo a rigorous thought process when making their purchase decisions; however, brand loyalty is heavily influenced by emotional satisfaction levels (Choi, 2009). Consumer satisfaction is typically divided into two perspectives: cognitive and emotional (Bagozzi et al., 1999; Crites et al., 1994). From a cognitive perspective, satisfaction refers to the perception of distinct benefits, such as functional, social, symbolic, and experiential benefits, as well as products’ appearance (e.g., the perception of the value of the product) (Sondoh et al., 2007). Brand name, price, and design are cognitive qualities that influence consumers’ brand loyalty or purchase decisions (Salim Khraim, 2011). From the emotional perspective, satisfaction refers to a positive emotional state elicited by the consumption experience (Mano & Oliver, 1993). Manufacturers and retailers already understand that an essential aspect of marketing is to create an emotional link with customers (Zain-Ul-Abideen & Latif, 2011) and that consumers’ cognitive satisfaction concerning a product plays an important role in their first impression when selecting and purchasing a cosmetic product (Anjana, 2018). It is important to distinguish between cognitive and emotional satisfaction, as well as to account for each perspective when defining clean beauty.
We aimed to develop a new index, the Reliable Cleanness Score (RCS), which represents the overall emotional satisfaction level of a cosmetic product with regards to clean beauty through machine learning analysis. Prior studies have demonstrated that it is possible to predict emotional satisfaction levels through the development of structural equation models (Hayes et al., 2014). Most commonly, regression analysis has been used to develop equations for prediction (Apaolaza-Ibáñez et al., 2011). Furthermore, machine learning, a computational analysis of the complex relationships between parameters that cannot easily be interpreted by the human mind, has been used for various purposes in the cosmetic and skincare research fields for regression analyses or development of prediction models (Cho et al., 2022; Shim et al., 2019). Given the multitude of parameters, encompassing both quantitative and qualitative data, our belief was that machine learning would be the most effective approach for developing RCS. Important parameters for regression analysis were obtained from objective product information and cognitive customer reviews. Objective product information is considered from the perspective of the major groups who are involved in the cosmetic product life cycle: manufacturers, retailers, and consumers. Cognitive customer reviews represent cognitive satisfaction levels concerning specific clean beauty attributes. Following previous research on cosmetic sustainability equations and prediction of emotional satisfaction, our key prediction is as follows:
This study contributes to the field in three ways. First, we investigate the growing trend of clean beauty and clean beauty awareness in the younger generations, as they have not only lived through the pandemic but are the future core consumer group. Second, we identify clean beauty attributes from the perspective of consumers. Identifying the key clean beauty attributes may assist manufacturers in designing or producing future clean beauty products, help provide valuable insights for retailers to develop marketing ideas, and assist consumers in selecting clean beauty products and evaluating their own satisfaction levels. Third, we introduce a new machine learning-based index that represents the overall emotional satisfaction level with regards to clean beauty based on objective and cognitive product information. With this new index, manufacturers and retailers will be able to estimate how a product will be emotionally perceived by consumers in terms of its clean beauty before they actually use it. Consumers will be able to estimate their satisfaction levels on specific products, which may have an effect on their purchase intentions.
Materials and Methods
Participants
Participants for this study were selected from LG H&H’s pre-existing participant database, consisting exclusively of individuals who had previously engaged in either efficacy testing or questionnaire-based home-use-tests (HUT) conducted by LG H&H. By recruiting from this database, we ensured that all participants possessed a genuine interest in and regularly used cosmetic products. This study included 120 Korean participants (85 women and 35 men) in general good health, with no evidence of dermatological conditions or damage, living in Seoul, South Korea, who regularly purchased and used cosmetic products. As per Blaak et al. (2018), their recommendation of a minimum of 101 participants for questionnaire-based cosmetic HUT evaluations was met. The participants were identified as either Millennials (born between 1980 and 1995) or Gen Zers (born between 1996 and 2010) and classified into two groups. Table 1 details the participants’ demographic characteristics.
Demographic Data (N = 120).

Procedure
The study was performed in accordance with the Declaration of Helsinki and was approved by the Institutional Review Board of LG H&H (Approval no. LGHH-20210422-AA-03-01). Before participation, all subjects were informed of the aims of the study and provided their written informed consent.
The survey was carried out in three stages: (1) participant validation and clean beauty awareness evaluation, (2) cognitive product satisfaction evaluation, and (3) emotional product satisfaction evaluation. Different surveys were conducted at each stage. All questionnaires were answered on a 5-point Likert scale. Before using any cosmetic products, the participants were asked to complete the Clean Beauty Awareness Validation Questionnaire in Stage 1. In Stage 2, 10 commercial LG H&H products from different brands and varied product types—such as creams, serums, and essences—were selected (Table 2). Only products that fulfilled the Sephora and Olive Young’s Clean Beauty standards were selected for the study. The participants were provided information about the products they would be exposed to in normal cosmetic market settings, including a list of ingredients, product packaging information, global retail negative list, and skin safety test results (Table S1–S10). Product names were hidden from all participants to eliminate consumer bias. The participants answered a questionnaire regarding their cognitive satisfaction level before using the products. For Stage 3, each product was used for 1 week, followed by a 1-week rest period; the order of product usage was randomized. The participants were informed that they should add the test product to their regular cosmetic routine or replace a product with the test product, and that they were to use the product twice a day. After using the product for 1 week, the participants were asked to complete a questionnaire to determine their emotional product satisfaction level.
List of Test Products.

Selection of Clean Beauty Attributes
Clean beauty’s characteristics were divided into to three categories: clean for the skin (CS), clean ethically (CE), and clean for the environment (ES); each category was subdivided into three specific attributes. Thus, there were nine total clean beauty attributes, based on literature reviews and current clean beauty trend reviews (Table 3).
Clean Beauty Attributes.

Questionnaire Design
The questionnaires were specifically developed to fulfill the objective of this study, as they were not an attempt to adapt or expand on any other questionnaire available to date. The questionnaires used simple, common language to avoid confusion. All questionnaires were designed to be answered in a comparative manner on a 5-point Likert scale, ranging from 1 (“strongly disagree” or “not important at all”) to 5 (“strongly agree” or “extremely important”).
Survey Procedure
The survey was carried out in three stages.
Stage 1. The Clean Beauty Awareness Questionnaire was administered in order to validate participant qualification and survey clean beauty awareness (Table 4). Respondents’ demographic information (e.g., gender, age, education level, skin type, and skin concerns) (list of questionnaire not included) and level of clean beauty awareness of participants was collected.
Stage 2. In order to objectively survey respondents’ cognitive satisfaction levels with the studied cosmetic products, we administered the questionnaires in an environment as similar as possible to an actual purchasing environment by providing nearly as much product information as consumers are exposed to when purchasing and using products. Again, brand names were concealed to avoid potential bias. Without using the products and with only product information, the participants completed the Cognitive Product Satisfaction Questionnaire (Table 5).
Stage 3. On the last day of product usage (after 1 week), the participants were asked to complete the Emotional Product Satisfaction Questionnaire to determine their emotional satisfaction level with each product regarding CS (OSC), CE (OCE), ES (OES), and clean beauty agreement level (OCB) (Table 6).
Clean Beauty Awareness Questionnaire.
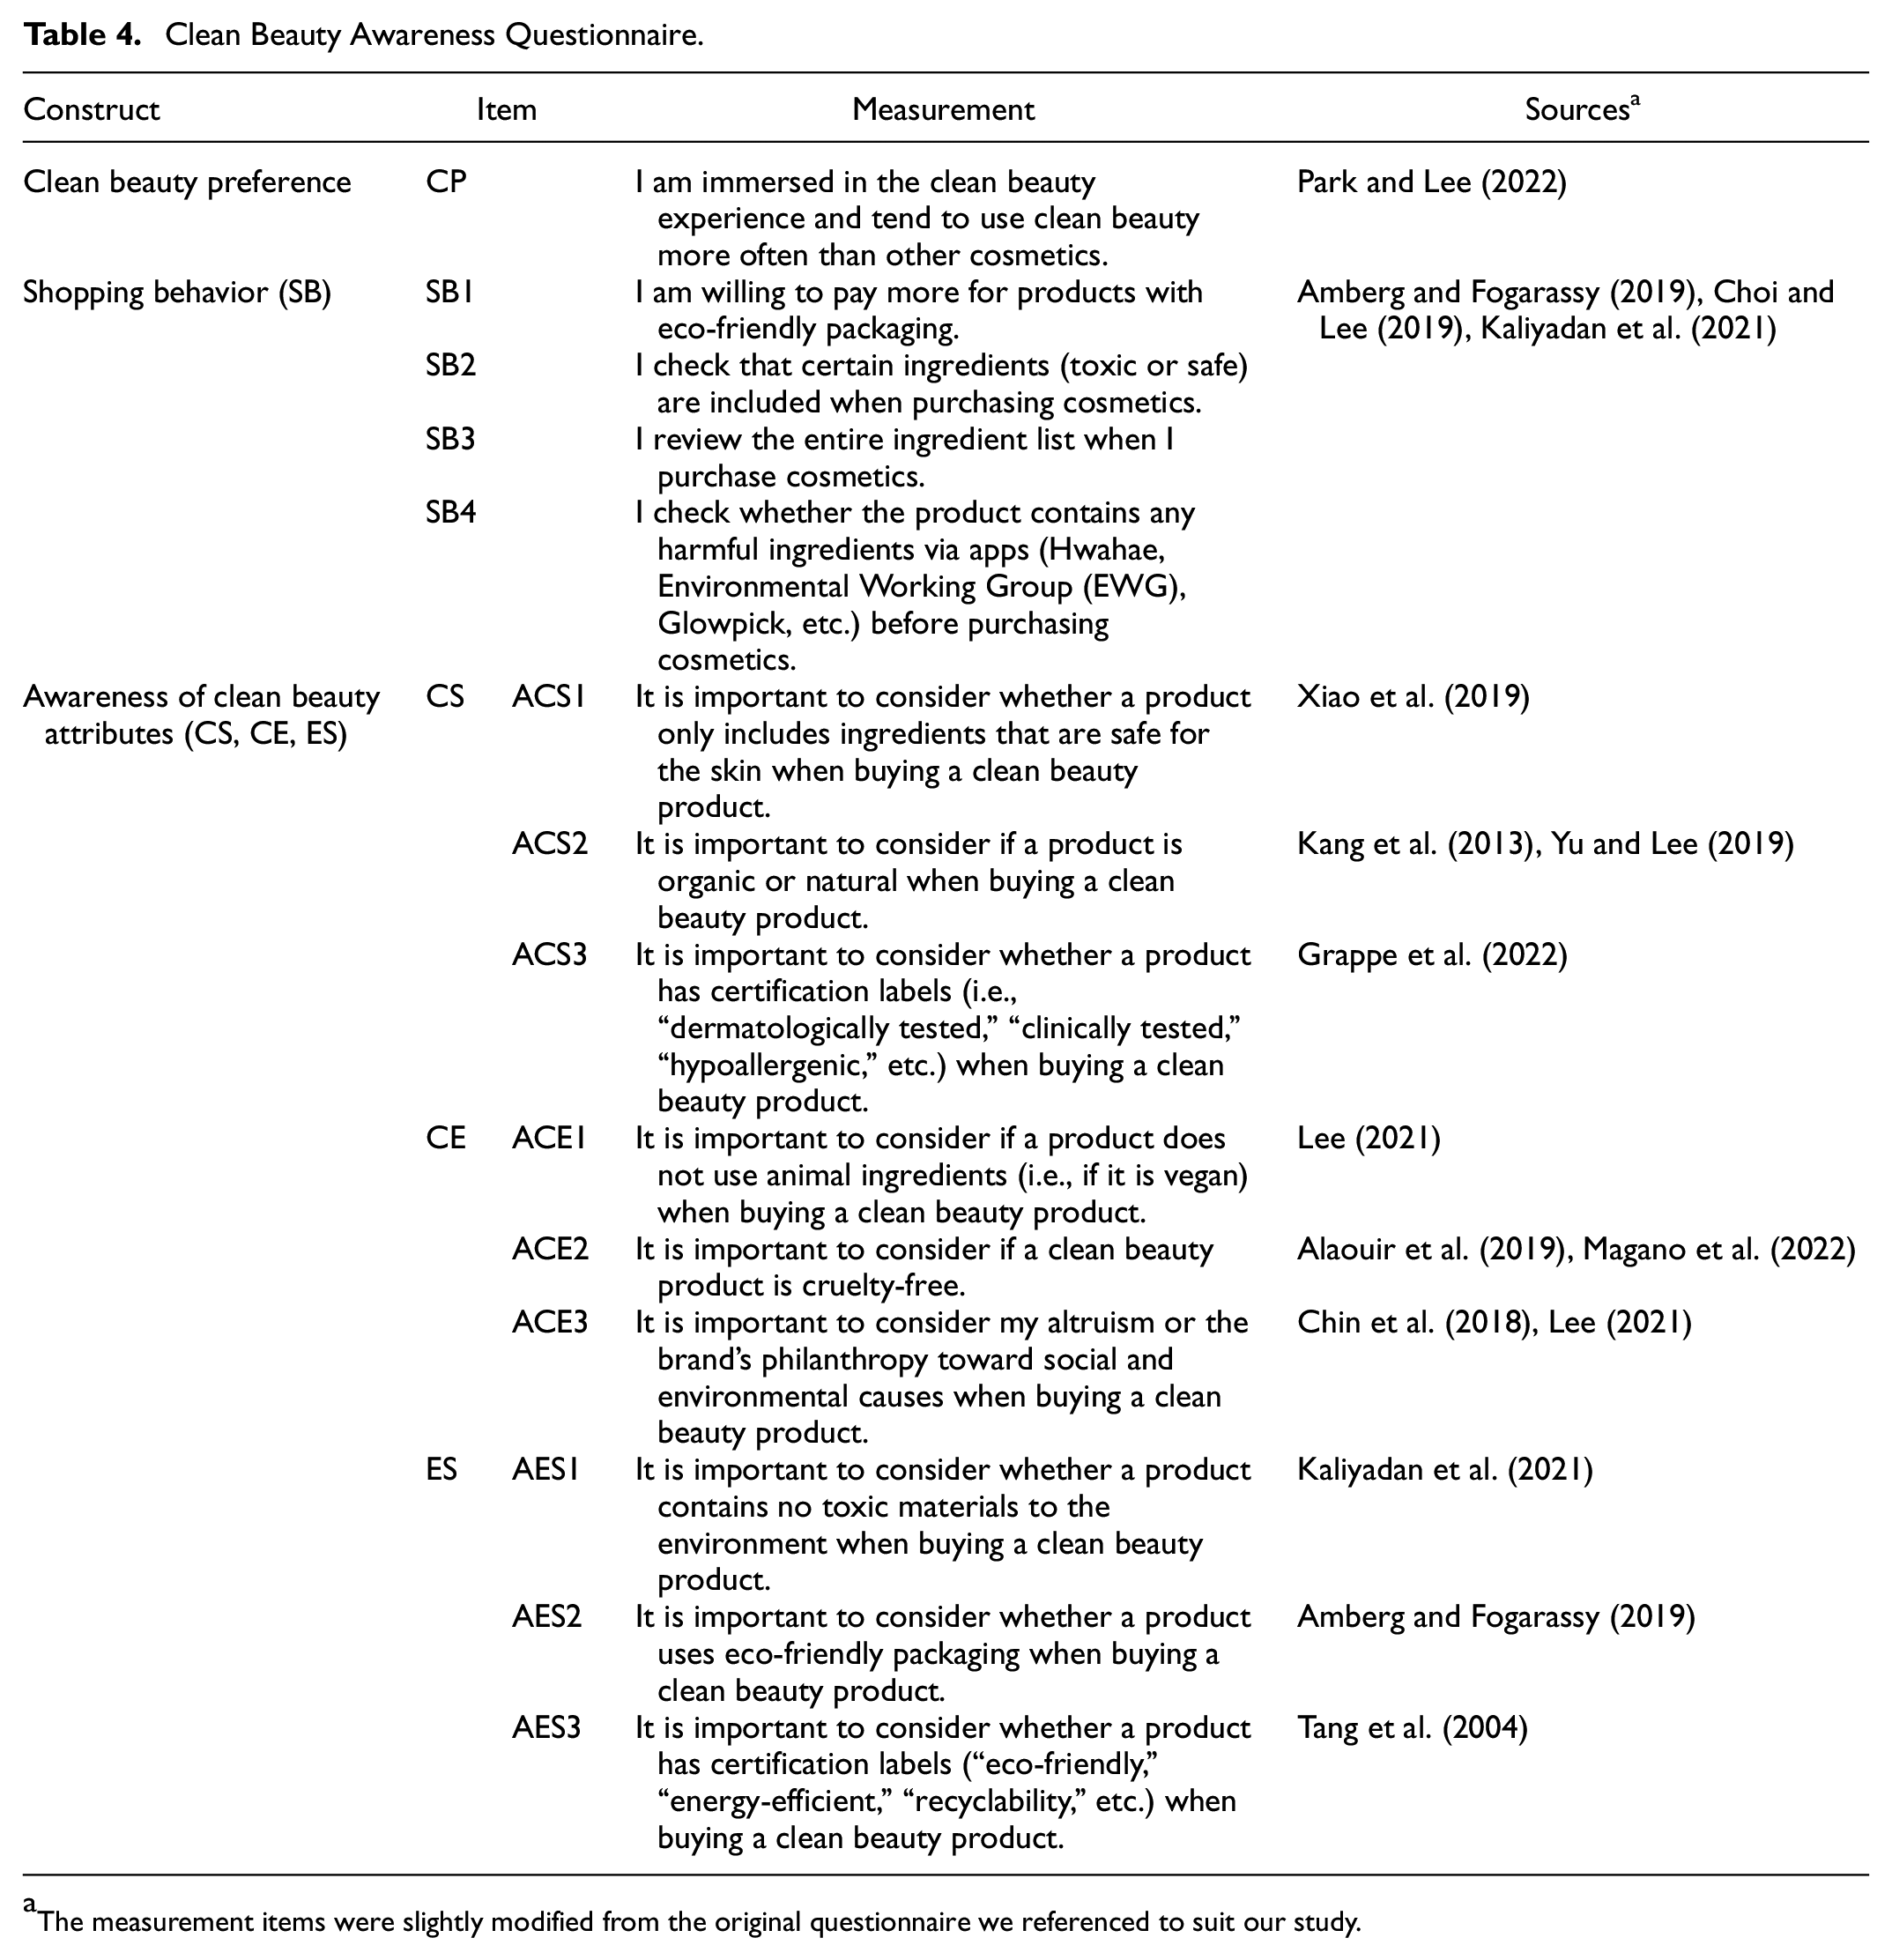
The measurement items were slightly modified from the original questionnaire we referenced to suit our study.
Cognitive Product Satisfaction Questionnaire.

The measurement items were slightly modified from the original questionnaire we referenced to suit our study.
Emotional Product Satisfaction Questionnaire.

Statistical Analysis
Jamovi statistical software, version 1.6 (The Jamovi Project, 2021) was used. The level of significance was set to 0.05. The positive response percentage was calculated for the responses rated 4 (“moderately agree” or “moderately important”) or 5 (“strongly agree” or “extremely important”). The Shapiro-Wilk test was used for the test of normality and a Mann-Whitney U test was used when comparing between younger and older groups’ survey responses. The Pearson coefficient was used for the correlation analyses.
RCS
The overall emotional product satisfaction level regarding clean beauty was calculated and newly defined as the RCS. The final RCS for each product and each participant was obtained from the average scores for OCS, OCE, OES, and OCB.
Machine Learning-Based Regression Analysis for the RCS
In order to determine whether the RCS can be calculated based on product information and cognitive product satisfaction levels, we performed a machine learning-based regression analysis. Ten parameters were considered from the point of view of the manufacturers, retailers, and consumers.
Five parameters with regard to CS, CE, and ES—from a cosmetic manufacturer’s point of view, were considered:
LG H&H’s Ingredient Safety Evaluation
Each product’s ingredient risk and safety level were evaluated by safety professionals based on prior researches and in-house safety experiments in order to represent the product’s safety at the micro-level (data not included).
Repeated Open Application Test Results (Day Seven)
An in-house repeated open application skin test was performed to confirm or rule out the presence of allergic contact dermatitis. Approximately 20 to 30 mg of the test products were applied on the elbow flex (antecubital fossa), on a 5 cm × 5 cm patch of skin, twice daily for 7 days. The day-seven results for the 10 products were used as the parameters for short-term product safety.
Human Repeat Insult Patch Test Results (Pass or Fail)
The human repeat insult patch test was performed to assess the safety and sensitization (contact allergy) of the test products. Human repeat insult patch test results were included as a parameter for long-term product safety.
Eco-Friendly Packaging Information (Present or Absent)
Eco-friendly packaging information was determined by whether the product’s package had a label or certification related to the environment. The presence of eco-labels such as the Forest Stewardship Council was included. The Forest Stewardship Council certification claims that certified products from responsibly managed forests provide environmental, social, and economic benefits.
Number of Animal Ingredients
The number of ingredients of animal origin were classified and counted. If no animal ingredients were included in the final product, the product was considered vegan.
Retailers’ perspectives were used as parameters with regard to safety and ethicality aspects based on popular retailers or regulations that are open to the public:
Number of Ingredients Included in the Global Retailer Negative List
Even though various retailers make a negative list of ingredients based on scientific references, Phan et al. (2021) reported that a single retailer’s list alone might be insufficient for consumers to rely on. Thus, a total of 83 substances were listed on the global retailer negative list based on the substances outlined in Sephora’s Clean Plus, Ulta Beauty’s Made Without List, Credo Beauty’s The Dirty List, Olive Young’s Clean Beauty, and LG H&H’s own negative ingredient list (Table S11).
Percentage of Natural Ingredient Included in Product
The percentage of natural ingredients included in the final product was calculated based on the natural origin index of ISO 16128, parts 1 and 2 (International Organization for Standardization, 2016, 2017).
Consumer perspectives were derived from the Cognitive Product Satisfaction Questionnaire in Stage 2 (Table 5). The average cognitive product satisfaction score was calculated by the three attribute scores in each category: ACS for clean for skin, ACE for clean ethically, and AES for clean for environment.
The individual clinical results of 1,184 were randomly divided into a learning set (70% of the results) and a test set (30% of the results). We applied a cross-validation model to avoid any possible unintentional selection bias while splitting the data. We analyzed the correlation between the observed and predicted values, as models are considered to fit the data well if the difference between observed and predicted values is small. The coefficient of determination (R2), which represents the predictive power of the model with a value between 0 and 1, was analyzed. An R2 of 0 means the model is random, while 1 means a perfect fit.
Results
Clean Beauty Awareness Data
All 120 participants completed the Clean Beauty Awareness Questionnaire. Among the participants, only 21.7% agreed that clean beauty strongly influenced their cosmetic product selection; however, 56.7% agreed that they were willing to pay more for eco-friendly packaging (Figure 1A and Table S12). Few of the participants reported that they usually checked for certain ingredients in cosmetic products (36.7%); however, more than half still looked over the entire ingredient list (56.7%). Only 15% reported that they used outside resources (e.g., Hwahae, EWG, and Glowpick) before purchasing cosmetic products. There was no significant difference between the younger and older group in CP, SB1, SB2, SB3, or SB4 (Figure 1A and Table S13). However, the younger group showed higher positive response percentages for CP1, SB1, SB2, SB3, and SB4 (Figure 1A and Table S12).
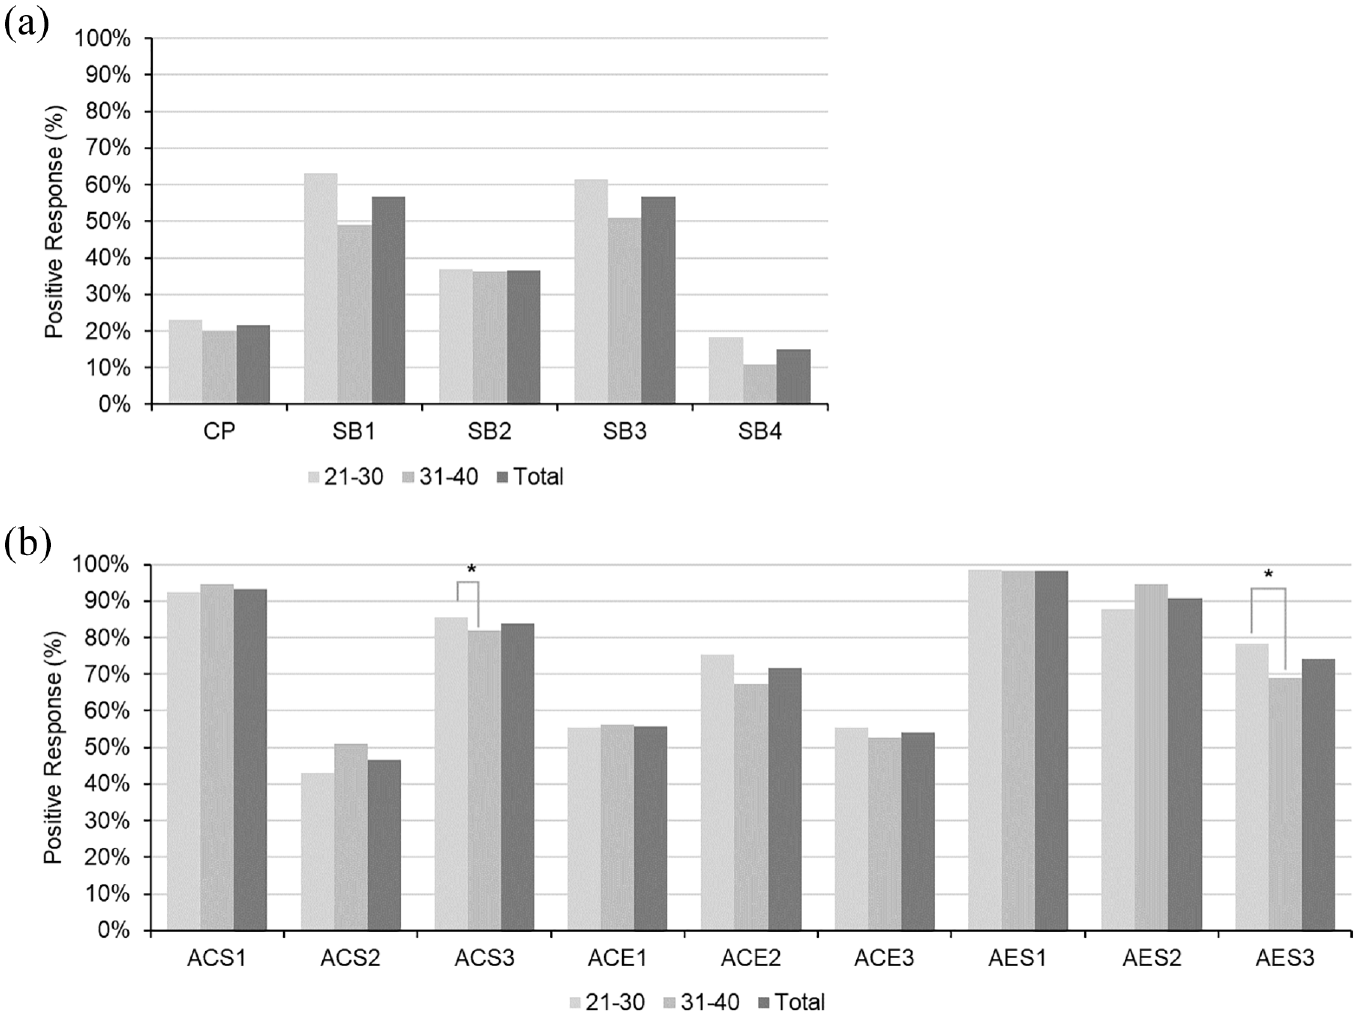
Positive percentage of Clean Beauty Awareness Questionnaire. Percentage of positive responses for: (A) preference for clean beauty products and agreement level of shopping behaviors and (B) agreement level of clean beauty attributes for the younger group (21–30) and older group (31–40).
The correlation of preference level for clean beauty and consumers’ shopping behavior was analyzed (Table 7). SB1 showed a moderate correlation (r = .516, p < .001) while a weak correlation was reported for SB2 (r = .19, p < .05) and SB4 (r = .26, p < .05). CP and SB3 did not have significant correlations. In addition, CP was analyzed by age, generation, gender, and education levels (Figure S1). There were no significant differences based on generation, gender, or education level; however, the clean beauty preference showed a slight downward trend as age increased (Figure S1). Gen Zers showed a higher level of preference for clean beauty; however, the number of participants was strongly skewed toward Millennials (Figure S1B).
Pearson’s r Correlation Concerning Preference for Clean Beauty and Consumer Shopping Behaviors.

Clean beauty attributes were arranged by order of importance: AES1 (98.3%), ACS1 (93.3%), AES2 (90.8%), ACS3 (83.8%), AES3 (74.2%), ACE2 (71.7%), ACE1 (55.8%), ACE3 (54.2%), ACS2 (46.7%) (Figure 1A and Table S12). Only ACS3 and AES3 showed a significant difference between the younger group and older group, as shown in Figure 1B and Table S13. However, ACS2 and ACE2 showed a p-value of .091 and .05, respectively.
Cognitive Product Satisfaction Questionnaire
Table S14 reports the percentage of positive responses on the Cognitive Product Satisfaction Questionnaire for the 10 cosmetic products.
Emotional Product Satisfaction Questionnaire and the RCS
The RCS for each product was averaged from OCS, OCE, OES, and OCD as shown in Table 8. The product 12-BS-20 received the highest RCS (3.75), while 07-SE-20 received the lowest score (2.62).
Average Scores for OCS, OCE, OES, OCB and RCS From the Emotional Product Satisfaction Questionnaire.

Machine Learning-Based Decision-Tree Regression Analysis for the RCS
The correlation between the selected 10 parameters and the RCS was examined in Table S15. All parameters showed significant correlation with the RCS; thus, they were used for the machine learning-based regression analysis.
Machine learning-based decision tree regression analysis for the prediction of the RCS with the selected 10 parameters was performed, and the results are reported in Figure 2 and Table 9. Observed RCS and the predicted RCS showed a very good correlation (r = .82, p < .001) (Figure 2). The cross-validated model of 10-folds showed that the R2 averaged .721, with a standard deviation of .044 (Table 9). Therefore, the decision-tree regression algorithm was successfully used to developing a regression model to predict the RCS.

Correlation between questionnaire-based RCS and machine learning-based decision tree regression-calculated RCS. The testing data (30% of 1,184) are plotted as dots, and the linear correlation was analyzed.
Cross-validated Results of Machine Learning-Based Decision-Tree Regression.

Discussion
This study aimed to assess the impact and awareness level of clean beauty among Millennial and Gen Z cosmetic consumers, discover the essential clean beauty attributes according to Millennial and Gen Z consumers, and provide a new scoring method for assessing the safety, ethicality, and sustainability of clean beauty products.
Few of the participants indicated that they were immersed in clean beauty (21.7%). However, we found a significant positive correlation between respondents’ clean beauty preferences and selective shopping behaviors SB1 (r = .516, p < .01), SB2 (r = .19, p < .05), and SB4 (r = .26, p < .01) (Table 7). This confirms that consumers who prefer clean beauty tend to exhibit stronger selective behaviors. Conversely, our results showed that consumers did not regularly review the entire ingredient list when purchasing cosmetics (SB3), even if they preferred clean beauty products. This may indicate that consumers who prefer clean beauty rely on information that is easily and visually comprehensible, such as certification labels and applications, rather than searching for each product’s ingredient list. Thus, H1 was partially supported. However, more than half of the participants indicated that they reviewed the entire ingredient list before purchasing cosmetic products (56.7%) (Table S12). We can assume that consumers who do not prefer clean beauty products tend to review the entire ingredient lists more than consumers who are immersed in the clean beauty movement.
Our results showed that there was no significant difference between the younger and older group regarding their preference for clean beauty or shopping behaviors (Table S13). Therefore, H2 and H3 were not supported. Our results indicate that even among different age groups in Millennials and Gen Z, they showed similar preferences and shopping behavior patterns regarding clean beauty products.
The order of importance among the nine clean beauty attributes was AES1 (98.3%), ACS1 (93.3%), AES2 (90.8%), ACS3 (83.8%), AES3 (74.2%), ACE2 (71.7%), ACE1 (55.8%), ACE3 (54.2%), and ACS2 (46.7%) (Figure 1B and Table S12). Two ES attributes (AES1 and AES2) and one CS attribute (ACS1) were in the top three (with over 90% positive responses), regarding their importance in defining clean beauty. One of each attribute from the three categories (ACS3, AES3, and ACE2) showed positive responses above 70%. Two CE attributes (ACE1 and ACE3) and one CS (ACS2) attribute were at the bottom three in their level of importance in defining clean beauty. We can generalize that the most important attributes are in the order of ES, CS, and CE; thus, H4 was not supported. When considering clean beauty attributes, consumers responded most strongly to attributes that focused on the environment, rather than on their own safety by either avoiding toxic ingredients or purchasing products with eco-friendly packaging. Among the CS attributes, only 46.7% of the participants agreed that using only organic or natural ingredients (ACS2) was an important factor for clean beauty. Our results suggest that consumers do not associate organic or natural ingredients with clean beauty as strongly. Furthermore, we can see that the cruelty-free property received the most positive response among the CE attributes. We can assume that consumers consider clean beauty to be associated with key issues (e.g., animal safety or animal well-being), rather than lifestyles or personal philosophies (e.g., veganism or altruism).
Among the nine clean beauty attributes, only ACS3 and AES3 showed significant difference between the two age groups, of which the younger group showed stronger importance for ACS3 and AES3, compared with the older group (Figure 1B and Table S13). The results show that younger consumers tend to consider safety and sustainability attributes more to be more important, compared with older consumers. Thus, H5 was not supported. Interestingly, both ACS3 and AES3 are attributes related to certification labels that indicate the product’s safety or sustainability. We can assume that younger individuals are more easily swayed by a product with certification labels and may become more receptive to it. A stronger positive response to certification labels was also observed from the results of the emotional product satisfaction questionnaire. Only the products 11-BS-20 and 12-BS-20 received high positive responses for eco-friendly packaging and sustainability certification labels (Table S14). Even though all products used recyclable packaging, only 11-BS-20 and 12-BS-20 displayed eco-labels (Forest Stewardship Council labels) on their packaging. None of the products had any certification labels related to ingredient or product safety; they merely displayed “dermatologically tested” or “non-comedogenic” on their packaging. We can assume that even without certification labels, such statements make consumers feel confident about products’ safety.
In addition, ACS2 and ACE2 showed low p-values (.091 and .05, respectively), which indicates a weak tendency for older groups to consider “organic or natural” features as important for clean beauty more strongly, compared with younger groups, who considered “cruelty-free” features to be important for clean beauty more strongly (Table S13). The younger group showed weaker importance responses for ACS2 and stronger importance responses for ACE2 compared to the older group. This may indicate that the consumers who are learning that natural ingredients are not always safe are more likely to be younger, whereas older consumers have a tendency to consider organic or natural ingredients to be important attributes of clean beauty. Also, we can assume that younger participants are more aware toward protection of animals, or value consumption in regard to clean beauty, compared with older consumers.
The correlation between the observed RCS and the predicted RCS was very strong (r = .82, p < .001) (Figure 2). Further, the cross-validated model of 10-folds showed that the R2 averaged .721 (Table 9). Therefore, H6 was supported. Based on these findings, consumers’ emotional satisfaction regarding clean beauty may be calculated based on cognitive and objective product information. With the confirmation of H6’s support, we can confidently assert that RCS can be computed using the 10 attributes that encompass safety, ethics, and sustainability. This enables us to assign an RCS value to each product, facilitating comparisons to gage their level of “cleanness.”
Implications
An interesting finding from this study was that Millennial and Gen-Z cosmetic consumers tend to merge different attributes together. Our results showed that the participants had a tendency to conflate the attributes “vegan” and “cruelty-free,” which, technically, are different features. All products were cruelty-free because of Korean cosmetic regulations, but the products that contained animal ingredients (i.e., not vegan) (02-DC-17, 03-WC-19, 05-GL-20, and 07-SE-20) received relatively low positive responses for their cruelty-free features, compared with other products (Table S14). Only the products that were both vegan and cruelty-free (01-CS-17, 06-SE-19, 11-BS-20, and 12-BS-20) received high positive responses for the cruelty-free factor (Table S14). This suggests that consumers are not fully aware of the actual meaning of cruelty-free cosmetic claims; however, they are becoming more educated with various resources available to date.
Although the natural skincare market has expanded, many recent studies have reported that natural products are likely to cause irritation, allergic contact dermatitis, or photosensitization (Jack et al., 2013; Kiken & Cohen, 2002; Tran et al., 2022). As organic or natural attributes received lowest positive responses (46.7%), our results suggest that consumers are now more educated about natural or organic products and their effects than they were previously. Thus, the need for clean beauty products to be natural or organic may decrease, eventually separating from clean beauty, as an individual cosmetic category. Therefore, natural or organic cosmetic brands should emphasize their products’ skin safety to their consumers through various skin-safety claims, such as “hypoallergenic,”“dermatologist tested,” or “clinically proven.”
Based on the results of this study, we were able to confirm that consumers who showed higher preference for clean beauty products demonstrated stronger engaged shopping behaviors. Since 56.7% of the participants positively responded that they read ingredient lists, manufacturers and retailers must note that promoting or marketing clean beauty products will require providing specific and readable product information or labels for the consumers to determine the product’s cleanness. Even though ethicality was considered the least important category for clean beauty, it is still an important factor for consumers to consider when choosing clean beauty products. Even though only 15% responded positively to using third-party applications for ingredient safety information, it can be suggested that third-party applications should expand their business areas to include the product or brand’s philanthropic deeds along with ingredient originality statements.
In addition, we suggest that manufacturers or retailers may be more successful in marketing clean beauty products by focusing on sustainability attributes. As mentioned, only 11-BS-20 and 12-BS-20 received high positive response for PES3 (74.4% and 74.6%, respectively). This indicates that even though the packages are recyclable, manufacturers should include eco-labels to obtain a strong and positive response from consumers. Manufacturers and retailers may utilize certification labels to promote their products that can build credibility or provide product safety information to consumers efficiently.
The RCS utilized in this study was significant in three respects: machine learning was used to generate a new scoring method for clean beauty products; safety, ethicality, and sustainability were accounted for in the design of the new scoring methods; and consumers’ perspectives were considered. No other study to date has utilized machine learning to develop a scoring method to assess cosmetic products’ clean beauty attributes. Also, most available databases or previous studies have focused only on one or two attributes in terms of safety, ethicality, or sustainability. We introduced a new scoring system that incorporated all essential clean beauty attributes identified by Millennial and Gen-Z consumers. Finally, the RCS considers consumers’ perspective through its inclusion of cognitive satisfaction levels as parameters in its regression analysis, whereas most extant cosmetic ranking or scoring databases are based only on objective product formulation or information. Consumers’ cognitive and emotional satisfaction level with the products were deliberately separated because customers’ satisfaction with cosmetic products is highly dependent on their emotional experience (Jeon, 2013). We considered that the cognitive satisfaction levels represented how the product was accepted by consumers strictly based on their appearance or information. We believe that incorporating consumers’ cognitive satisfaction levels as parameters for calculating the RCS is vital because cosmetic products are designed for, sold to, used by, and reviewed by consumers. This study is the first attempt to develop a regression model with both objective and cognitive safety, ethicality, and sustainability product information.
The RCS, developed specifically for this study, provides manufacturers with objective indicators for the development of safer, more reliable, and sustainable products; retailers and consumers will gain greater insight into how to feel more satisfied about their choices for clean beauty products. This scoring system combines all key attributes of clean beauty, rather than just one category. Manufacturers may input product information for newly designed clean beauty products to predict consumers’ emotional satisfaction level. Additionally, consumers may use the RCS to review a product’s safety, ethicality, and sustainability score, and use that information to decide whether they want to purchase a specific product. The results indicate that manufacturers, retailers, and consumers are all key stakeholders that can affect the emotional satisfaction level associated with clean beauty products, and all aspects of said satisfaction level must be considered when developing a clean beauty product that will result in a high RCS.
Limitations and Future Studies
This study has several limitations. First, the study was conducted in a partially controlled setting. Consumers are typically exposed to product names or flyers that introduce the cosmetic product in actual settings, thus it cannot be said that the setting fully replicated the market. Second, the study scored 10 clean beauty products from the same manufacturer. Even though all products fulfilled Sephora and Olive Young’s clean beauty standards, it is necessary to compare the results with products that are not considered clean beauty products. A comparison of the RCS between clean beauty products and non-clean beauty products will need further attention. Also, to eliminate bias, the participants received the products in a container that did not include the products’ name or actual packaging. Because consumers’ purchase decisions are significantly influenced by visual cues like efficacy claims or packaging, replicating the market without the physical containers and packages fails to capture the complete consumer experience. In addition, this study’s participants cannot represent the cosmetic consumer group because they were merely selected based on age and interests for cosmetics. This study’s sample comprised only 120 participants who were mostly women and highly skewed in age. All participants had at least obtained a college degree, indicating that the sample had an overall high education level. A larger sample with a more varied age range and a more balanced gender ratio must be included in future studies to examine the clean beauty trend and consumers’ awareness level, cosmetic shopping behaviors, and the clean beauty attributes they consider important. Male consumers are known to use cosmetic products less frequently and do not have a specific routine, compared with female consumers. Thus, it would be interesting to explore only male consumers’ point of view regarding clean beauty products. Moreover, only 21.7% of participants indicated that they had strong preferences for regularly using clean beauty products (Table S13). Surveying participants who are highly engaged in using clean beauty products may yield different results vis-à-vis the importance of clean beauty attributes. Thus, further research with a different group of participants is needed.
Additionally, since clean beauty is described by only nine attributes, it cannot be said conclusively that every element of clean beauty is included in such a description. Many cosmetic brands make philanthropic promises to protect society or the environment. The degree of ethicality, that is, how much support or promise is enough for consumers to consider a particular product or brand to be considered clean was not examined in this study. The addition or substitution of clean beauty attributes is possible to further enhance the predictive power of the machine learning-based regression model.
Supplemental Material
sj-docx-1-sgo-10.1177_21582440241255430 – Supplemental material for The Clean Beauty Trend Among Millennial and Generation Z Consumers: Assessing the Safety, Ethicality, and Sustainability Attributes of Cosmetic Products
Supplemental material, sj-docx-1-sgo-10.1177_21582440241255430 for The Clean Beauty Trend Among Millennial and Generation Z Consumers: Assessing the Safety, Ethicality, and Sustainability Attributes of Cosmetic Products by Jiyong Shim, Jung Woo, Hyerin Yeo, Sujin Kang, Boseong Kwon, Eui Jung Lee, Jooyoung Oh, Euitaek Jeong, Junman Lim and Sun Gyoo Park in SAGE Open
Footnotes
Acknowledgements
We thank Hyeok Jun Shin, Miyeon Eo, Woo-Hyuck Choi, Mun Eok Park, and Seung Eun Kim for their assistance with the research.
Declaration of Conflicting Interests
The author(s) declared the following potential conflicts of interest with respect to the research, authorship, and/or publication of this article: All authors are employees or contractors working for LG H&H, Seoul, South Korea.
Funding
The author(s) disclosed receipt of the following financial support for the research, authorship, and/or publication of this article: The clinical studies presented in this article were funded by LG H&H.
Ethics Approval Statement
The study was performed in accordance with the Declaration of Helsinki and approved by the Institutional Review Board of LG H&H (approval no. LGHH-20210422-AA-03-01).
Data Availability Statement
Data available upon reasonable request due to privacy/ethical restrictions
Supplemental Material
Supplemental material for this article is available online.
References
Supplementary Material
Please find the following supplemental material available below.
For Open Access articles published under a Creative Commons License, all supplemental material carries the same license as the article it is associated with.
For non-Open Access articles published, all supplemental material carries a non-exclusive license, and permission requests for re-use of supplemental material or any part of supplemental material shall be sent directly to the copyright owner as specified in the copyright notice associated with the article.