
Abstract
While much of the studies within the Uses and Gratifications (U&G) tradition were set to predict facets of media use, the current study examines how use motivations, nature of platform use, and privacy-related perceptions predict users’ use continuance intentions for Facebook, Instagram, Twitter, and TikTok and their problematic use (i.e., addiction), simultaneously. The study uses a cross-sectional survey of undergraduate students at a large Midwestern University (N = 685), where participants expressed their motivations to use each of the four platforms (depending on their active use of the platform), platform affinity and other usage factors, their intentions to continue using the platform, and their problematic use of the platform. Findings showed superiority of Instagram in terms of U&G. Regression models highlighted differences in the four platforms’ problematic use and continuance intentions. Findings are discussed within the framework of reconceptualizing U&G outcomes within the evolving social media environment.
Plain Language Summary
The current study reports differences and commonalities in the uses and gratifications of Facebook, Instagram, Twitter, and TikTok among a sample of college students. Our findings showed significant differences in how college students use the four platforms and why they use them. Instagram took the lead in terms of use and motivations for using the platform. Additionally, our regression analyses showed that each platform was predicted by a different set of motivations, as well as different patterns of association with privacy-related factors, where trust was key in predicting platform use continuance intentions.
Keywords
As of early 2023, there are 4.76 billion people worldwide who use social media (Data Portal, 2023). This means that 6 in every 10 individuals around the globe use social media for an average of 2.5 hr a day, where most usage occurs over mobile phones (Data Portal, 2023; Kemp, 2021). Data Portal (2023) reports that there are 2.96 billion Facebook users, 2 billion Instagram users, 1.05 billion TikTok users, and a potential ad reach to 556 million active users on Twitter. The proliferation of social media and social networking sites (SNSs) has changed how we communicate and conduct our digital and offline lives. Whether to stay connected to family and friends, be informed about local, national, and global issues, or simply distract ourselves with cat videos and memes, social media have influenced numerous aspects of daily life for billions around the world and more than 7 in 10 adults in the United States (Auxier & Anderson, 2021).
The socio-political, economic, and health impacts of social media have been widely documented. Nonetheless, our lives have significantly changed amidst growing social media adoption and use. This is not to say that humans have evolved to new facets of livelihood, but rather that the mechanisms and channels of conducting aspects of human life have certainly changed by those continually evolving and adaptable sociotechnical systems. Luckett and Casey (2016) used a biological analogy to understand social media’s structure and evolution. Much like a biological organism, social media, Luckett & Casey (2016) argue, have a cellular structure (e.g., networks of friends and followers), they metabolize, grow both in size and complexity, yearn for homeostasis, respond to stimuli within the organism, reproduce, and, most importantly, adapt and evolve. The notion of distributed networks that govern social media platforms and social networking sites (and much of the Internet) can be used to explain the role such systems play in users’ lives (Luckett & Casey, 2016). System designers are not message creators, users themselves are generators of social media content, as well as each system’s modus operandi that rests upon collective, adaptive, and evolving usage. This sheds light on how sociotechnical systems reflect Mcluhan’s (1964) notion that media and technology extend human thinking, much like the pen is an extension of the hand, social media are extensions of our consciousness.
Part of documenting and understanding how sociotechnical systems adapt and evolve as distributed networks of individuals and their cognitions and emotions is understanding how and why users actively use those platforms to gratify a multitude of needs. The current study examines the evolving uses and gratifications of four leading social media platforms: Facebook, Instagram, Twitter, and TikTok. We focus on two outcomes: problematic use and use continuance intentions. While we primarily look at how motivations to use a platform predict use-related outcomes, we also explore how privacy-related perceptions contribute to these outcomes.
Theoretical Framework: The U&G Approach
Despite extensive critique of the U&G theoretical approach, it remains a necessary framework to understand why and how media users select, use, and engage with different media channels and media-related activities. The proliferation of social media platforms and SNSs has accentuated certain assumptions of the U&G framework due to the nature and use of such sociotechnical systems. U&G rests on five major assumptions: (a) audience members are active and goal-oriented in how they select and use media; (b) media use and selection emerge to gratify users’ needs; (c) as media satisfy needs, they compete with other need-satisfying sources; (d) media users are aware of their interests and motives and thus, develop expectancies for need gratification as a function of media selection and use; and (e) media users continually assess the quality of media, which in turn informs their selection and use based on how well their needs have been gratified (Katz, 1959; Katz et al., 1973). As media gratify basic social, psychological, and physiological needs, U&G considers psychosocial individual differences, media use motivations (e.g., information, entertainment, surveillance, personal relationship, identity, and diversion, among others), and media use effects or consequences (Katz et al., 1973; Papacharissi, 2008; Rosengren, 1974) to better understand the mechanism of media selection and use.
The U&G approach has been critiqued for (a) conceptual ambiguity of motivations, needs, and uses; (b) lack of uniformity in measuring media use and heavy reliance on self-reports; (c) problematic assumption related to awareness of needs by users and being too individualistic while disregarding other contextual and cultural influences; and (d) limited explanatory power (Rayburn, 1996). Despite these critiques, adopting a U&G framework to document how sociotechnical systems evolve and are used by individuals is an important empirical question. The social media environment has resolved and could potentially further resolve certain challenges within the U&G approach (e.g., active selection and use, resolving measurement issues with server-based data, etc.). Additionally, as Ruggiero (2000) postulated, new media channels ushered a new wave of alternative and/or expanded motivations that pave the way for need gratification as a function of media selection and use.
Papacharissi and Rubin (2000) discuss the unique nature of Internet-based communication channels, especially as they offer synchronous and asynchronous two-way (as well as one-to-many and many-to-one) communication. In contrast to traditional media channels (e.g., TV, radio, print), communicating via the Internet and different sociotechnical systems entails a unique function of further integrating users’ sense of self into the process of media selection and use. Papacharissi and Rubin (2000) leveraged computer-mediated communication (CMC) models to explicate nuances of Internet-based U&G by delineating unique features related to the potential impact of social presence and media richness warranted by Internet-based communication channels; namely highlighting how the lack or presence of non-verbal cues impacts CMC.
Papacharissi and Rubin (2000) identified three classes of factors (variables) examined in Internet U&G studies. First, they highlighted multi-level motives, including interpersonal, media-fulfilled, and other needs gratified by using the Internet. The second class of factors deals with “social/psychological antecedents and perceptions” (p. 180), including contextual age, unwillingness to communicate, and media perceptions. The third class deals with “behavioral and attitudinal outcomes” (p. 181), which includes Internet use, medium affinity, and satisfaction constructs. Together, these three aspects of Internet use decipher variability in use of the Internet and other digital technologies. The next section expands on U&G’s adaptation to the context of social media.
Examining Social Media U&G
Not all social media platforms are created equal in terms of access, affordances, adaptability, and evolution. The ability to access the same platform across multiple devices, we argue, potentially impacts platform U&G. While most platforms share certain affordances (i.e., ability to communicate with other users, communicating via multi-modal content including text, pictures, and videos, engagement with others’ content), the salience of such affordances vary considerably across platforms. For example, all platforms subject of the current study enable users to communicate with their friends and followers using both text and visuals and enact engagement behaviors (e.g., like, comment, and share). However, looking at the specifics, Instagram is a primarily visual platform with text-based communication is secondary to visuals. In contrast, Facebook affords users the ability to communicate via multiple modalities, where written posts are salient as much as other modalities. Although Twitter allows for linking visuals, it is primarily used as a text-based platform. Finally, TikTok revolves around audiovisual video-based communication. These differences in affordances and the salience of affordances warrant differences not only in the salience of motives and uses of each platform, but also how such motives and uses manifest themselves within the platform and beyond as they adapt and evolve.
Alhabash and Ma (2017) compared U&G of Facebook, Instagram, Twitter, and Snapchat, and documented similarities in time spent daily on Instagram, Snapchat, and Facebook, respectively, in comparison to Twitter. They also showed that use intensity (i.e., platform affinity) were similar and higher for Instagram and Snapchat, compared to Facebook and Twitter, respectively. Entertainment and convenience motives were the highest-rated motives across platforms, where the entertainment motive was the strongest predictor of use intensity (medium affinity). Despite these commonalities, we warn against generalizing the nature of gratification from each platform without qualifying such findings with qualitative insights that describe how a motive like entertainment manifests itself differently across platforms. This is certainly a limitation of quantitative survey-based studies related to U&G, which the current study, unfortunately, does not adequately address.
In the current study, we primarily focus on four platforms: Facebook, Instagram, Twitter, and TikTok. We opted to focus on TikTok instead of Snapchat in the current study due to industry reports and informal anecdotal evidence from college students regarding the decline in Snapchat usage at the time of the study, especially after Instagram adopted features similar to those that distinguished Snapchat (e.g., Instagram stories; see Fitzgerald, 2018; Hutchinson, 2019). In addition, recent research supports the popularity of TikTok among users with continued growth expected, not only among individual users but also by advertisers and marketers (i.e., Medina Serrano et al., 2020; Meola, 2020; Omar & Dequan, 2020). Next, we highlight U&G-related available research across the four platforms. Specifically, we grouped the U&G research into four themes: (a) motivations predicting general use; (b) motivations predicting specific/specialized use; (c) psychological outcomes and antecedents; and (d) privacy-related factors. It is worth mentioning that there are few studies on TikTok, thus the subsequent review does not include much TikTok research.
Motivations Predicting General Use
Studies in this thematic area varied in terms of the nature of measured outcome variables representing use intensity (or medium affinity), use frequency (e.g., time), to continuance intentions. Hossain (2019) tested a measurement model with several Facebook use motivations (labeled UGT) and found that greater motivations to use Facebook, in general, had a direct and positive association with usage intentions, mediated by habit and subjective norms. In an earlier study, Quan-Hasse and Young (2010) contrasted motivations to use Facebook and instant messaging applications and found that using Facebook was motivated more by entertainment and social connections motives, while instant messaging use was centered more on maintaining and developing relationships. Alhabash et al. (2012) looked at Facebook use intensity and content generation behaviors as criterion variables for several Facebook-specific motivations (e.g., social connections, photographs) and found differences in how each outcome is predicted (with a sample from Taiwan). In contrast, Alhabash and Ma (2017) showed that entertainment motive was the strongest predictor of Facebook use intensity. Kircaburun et al. (2020) examined how different social media motives predicted problematic use of Facebook, Twitter, Snapchat, YouTube, Google, Instagram, and WhatsApp. Liu et al. (2010) classified Twitter gratifications into content (information and self-documentation), social (social interaction), process (entertainment, passing time, and self-expression), and technology (medium appeal and convenience), where content and technology gratifications positively predicted user satisfaction, which in turn predicted tweeting continuance intentions. In a more recent study examining the motives for using TikTok, Omar and Dequan (2020) found that TikTok was mainly used to archive users’ content and the content of other users to fulfill self-expression and for social interaction needs. Further, participants were more likely to contribute to others’ work or produce their own than they were to passively consume other users’ content.
Predicting Specialized Social Media Use
The second group of studies looked at specific content types and behaviors on social media platforms. Dolan et al. (2016) used the U&G theoretical approach to explicate predictors of social media engagement behavior geared toward marketing and advertising activities. Dolan et al. (2016) argue that while, traditionally, U&G studies were focused on active media selection and use, the proliferation of social media resulted in more narrowly focused outcomes, such as engagement with a company via social media. Examining specialized use-related outcomes is an emerging extension of the U&G framework. A number of studies examined engagement with brands via social media platforms (see Pelletier et al., 2020), including investigations of engagement behaviors on brand-related Facebook communities (F.-H. Huang, 2013), engagement with luxury brands on Facebook, Instagram, and Twitter that was predicted by aesthetic appreciation and entertainment needs (Apthwal et al., 2019), and specific engagement behaviors toward persuasive messages (e.g., likes, shares, and comments; Alhabash & McAlister, 2015).
Another set of studies within this theme examined how use motivations/gratifications predicted specific behaviors and features within social media platforms, such as sharing links on Facebook (Baek et al., 2011) and use features of status updates, comments, wall posts, private messages, chat, and groups (Smock et al., 2011). Macafee (2013) investigated how different Facebook use motivations predicted specific activities related to the 2012 U.S. Presidential Elections within the context of political activities on the platform. Ko and Yu (2019) found that entertainment, passing time, bridging social capital, and information value motives predicted intentions to continue using the Instagram “Stories” function. Studies of Twitter showed that use motivations predicted specific behaviors, such as following TV news personality (Greer & Ferguson, 2011), tweeting, and connecting with others (G. M. Chen, 2011). Regarding TikTok, Scherr and Wang (2021) found that “socially rewarding self-presentation, trendiness, escapist addiction, and novelty” were important and distinctive motivations for TikTok across different times of the day (p. 1), while Omar and Dequan (2020, p. 125) emphasized the importance of “social interaction, archiving, self-expression, escapism, and peeking” as predictors of TikTok usage.
Psychological Differences and Outcomes
The third thematic group of studies assessed U&G as a function of psychological individual differences. Within this group, studies regarded psychological individual differences as antecedents to motivations and uses and examined psychological constructs, including motivational reactivity (Alhabash et al., 2014), personality traits such as the Big-5 (e.g., Kircaburun et al., 2020; Marengo et al., 2020; Siedman, 2013), and specific traits like narcissism (e.g., Barry et al., 2019; Sheldon & Bryant, 2016). One of the few studies on TikTok found that personality traits did not significantly predict TikTok use, but rather archiving and self-expression motives positively predicted TikTok use (Omar & Dequan, 2020). Another group of studies regarded social media U&G as antecedents to psychological outcomes, including: belonging and satisfaction (N. Park & Lee, 2014), loneliness (as a function of Instagram and Twitter use; Pittman & Reich, 2016), psychological well-being (motivations as moderators for the relationship between Facebook use and well-being (Rae & Lonborg, 2015), self-perceptions related to Instagram U&G (Apodaca, 2017), Twitter and Instagram U&G predicting sense of community (Blight et al., 2017), and perceptions of social capital (e.g., Phua et al., 2017a, 2017b).
Privacy Factors
Finally, the fourth thematic area of studies examined the relationship between U&G and privacy-related factors. H.-T. Chen and Kim (2013) theorized that privacy concerns moderated the relationship between SNS motivations and problematic SNS use. Spiliotopoulous and Oakley (2013) showed that shared identities motive positively predicted privacy attitudes and behaviors, whereas content-related motives predicted only privacy behaviors (e.g., changing privacy settings). Waters and Ackerman (2011) differentiated motivations for using Facebook as a function of privacy-related behaviors (i.e., disclosure of private information), where users who disclosure private information (compared to those who do not) scored higher on information sharing, entertainment, keeping up with trends, and showing off motives. Kim (2016) found that while privacy concerns did not significantly predict Facebook use motivations, privacy-related behaviors (i.e., location check-ins) differentiated Facebook use motivations.
The Current Study
The current study focused on problematic use and use continuance intentions of Facebook, Instagram, Twitter, and TikTok. Despite ambiguous and inconsistent conceptual definitions (see Bányai et al., 2017), problematic social media use (or social media addiction) refers to the excessive use of social media that is associated with cognitive, behavioral, and affective symptoms. Bányai et al. (2017) identified six aspects of problematic social media use, including: “mood modification, salience, tolerance, withdrawal symptoms, conflict, and relapse” (p. 2). Andreassen et al. (2012) conceptualized Facebook addiction within the context of reward and punishment sensitivity. Both concepts were closely tied as they explicate the nature and consequences of excessive use in terms of actual time, as well as the cognitive and affective psychological attachment to a platform. The second outcome, platform continuance intentions, was used as a measure of users’ planned behavior (intentions) to continue using the platform in the future.
To predict both outcomes, the study investigated the association with four different conceptual classes. Per prior studies (e.g., Y. T. Huang & Su, 2018), we examined the relationship between demographic indicators (e.g., gender identity, age, class standing, ethnicity/race, income), on one side, and problematic use and continuance intentions, on the other. Second, we looked at platform use patterns, particularly medium affinity (or the perceived importance and cognitive and affective perception of the platform; Papacharissi & Rubin, 2000) with a conceptual adaptation from Ellison et al. (2007) as well as network-related factors (number of friends/followers) and the estimated daily time spent on the platform. Third, using Papacharissi and Rubin’s (2000) study, we conceptualized social media motivations as “general dispositions that influence people’s actions taken to fulfill a need or want” as relevant to using each of the social media platforms in our study. Finally, the fourth class of predictors involved privacy-related factors: privacy awareness is defined as “the attention and understanding of an individual with respect to various aspects of privacy” on a given platform, privacy-seeking behavior as the “actions users get involved in to safeguard their information,” privacy concerns or risks, which are defined as a “user’s concern about his/her information privacy” on the platform, and trust, which deals with “one’s willingness to depend” on the platform (Malik et al., 2016, pp. 368–369).
The first objective of the study was to unravel platform-level differences in U&G, as well as privacy-related factors. To this end, we asked:
RQ1: How do participants differ in their (a) uses, (b) motivations, (c) privacy-related factors, (d) problematic use, and (e) continuance intentions for Facebook, Instagram, Twitter, and TikTok?
The second objective of our study dealt with examining the salience of social media motivations across platforms. Given past findings (e.g., Alhabash and Ma, 2017) indicating that entertainment and convenience motives were the highest rated for different social media platforms, we hypothesized:
H1: Participants will rate entertainment as the highest motivation to use (a) Facebook, (b) Instagram, (c) Twitter, and (d) TikTok?
The third objective of our study was to examine the predictive associations of demographics, platform usage patterns, motives, and privacy-related factors, on one side, and both outcomes of problematic use and continuance intentions, on the other. Thus, we asked:
RQ2: How do demographics, platform usage patterns, motivations, and privacy-related perceptions predict problematic use of Facebook, Instagram, Twitter, and TikTok?
RQ3: How do demographics, platform usage patterns, motivations, and privacy-related perceptions predict use continuance intentions of Facebook, Instagram, Twitter, and TikTok?
Method
Design and Participants
The current study used a quantitative online cross-sectional survey of college students (N = 685) who were recruited through an online subject pool at a large Midwestern University. The research follows a postpositivist approach to inquiry. The study was determined exempt by the university’s IRB, given that the research entails surveying consenting adults (college students) who volunteered to participate in the study anonymously. Participants’ age averaged 21.36 (SD = 2.99). Most participants identified as female (60.73%), followed by male (38.69%), gender variant/non-confirming (0.29%), and not listed or prefer not to answer (0.29%), with no participants selecting transgender male or transgender female. Participants were mostly undergraduate students, with 17.23% Freshmen, 26.57% Sophomores, 30.66% Juniors, 23.80% Seniors, and 1.75% identifying as MA students or other. Most participants (60.73%) indicated they were single, 21.02% said they were dating someone, 15.18% said they were in a committed relationship, and 3.07% said they were engaged, married, or divorced. Most participants (95.17%) indicated they were heterosexual/straight, 0.73% identified as gay, 0.29% as lesbian, 3.07% as bisexual, and 0.73% indicated their sexual orientation was not listed. Most participants identified as non-Hispanic (94.89%). In terms of race, majority of participants (65.40%) identified as White, followed by Asian (25.04%; including Chinese, Korean, Asian Indian, Vietnamese, Japanese, and Filipino origins), Black/African American (8.18%), and 2.48% identifying as other races. The median household income range was $100,000 and $149,000 per annum. Seven in 10 participants (73.43%) indicated they had an active account on Facebook, 93.77% had an Instagram account, 66.28% had a Twitter account, and over half (52.85%) had a TikTok account.
Measurement and Procedure
Participants completed the study online. Upon reading a consent form, they were asked to indicate the social media platforms on which they have an active account (multi-select). Based on their selection, participants received nearly identical questions with slight modifications for the platforms on which they had active accounts. Participants who indicated they do not have an active account on one or more of the platforms did not get any of the questions for that platform. Unless otherwise noted, all variables were measured on a 7-point scale (mostly Likert-type scales, with some frequency variation anchored with “Never” to “Very Often”). Appendix 1 provides all measured items, as well as factor and reliability analysis results. Overall, our measures were deemed reliable (Cronbach’s α Range = .677–.975) and valid (Factor Loadings Range = .578–.985; % of Variance Explained Range = 51.68%–95.33%). The following section highlights operationalizes the variables in accordance with their order in the proposed regression models.
Demographics
We asked participants to indicate their birth year to determine their age. Participants then indicated their gender identity (female, male, transgender female, transgender male, gender variant/non-conforming, and not listed with text write-in option), current class standing (Freshman, Sophomore, Junior, Senior, MA student, PhD Student, and Other), and sexual orientation (straight/heterosexual, gay, lesbian, bisexual, or other). To determine race and ethnicity, we asked first whether participants were Non-Hispanic or Hispanic, with multiple options for Hispanic origin (Mexican American/Chicano, Puerto Rican, Cuban, and Other). As for race, participants selected 1 of 15 options including White, Black/African American, Chinese, Korean, among others. Finally, we asked participants to indicate their household family income.
All subsequent measures were asked at the platform level.
Platform Use
Participants were asked to report the average time they spent daily on each of the platforms by selecting from two drop-down menus representing hours and minutes in a day. We used six items from Ellison et al.’s (2007) Facebook Use Intensity to measure medium affinity. Finally, participants indicated the number of friends and close friends they have on the platforms. Specific to all platforms except Facebook, two groups of questions were asked to separate the number of accounts participants followed and number of accounts following them, where a general question was asked first, and then a subsequent one was asked about close friends in that reference group for both groups of users.
Use Motivations
We measured 19 different motivations for using each platform. We adapted Liu et al. (2010) measures for Twitter use motivations for information, self-documentation, social interaction, entertainment, passing time, self-expression, medium appeal, and convenience. We adapted measures of relaxation and escapism from Rubin et al. (1988) to each of the platforms. We adapted Siedman’s (2013) measures for acceptance-seeking, connection/caring, emotional disclosure, and attention seeking. We, further, adapted Sheldon and Bryant’s (2016) measures for Instagram motives related to surveillance, coolness, creativity, and staying in the loop. Finally, we developed a three-item scale to measure the motivation to use each platform for brand promotion.
Privacy-Related Factors
Following Malik et al. (2016), we adapted measures for privacy awareness (initially developed by Torres, 2012), privacy seeking behavior (Malik et al., 2016), privacy concerns (adapted from Acquisti & Gross, 2006; Dinev & Hart, 2006; Krasnova et al., 2009), and trust in the platform (adapted from Dwyer et al., 2007; Krasnova et al., 2010).
Criterion Variables
The first was platform use continuance intentions (PUCI; adapted from H. S. Park & Smith, 2007). The second variable was related to problematic platform use (PPU), where we adapted the Bergen Facebook Addiction Scale to each platform (Andreassen et al., 2012).
Data Analysis Plan
To answer RQ1, we performed a series of repeated measures ANOVAs on our study variables, with platform as a repetition factor. It is important to note that these analyses were only performed with participants who indicated that they have an active account on each of the four different social media platforms, therefore, the sample size is lower than the sample for platform-specific analyses. In cases when the assumption of sphericity was violated, we reported Huynh-Feldt adjusted degrees of freedom. The second group of RQs and hypotheses dealt with the relationship between platform usage, motivations, and privacy concerns, on one side, and platform problematic use and continuance intentions, on the other. Here, we used hierarchical linear regression analyses at the platform level for each criterion variable. Multicollinearity statistics showed acceptable ranges for tolerance and VIF.
Results
Platform-Level Differences
RQ1 asked about differences in (a) platform usage, (b) use motivations, (c) privacy-related factors, (d) platform addiction, and (e) platform use intentions. Results (see Table 1 and Figures 1 and 2) show that participants differed significantly across platforms on all measured variables with effect sizes (partial eta-squared values) ranging between .03 and .61 (M = .28, SD = 0.12). For all variables, except “passing time” and “stay in the loop” motivations, Instagram was consistently rated higher than other platforms. In contrast, for 21 of the 27 variables, Facebook was rated the lowest, while TikTok was rated lowest on the six remaining variables. Pairwise comparisons highlight commonalities among the four platforms (for all other variables, differences were significant across platforms). For platform affinity, motives of information and medium appeal, trust, and problematic use, the four platforms differed significantly, where Instagram was rated highest and Facebook lowest, with interchangeable ordering of Twitter and TikTok in relation to platform affinity, information, and medium appeal motives, as well as trust and problematic use. Instagram and TikTok were rated higher (and did not differ significantly) than Twitter and Facebook in terms of time spent daily on the platform, as well as motives of entertainment, passing time (TikTok higher than Instagram), relaxation, and escapism (with Twitter as high as Facebook and TikTok). Instagram and Twitter were comparable on emotional disclosure and stay in the loop motives. Facebook’s ratings were comparable (non-significant) with TikTok regarding motives of self-expression, acceptance, attention seeking (along with Twitter), surveillance, and brand promotion. On the other hand, TikTok was rated lowest when it came to self-documentation and social interaction motives, as well as privacy awareness, seeking behaviors, and concerns. Facebook and Twitter were comparable and sandwiched between Instagram and TikTok regarding motives of self-documentation, social interaction, connection/caring, and privacy awareness and seeking behaviors. Finally, Twitter and TikTok were comparable regarding motives of convenience, coolness, creativity, and use intentions (see Table 1 and Figure 1).
Results of Repeated Measures ANOVAs on Measured Variables, across Platforms.

Note. Pairwise comparisons are significant (p < .05) unless otherwise noted. FB = Facebook; IN = Instagram; TW = Twitter; TK = TikTok.

Platform differences in measured variables (proximal platform logos indicate non-significant pairwise differences, distant logos indicate significant pairwise differences).

Rank-ordering (based on means) of motivations to use Facebook, Instagram, Twitter, and TikTok.
H1(a-d) predicted that entertainment would be the highest rated motive across social media platforms part of this study. Except for Facebook, entertainment was the highest-rated motivation for Instagram, Twitter, and TikTok. H1a was not supported, while H1b-d were supported. Figure 2 shows a mean-based ordering of the different use motivations as a function of the platform. Average rankings of motivations shows that the top-ranked motivation across platforms is entertainment, followed by passing time, convenience, surveillance, medium appeal, stay in the loop, connection/caring, escapism, relaxation, social interaction, information, self-documentation, self-expression, acceptance, coolness, creativity, attention seeking, brand promotion, and emotional disclosure, respectively.
The following section summarizes findings for the hierarchical regression models predicting PPU and PUCI. We limit the reporting of findings to significant predictors and those that approached significance, where the direction of association is represented with the plus and minus signs in brackets to indicate positive and negative associations, respectively. Results are summarized in Supplemental Tables 2 and 3 and Figure 3.
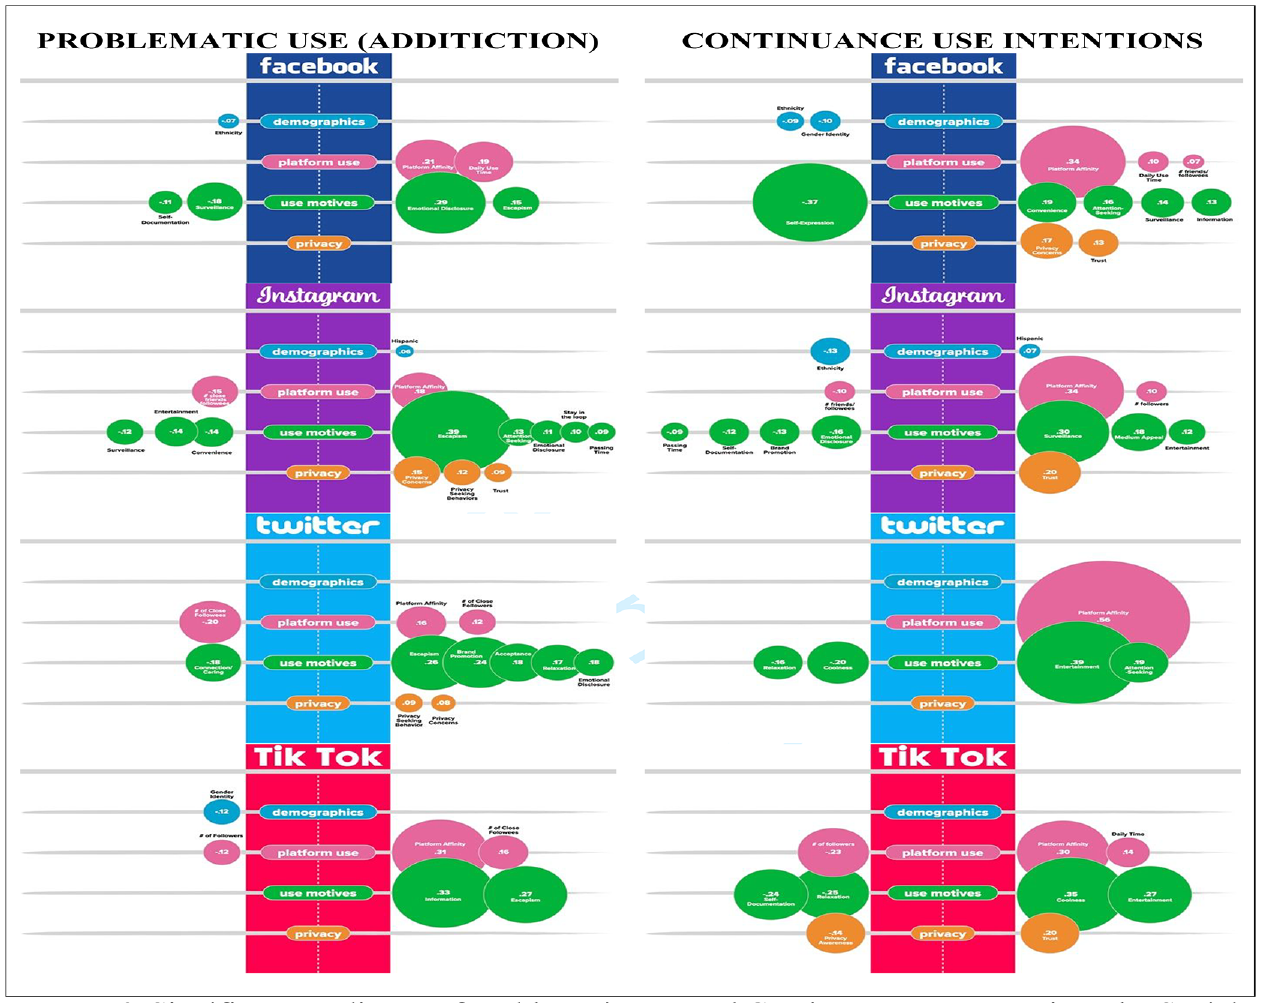
Significant Predictors of Problematic Use and Continuance Use Intentions, by Social Media Platform.
Predicting Problematic Platform Use (PPU)
Facebook PPU
The initial model explained 9% of the variance in Facebook PPU showed that age (+) and household income (−, marginal) were significant predictors. With the addition of platform use variables (Model 2), an additional 25% of the variance was added for a total of 32% of the variance explained in PPU. In this step, household income continued to be a negative predictor, gender identity was a marginally significant positive predictor, and age seized to predict Facebook PPU. Both daily time spent using Facebook and platform affinity were positive predictors. Model 3 included use motivations and added 21% to the variance totaling 52% of the variance explained. None of the demographic variables were significant, except for age (+) and ethnicity (−) that were marginally significant predictors. Use time and Facebook affinity maintained significant positive associations with PPU. Of the motivations to use Facebook, the following were significant or marginally significant predictors of Facebook PPU: emotional disclosure (+), surveillance (−), escapism (+), entertainment (−, marginal), self-documentation (−), and escapism (−, marginal), respectively. The final model added privacy-related factors and contributed an additional, non-significant .4% to the variance in Facebook PPU. Of the demographic predictors, ethnicity was the only marginally significant negative predictor of PPU. Both daily use time and platform affinity maintained significant positive associations with PPU. Of the motivations to use Facebook, the strongest predictor was emotional disclosure (+), followed by surveillance (−), where relaxation (+) and self-documentation (−) approached significance in predicting Facebook PPU. None of the privacy factors significantly predicted PPU.
Instagram PPU
Demographics explained 3% of the variance in Instagram PPU with gender identity (−) as a significant predictor and Hispanic origin as a negative predictor approaching significance. The addition of Instagram use variables (Model 2) significantly added 20% to the variance for a total of 24%, where ethnicity was a positive predictor and both gender identity (−) and Hispanic origin (+) approached significance in predicting PPU. Platform affinity and daily use time, respectively, positively predicted PPU. Adding the motivations (Model 3) contributed an additional 28% to the variance explained in Instagram PPU, totaling 49%. Of the demographic variables, Hispanic origin was the only significant positive predictor. Platform affinity continued to be predictive yet decreased in predictive power, and daily use time ceased to be a significant predictor. Of the motivations to use Instagram, the following were significant or marginally significant predictors: escapism (+), convenience (−, marginal), attention seeking (+, marginal), passing time (+), emotional disclosure (+), stay in the loop (+), and entertainment (−, marginal), respectively. The final model added 4% to the variance for a total of 52%. None of the demographic predictors are now significant, except for Hispanic origin (+) that approached significance. Platform affinity maintained predictive power. Escapism (+) was the strongest predictor of Instagram PPU, followed by entertainment and acceptance (both −), convenience (−, marginal), and attention seeking (+), surveillance (−, marginal), emotional disclosure (+), and passing time (+, marginal), respectively. Finally, privacy concerns, privacy seeking behaviors, and trust, respectively, positively predicted Instagram PPU.
Twitter PPU
Demographics (Model 1) predicted 1% of the variance (not significant), yet sexual orientation (+) and household income (−) approached significance in predicting Twitter PPU. Platform use factors added 38% to the variance, totaling of 39%. The strongest predictor of Twitter PPU was platform affinity, followed by the number of close friend followees (−), the number of close friend followers (+), and daily use time (+). Twitter motivations added 24% to the variance (total of 61%), where none of the demographics were significant. Of platform use variables, the strongest predictor was the number of close-friend followees (−), followed by platform affinity (+) and number of close followers (+, marginal). Escapism (+) was the strongest predictor of Twitter PPU, followed by brand promotion (+) and connection/caring, respectively. In addition, acceptance and emotional disclosure motives approached significance in positively predicting Twitter PPU. The final model added 2% to the variance explained for a total 63%. None of the demographics were significant predictors. The number of close friends followees was a negative predictor, followed by platform affinity (+) and the number of close followers (+, approaching significance), respectively. Of the motivations in the final model, escapism was the strongest predictor (+), followed by brand promotion (+), emotional disclosure, acceptance (+), connection/caring (−), escapism (+), and emotional disclosure (+, marginal), respectively. Privacy seeking behaviors positively predicted PPU, while privacy concerns approached significance in positively predicting PPU.
TikTok PPU
Model 1 (demographics) explained 5% of the variance, with gender identity (−) and marital status (−) as significant predictors, and ethnicity as a marginally significant positive predictor of TikTok PPU. TikTok use factors added 44% to the variance explained (total of 50%). Gender identity was a marginally significant negative predictor. Platform affinity was the strongest positive predictor, followed the number of close followees (+) and number of followers (−, marginal). TikTok motivations added 18% to the variance explained in TikTok PPU (total of 66%). Gender identity was a negative predictor. TikTok affinity positively predicted PPU, the number close-friend followees was a positive predictor, and the number of followers as a negative predictor. Of the motivations to use TikTok, information was the strongest positive predictor, followed by escapism (+) and emotional disclosure (+, approaching significance). Privacy factors (Model 4) did not add significant explanatory power to predicting PPU. The final model explained 66% of the variance in PPU. Gender identity continued to be a marginally significant negative predictor. Platform affinity (+), number of close followees (−), and number of followers (−) predicted PPU. Information and escapism were the only two significant positive predictors of PPU, and no privacy factors were significant.
Predicting Platform Use Continuance Intentions (PUCI)
Facebook PUCI
Demographics explained 7% of the variance in PUCI with gender identity (−), age (+), and ethnicity (−) as significant predictors of PUCI. Platform use factors (Model 2) added 33% to the variance explained in continuance intentions (total of 40%). Of demographics, gender identity (−), ethnicity (−), and Hispanic origin (−) were significant predictors. Platform affinity (+) predicted PUCI. Facebook motivations (Model 3) added 11% to the variance explained in PUCI (total of 49%). Gender identity and ethnicity maintained negative association with PUCI. Platform affinity and daily use time were positive predictors. Of the motivations to use Facebook, self-expression was the strongest negative predictor, followed by convenience (+), surveillance (+, approaching significance), entertainment (+, approaching significance), and information (+), respectively. Privacy factors added 3% to the explanatory power of the model predicting Facebook PUCI (total of 52%). In the final model, gender identity and ethnicity maintained negative associations, platform affinity, daily use time, and number of friends/followers (marginal) were positive predictors, and self-expression (−) was the strongest motive to predict PUCI, followed by convenience (+), attention seeking (+), surveillance (+, approaching significance), and information (+). Privacy-related trust and privacy concerns were significant predictors of PUCI.
Instagram PUCI
Demographics explained 9% of the variance in continuance intentions, with ethnicity (−), household income (+), Hispanic origin (+), and gender identity (−, marginal) predicting PUCI. Platform use factors (Model 2) added 28% to the variance explained in PUCI. Ethnicity (−) and Hispanic origin (+) predicted PUCI, platform affinity (+), daily use time (−), and number of followers (+, approaching significance), respectively, predicted PUCI. Motives (Model 3) added 13% to the variance explained in PUCI (total 48%). Ethnicity (−) was the only significant demographic predictor, platform affinity (+), number of followers (+) and close friend followees (−), and daily use time (−, approaching significance) predicted PUCI. Of the motivations, surveillance (+) was the strongest predictor of PUCI, followed by medium appeal (+), attention seeking (−), entertainment (+), passing time (−), brand promotion (+), and self-documentation (−, approaching significance), respectively, predicted PUCI. The final model added 3% to the variance explained in PUCI (total 51%). In that model, ethnicity (−) and Hispanic origin (+, approaching significance) predicted PUCI. Platform affinity predicted PUCI, followed by number of friends (−) and followers (+). As for motivations, the same trend was maintained as described in Model 3. Of the privacy factors, trust was the only significant positive predictor of PUCI.
Twitter PUCI
Demographics did not significantly predict Twitter PUCI (except for sexual orientation, marginal). Platform use factors added 58% to the explanatory power of the model (total 59%), where none of the demographics were significant, and platform affinity was a positive predictor of PUCI and maintained predictive power across subsequent models. Motivations added 9% to the variance in use intentions (total 66%), where entertainment (+) was the strongest predictor, followed by coolness (−), attention seeking (+), and passing time (−, marginal) predicted PUCI. The privacy-related factors added 1% to the variance explained in continuance intentions (though not significant, total 66%). Platform affinity was the strongest positive predictor, followed by motivations to use Twitter for entertainment (+), coolness (−), attention seeking (+), and escapism (−). None of the privacy factors were significant predictors.
TikTok PUCI
Demographics (Model 1) explained 5% in PUCI, with gender identify (−), household income (+), and marital status (−) as predictors of PUCI. Platform use factors added 31% to the variance TikTok PUCI. Of the demographics, gender identity was a negative predictor, approaching significance. Platform affinity (+) and number of followers (−), respectively, predicted PUCI. Motives (Model 3) added 17% to the variance explained in PUCI (total 48%). None of the demographics were significant predictors, platform affinity (+), number of followers (−), and daily use time (−, marginal) predicted PUCI. Of the motives, coolness (+) was the strongest motive predicting PUCI, followed by entertainment (+), and relaxation (−). The final model added 2% to the variance explained in PUCI (marginal, total 50%). No demographics predicted PUCI. Platform affinity (+), number of followers (−), and now daily use time (+) were significant predictors. The motive with the strongest association with PUCI was coolness (+), followed by entertainment (+), relaxation (−), and self-documentation (−, approaching significance). Finally, privacy-related trust (+) and privacy awareness (−, approaching significance) predicted TikTok PUCI.
Discussion
The current study explored differences in uses and gratifications of Facebook, Instagram, Twitter, and TikTok. Instagram has emerged as the most preferred platforms in this sample of college students based on patterns of usage, motivations, privacy concerns, PPU, and PUCI. The hierarchical regressions models showed that platform affinity, a combinatory measure of cognitive and affective attitudes toward the platforms positively predicted both PPU and PUCI. Motivations to use each platform predicted PPU and PUCI, showcasing that these two constructs are conceptually distinctive.
Problematic Platform Use (PPU)
Across the board, demographic individual differences were weak, and in most cases, non-significant predictors of PPU, with few exceptions. As it relates to PPU, ethnicity and Hispanic origin were marginally associated with Facebook and Instagram PPU, respectively. No demographic predictors were significant predictors of Twitter PPU, and gender identity was a negative predictor, indicating that participants who indicated they were male and female (heteronormative) were more likely to use TikTok more excessively than those selecting LGBTQIA+ identity categories. Platform affinity positively predicted PPU for all the four platforms, thus indicating that the emotional and cognitive connection with the platform is a good indication of excessive platform use, thus confirming the conceptualization of problematic use (Andreassen et al., 2012). Notably, time spent daily in using each of the platforms operated differently across the board, which was only a significant positive predictor for Facebook PPU, even though participants indicated they used Instagram more heavily (roughly 2 hr daily) in comparison to other platforms, with Facebook ranking lowest. It is plausible that Facebook affordances, compared to Instagram, Twitter, and TikTok, place higher salience on the relationship between time spent and its excessive use. Anecdotally speaking, Instagram, Twitter, and TikTok rely on the combination of visual, short text-based, and audiovisual content, respectively, which could alter the perception of time spent on the platform and its role in excessive use. Facebook, on the other hand, entails multiple content modalities that combine text, visual, and audiovisual content in longer form than the three other platforms. It is also plausible that content attributes of platforms like Instagram, Twitter, and TikTok with their emphasis on shorter-form text-based content and vivid audiovisual content (for Instagram and TikTok) might be shrinking processing time with an enhanced frequency of processing a greater amount of content, which could explain the lack of awareness of the role of time spent on these platforms compared to Facebook and its role in predicting PPU. This finding could also indicate an element of social desirability in measures of excessive social media use, but also could indicate the lack of adequacy in estimating time spent on social media, especially that prior research showed differences in self-report measures of time spent on social media, in comparison with server-based recording of actual time spent on these platforms (Junco, 2013).
The other intriguing set of findings among the platform use predictors deals with the variability of the relationship between indicators of network size and PPU. The number of close friends who participants followed (followees) was a negative predictor of PPU for Twitter and Instagram and a positive predictor for TikTok PPU, where the latter was negatively predicted by the number of followers (accounts following participants). Given the novelty of TikTok, participants might be still cultivating their network by following more people, and if those were close friends, then TikTok, plausibly, becomes an avenue for connecting with close friends through the platform and an attractive element in using it more excessively. On the flip side, Twitter is used mainly for public posting, thus the role of close connection is not that evident on this platform. Instagram, on the other hand, is optimal for influencer marketing, thus it is plausible that the size of close friend network on the platform is not what’s driving excessive use of it.
PPU for the four platforms was predicted differently by use motivations. Despite prior research (e.g., Alhabash & Ma, 2017) indicating that entertainment was the strongest predictor of usage, our findings showed otherwise. Entertainment was not even a significant predictor for any of the platforms’ PPU, except for Instagram, where, contrary to previous findings (Alhabash & Ma, 2017), and in fact was found to be a significant and weaker predictor of Instagram PPU. The deviation in this finding from prior research (Alhabash & Ma, 2017) could be the result of multiple factors. First, our data were collected during the peak of the COVID-19 pandemic and following the U.S. Presidential Elections. Entertainment motives for Instagram were rated the highest among our sample of participants, comparable to TikTok, and significantly different from Twitter and Facebook. With that in mind, it is possible that the draw to Instagram within the context of recent political conversations and the health pandemic might have diminished the association between Instagram’s entertaining value and its excessive use. Second, given the visual nature of Instagram content, this high entertaining value (rated highest among other motives for Instagram use) is a ritualistic and habitual motive rather than a driver for excessive use. These two plausible explanations could also explain why escapism was the strongest positive predictor of Instagram PPU. It is also worth mentioning that Instagram PPU was predicted by a more diverse set of motivations, in comparison to the other platforms (eight for Instagram, four for each of Facebook and Twitter, and two for TikTok). Another noteworthy finding is that escapism was also a significant positive predictor for all the other three platforms. Interestingly, information motive was a strong predictor of TikTok use and brand promotion motive was a strong positive predictor of Twitter use.
Finally, our findings showed that privacy factors did not significantly predict PPU for Facebook and TikTok, yet some of them predicted PPU for Instagram and Twitter. For Instagram, higher privacy seeking behaviors, concerns, and trust were associated with greater PPU, whereas Twitter’s PPU was positively predicted by privacy seeking behaviors and concerns. In comparison with platform affinity and some of the motives predicting PPU for Instagram and Twitter, privacy factors were generally weaker predictors when significant. There is a potential here for a privacy paradox. Participants who enacted greater privacy-seeking behaviors and had higher privacy concerns indicated using the two platforms more excessively.
Platform Use Continuance Intentions (PUCI)
Much like PPU, demographic predictors of PUCI were weak and mostly non-significant. The only significant predictors were gender identity and ethnicity. Selecting heteronormative gender identity categories and being white were associated with higher PUCI. Platform affinity was also a significant positive predictor of PUCI across the board, and time spent daily on Facebook and TikTok was a positive predictor of PUCI for each of the platforms in the final model. Network size played an even smaller role in PUCI compared to PPU, where the number of followers was a negative predictor of PUCI for Instagram and TikTok.
The pattern of associative relationships between use motivations and PUCI differed from PPU. For Facebook, self-expression was the strongest and negative predictor of PUCI. This potentially points to the changing nature of Facebook use, where users engage in passive rather than active use of the platform, which is further enhanced by the positive (marginal) association between surveillance motive and Facebook PUCI. The longevity of Facebook use could explain the positive association between convenience motive and PUCI. Two other motives that significantly predicted Facebook PUCI were attention seeking and information, which also points to the evolving nature of what Facebook means to its users. Much like PPU, Instagram’s PUCI was predicted by the largest number of motives (seven compared to four for the other three platforms). For Instagram, surveillance motive was the strongest positive predictor, alongside medium appeal, entertainment (which was positive), emotional disclosure, among others (see Supplemental Table 3). Twitter PUCI was positively predicted by entertainment and attention seeking, yet negatively predicted by relaxation and coolness. The nature and affordances of Twitter could explain this finding. Twitter could be described as more of a public platform, given the ability to view content by non-friends/followers/followees. The short text-based content could explain the negative association between relaxation and PUCI for Twitter, and the dips in Twitter’s popularity could explain the negative association with coolness. Contrast that with the finding that coolness was the strongest positive predictor of TikTok PUCI. Given that TikTok is considered a newer platform, the “cool” factor seems more important than it is for Twitter and other platforms, which could plausibly explain the positive association between entertainment motive and TikTok PUCI. The negative association between self-documentation motive and TikTok PUCI could indicate a more passive pattern of use, and finally, the negative association between passing time motive and TikTok PUCI could be an indicator of users’ adjusting to the nature of their TikTok use compared to other platforms.
Finally, trust in Facebook, Instagram, and TikTok was positively associated with their PUCI. In the case of TikTok, privacy awareness was a negative predictor, and for Facebook privacy concerns was a positive predictor of PUCI.
Theoretical and Practical Implications
From a theoretical standpoint, motivations to use social media, within the U&G framework, could potentially indicate how platform affordances warrant adaptability and evolution over time. Though the current study was not longitudinal in nature, yet mounting evidence illuminates the sociotechnical system evolution of major social media platforms. Second, given conceptual and operational problems with quantifying media use, specifically within the context of social media (see Junco, 2013), adopting psychological and behavioral measures like problematic use and continuance intentions might better reflect the psychological depth of the U&G framework. It is important to highlight, here, that accessibility of social media through multiple devices (i.e., mobile, desktop) has fragmented media use for users. Unlike watching television that requires time allocation and presence in a physical space (in front of the device), for example, users can access social media platforms throughout the day, multiple times, at different locations and settings, and more importantly, can switch iteratively from one platform to another. This fragmented nature of social media use creates a challenge for quantifying time allocated for using each platform. This provides an opportunity to diversify generic and specific measures of social media use to account for psychological affinity and behavioral intentions. It is also important to triangulate such measures with server-based platform use measures. Finally, accounting for use motivations and the gratifications users get from using social media platforms is important in understanding the nature of their use and how it evolves. Newer, more popular platforms (Instagram and TikTok) seem to allow for convergent motives predicting PPU and PUCI, while older platforms (Facebook and Twitter) display more homogenous motivations that predict different patterns of use.
Our findings also provide insights for practice. From a marketing and advertising perspective, the nature of using the different platforms and how different motivations variably predict different types of use is important to understand for streamlining effective social media marketing and advertising strategies. Marketing and advertising on these platforms is an interruption of users’ habitual and ritualistic use, therefore, strategy and tactics should align with the different motives that predict platform use. System designers and engineers should also pay close attention to the evolving nature of motives and uses of these platforms. More importantly, our findings highlight the importance of platform trust in predicting PUCI, which requires more careful investment by designers and engineers.
Limitations and Future Research
There are a few limitations worth noting. First, we recruited a convenience sample of college students, thus our findings cannot be generalized to a larger population. Second, given the differences in adoption of the four platforms examined in our study, we did not have equal number of participants to comparative regression models, which could have biased our findings. Third, our study was conducted during the emergence of the current COVID-19 pandemic, following the 2020 U.S. Presidential Elections, and amid a sociopolitical reckoning in the United States, which have been attributed to how social media are used. Though we did not ask participants questions specific to these sociopolitical and health contexts, we believe that our findings might have been influenced by these changing factors. This certainty requires further investigation with use of multiple methods, including qualitative and critical approaches to understanding how political, social, and health contexts contribute to the evolution of social media.
Conclusion
Our survey-based research of college students in a larger Midwestern university showed intriguing differences in the uses and gratifications of Facebook, Instagram, Twitter, and TikTok. Our findings shed the light on the differences in psychological and behavioral profiles of four leading social media platforms in a similar fashion to previous studies (e.g., Alhabash & Ma, 2017; Phua et al., 2017a, 2017b). The four platforms vary in terms of affordances, salience of affordances, as well as the novelty of their use and re-use. Facebook, the world’s leading platform in terms of number of users (DataPortal, 2023), has lost its oomph to Instagram. Per our findings, Twitter is not necessarily out of the question, and confirms anecdotal evidence that younger generations are experiencing a resurgence of interest in Twitter. All three platforms (Facebook, Instagram, and Twitter) have been popular for over a decade (Facebook started in 2004, Twitter in 2006, and Instagram in 2010), whereas TikTok, although was founded in an earlier format in China in 2010, gained worldwide popularity in 2017 (Schewedel, 2018). Our findings showed differences within these platforms, where some of these differences can be explained by novelty aspects. For example, both TikTok and Twitter use continuance intentions were predicted by the motivation to appear cool, yet coolness motive was a positive predictor for TikTok and a negative one for Twitter. The need to be cool might be better served by newer and emerging sociotechnical systems like TikTok compared to aging social media platforms. Entertainment only predicted Instagram and Twitter’s continuance intentions, thus providing an indication of the value these platforms bring to our sample of users. Finally, we would like to highlight the distinctiveness of what predicts problematic use. For Facebook, Instagram and Twitter, the motivations to use the platform for escapism, and relaxation for TikTok were significant positive predictors of problematic use. This tells the story of habitual and ritualistic use that could transform into patterns of problematic use.
Supplemental Material
sj-docx-1-sgo-10.1177_21582440241255426 – Supplemental material for So Similar, Yet So Different: How Motivations to Use Facebook, Instagram, Twitter, and TikTok Predict Problematic Use and Use Continuance Intentions
Supplemental material, sj-docx-1-sgo-10.1177_21582440241255426 for So Similar, Yet So Different: How Motivations to Use Facebook, Instagram, Twitter, and TikTok Predict Problematic Use and Use Continuance Intentions by Saleem Alhabash, Tegan Marie Smischney, Anvita Suneja, Anish Nimmagadda and Linda R. White in SAGE Open
Footnotes
Appendix
Descriptive Statistics, Reliability, and Factor Analysis Results for all Measured Scales.

| Variable | Statistic | TikTok | |||
|---|---|---|---|---|---|
| Platform Affinity
[Platform] is part of my everyday activity I am proud to tell people I’m on [Platform] [Platform] has become part of my daily routine I feel out of touch when I haven’t logged onto [Platform] for a while I feel I am part of the [Platform] community I would be disappointed if [Platform] shut down |
Factor loading | .718–.868 | .805–.897 | .813–.920 | .771–.891 |
| Eigenvalue | 3.80 | 4.29 | 4.70 | 4.19 | |
| % Var. exp. | 63.32% | 71.57% | 78.32% | 69.77% | |
| Cronbach’s α | .883 | .920 | .945 | .913 | |
| Mean (SD) | 3.17 (1.46) | 4.97 (1.46) | 4.31 (1.88) | 4.04 (1.75) | |
| Motivation: Information
to provide information to share information useful to people to present information on my interests |
Factor loading | .838–.888 | .839–.876 | .874–.884 | .919–.938 |
| Eigenvalue | 2.24 | 2.26 | 2.33 | 2.58 | |
| % Var. exp. | 74.60% | 75.16% | 77.58% | 86.08% | |
| Cronbach’s α | .830 | .835 | .855 | .918 | |
| Mean (SD) | 3.08 (1.56) | 4.14 (1.65) | 3.67 (1.89) | 2.48 (1.79) | |
| Motivation: Self-documentation
to record what I do in life to keep track of what I am doing to document my life |
Factor loading | .833–.920 | .854–.928 | .887–.927 | .916–.935 |
| Eigenvalue | 2.37 | 2.45 | 2.48 | 2.59 | |
| % Var. exp. | 79.00% | 81.58% | 82.65% | 86.18% | |
| Cronbach’s α | .866 | .886 | .894 | .920 | |
| Mean (SD) | 2.91 (1.64) | 4.48 (1.74) | 2.66 (1.69) | 2.42 (1.76) | |
| Motivation: Social interaction
to connect with people who share some of my values to meet new people to maintain a daily, personal connection with friends and family |
Factor loading | .691–.876 | .790–.873 | .837–.865 | .886–.900 |
| Eigenvalue | 1.93 | 2.11 | 2.20 | 2.39 | |
| % Var. exp. | 64.24% | 70.40% | 73.17% | 79.49% | |
| Cronbach’s α | .717 | .788 | .815 | .871 | |
| Mean (SD) | 3.12 (1.41) | 4.50 (1.55) | 3.37 (1.72) | 2.62 (1.72) | |
| Motivation: Entertainment
because I enjoy it because it’s entertaining because it’s fun |
Factor loading | .922–.936 | .929–.942 | .941–.961 | .912–.958 |
| Eigenvalue | 2.59 | 2.63 | 2.72 | 2.66 | |
| % Var. exp. | 86.41% | 87.81% | 90.67% | 88.51% | |
| Cronbach’s α | .921 | .930 | .948 | .935 | |
| Mean (SD) | 3.66 (1.65) | 5.51 (1.34) | 5.15 (1.76) | 5.79 (1.42) | |
| Motivation: Passing time
because it helps me pass the time because I have nothing better to do to fill empty moments because I’m bored |
Factor loading | .791–.901 | .761–.877 | .844–.922 | .792–.893 |
| Eigenvalue | 2.94 | 2.80 | 3.19 | 2.85 | |
| % Var. exp. | 73.61% | 70.03% | 79.82% | 71.34% | |
| Cronbach’s α | .880 | .852 | .914 | .858 | |
| Mean (SD) | 3.86 (1.64) | 4.95 (1.44) | 4.76 (1.76) | 5.35 (1.50) | |
| Motivation: Relaxation
because it relaxes me because it allows me to unwind because it’s a pleasant rest because it makes me feel less tense |
Factor loading | .892–.944 | .878–.904 | .916–.933 | .867–.913 |
| Eigenvalue | 3.37 | 3.16 | 3.43 | 3.13 | |
| % Var. exp. | 84.34% | 79.06% | 85.71% | 78.19% | |
| Cronbach’s α | .938 | .911 | .944 | .907 | |
| Mean (SD) | 2.94 (1.63) | 4.48 (1.56) | 4.12 (1.89) | 4.62 (1.75) | |
| Motivation: Escapism
to forget about the daily routine to put off something I should be doing to get away from what I’m doing to have a moment to myself to get away from pressures and responsibilities |
Factor loading | .801–.883 | .771–.886 | .844–.919 | .821–.898 |
| Eigenvalue | 3.62 | 3.52 | 3.97 | 3.65 | |
| % Var. exp. | 72.44% | 70.46% | 79.38% | 72.93% | |
| Cronbach’s α | .904 | .895 | .935 | .907 | |
| Mean (SD) | 3.08 (1.55) | 4.44 (1.54) | 4.08 (1.83) | 4.50 (1.76) | |
| Motivation: Self-expression
to show my personality to tell others about myself to express who I really am to express aspects of myself that I don’t feel comfortable expressing offline to express myself the way I’d ideally like to be |
Factor loading | .828–.900 | .719–.877 | .838–.909 | .890–.920 |
| Eigenvalue | 3.80 | 3.56 | 3.84 | 4.08 | |
| % Var. exp. | 76.04% | 71.15% | 76.75% | 81.68% | |
| Cronbach’s α | .921 | .895 | .924 | .943 | |
| Mean (SD) | 2.48 (1.43) | 4.21 (1.57) | 3.21 (1.77) | 2.74 (1.84) | |
| Motivation: Medium appeal
because I like what I can do on it because it is the easiest, most cost-effective way to communicate with others because it is the easiest, most cost-effective way to communicate with others because it’s easy for me to maintain |
Factor loading | .784–.870 | .817–.871 | .887–.901 | .709–.839 |
| Eigenvalue | 2.12 | 2.16 | 2.27 | 1.86 | |
| % Var. exp. | 70.51% | 72.14% | 75.66% | 62.04% | |
| Cronbach’s α | .790 | .801 | .837 | .693 | |
| Mean (SD) | 3.09 (1.50) | 4.75 (1.43) | 4.15 (1.76) | 3.92 (1.55) | |
| Motivation: Convenience
because it’s convenient to use because I can get what I want for less effort because I can use it anytime, anywhere because it’s easy to use |
Factor loading | .772–.904 | .641–.908 | .710–.935 | .610–.897 |
| Eigenvalue | 3.00 | 2.83 | 3.08 | 2.70 | |
| % Var. exp. | 74.98% | 70.79% | 76.99% | 67.56% | |
| Cronbach’s α | .887 | .841 | .893 | .820 | |
| Mean (SD) | 3.46 (1.53) | 4.99 (1.31) | 4.57 (1.67) | 4.71 (1.50) | |
| Motivation: Acceptance
to feel included to make others feel closer to me to feel accepted |
Factor loading | .831–.898 | .846–.898 | .866–.895 | .877–.924 |
| Eigenvalue | 2.26 | 2.33 | 2.32 | 2.41 | |
| % Var. exp. | 75.28% | 77.51% | 77.23% | 80.20% | |
| Cronbach’s α | .835 | .855 | .852 | .875 | |
| Mean (SD) | 2.62 (1.46) | 4.03 (1.67) | 3.10 (1.68) | 2.82 (1.75) | |
| Motivation: Connection/caring
to feel closer to others to show caring for others to support others |
Factor loading | .867–.915 | .844–.891 | .887–.894 | .872–.907 |
| Eigenvalue | 2.42 | 2.28 | 2.38 | 2.39 | |
| % Var. exp. | 80.56% | 76.06% | 79.43% | 79.56% | |
| Cronbach’s α | .879 | .840 | .870 | .870 | |
| Mean (SD) | 3.28 (1.64) | 4.59 (1.52) | 3.53 (1.76) | 3.02 (1.78) | |
| Motivation: Emotional disclosure
to post about ‘drama in my life’ to vent my frustrations to show my emotions |
Factor loading | .876–.918 | .837–.896 | .844–.908 | .925–.953 |
| Eigenvalue | 2.44 | 2.30 | 2.34 | 2.65 | |
| % Var. exp. | 81.28% | 76.80% | 77.91% | 88.23% | |
| Cronbach’s α | .885 | .847 | .857 | .933 | |
| Mean (SD) | 1.82 (1.24) | 2.76 (1.64) | 2.53 (1.61) | 2.19 (1.66) | |
| Motivation: Attention seeking
to show off to get attention to get noticed by others |
Factor loading | .913–.933 | .888–.915 | .911–.939 | .946–.963 |
| Eigenvalue | 2.55 | 2.46 | 2.57 | 2.72 | |
| % Var. exp. | 84.83% | 81.97% | 85.59% | 90.69% | |
| Cronbach’s α | .911 | .890 | .914 | .948 | |
| Mean (SD) | 2.19 (1.43) | 3.71 (1.80) | 2.47 (1.63) | 2.56 (1.88) | |
| Motivation: Surveillance
to interact with others to see what others are up to to follow friends to follow celebrities and influencers to see what other people share to creep through other people’s posts |
Factor loading | .578–.870 | .673–.859 | .689–.855 | .725–.806 |
| Eigenvalue | 3.64 | 3.74 | 3.66 | 3.46 | |
| % Var. exp. | 60.59% | 62.25% | 61.07% | 57.68% | |
| Cronbach’s α | .865 | .868 | .870 | .835 | |
| Mean (SD) | 3.60 (1.43) | 5.08 (1.28) | 4.28 (1.52) | 3.93 (1.59) | |
| Motivation: Coolness
to become popular because it’s cool to promote myself to update others on what I’m doing |
Factor loading | .758–.863 | .799–.857 | .686–.909 | .602–.933 |
| Eigenvalue | 2.72 | 2.80 | 2.81 | 2.87 | |
| % Var. exp. | 68.10% | 69.93% | 70.25% | 61.62% | |
| Cronbach’s α | .843 | .856 | .850 | .858 | |
| Mean (SD) | 2.43 (1.38) | 4.06 (1.58) | 2.97 (1.57) | 3.01 (1.65) | |
| Motivation: Creativity
to find people with whom I have common interests to create art to show off my creative skills to appreciate others’ creativity |
Factor loading | .787–.882 | .750–.873 | .741–.876 | .509–.908 |
| Eigenvalue | 2.83 | 2.64 | 2.61 | 2.55 | |
| % Var. Exp. | 70.84% | 65.96% | 65.34% | 63.69% | |
| Cronbach’s α | .862 | .828 | .818 | .797 | |
| Mean (SD) | 2.47 (1.42) | 3.91 (1.55) | 3.14 (1.55) | 3.32 (1.61) | |
| Motivation: Stay in the loop
to stay up to date on the latest news to know about the latest trends to follow what goes viral |
Factor Loading | .869–.891 | .834-.864 | .880-.907 | .752-.883 |
| Eigenvalue | 2.34 | 2.19 | 2.39 | 2.04 | |
| % Var. exp. | 77.97% | 72.85% | 79.51% | 67.82% | |
| Cronbach’s α | .859 | .813 | .871 | .758 | |
| Mean (SD) | 3.09 (1.69) | 4.41 (1.56) | 4.77 (1.67) | 4.33 (1.62) | |
| Motivation: Brand promotion
to promote a product or brand or a service to share information about a product or brand or service that’s useful to others to promote a business or an organization or a politician |
Factor loading | .873-.922 | .913-.928 | .891-.919 | .952-.959 |
| Eigenvalue | 2.44 | 2.54 | 2.47 | 2.74 | |
| % Var. exp. | 81.45% | 84.67% | 82.19% | 91.21% | |
| Cronbach’s α | .886 | .909 | .890 | .952 | |
| Mean (SD) | 2.31 (1.56) | 3.04 (1.85) | 2.65 (1.74) | 2.17 (1.70) | |
| Privacy awareness
I have read [Platform]’s privacy statement [Platform]’s privacy statement is easy to understand I understand all the privacy settings on [Platform] I am aware of all the appropriate actions to ensure my privacy on [Platform] I am aware of my privacy rights and responsibilities on [Platform] |
Factor loading | .809-.895 | .861-.940 | .874-.951 | .911-.962 |
| Eigenvalue | 3.71 | 4.11 | 4.24 | 4.38 | |
| % Var. exp. | 74.21% | 82.11% | 84.78% | 87.58% | |
| Cronbach’s α | .913 | .945 | .955 | .965 | |
| Mean (SD) | 3.08 (1.65) | 3.41 (1.77) | 2.88 (1.74) | 2.55 (1.72) | |
| Privacy-seeking behavior
Since joining [Platform], I have changed the privacy settings multiple times I usually keep track of what I post on [Platform] I usually delete posts from [Platform] I usually think carefully before posting on [Platform] |
Factor loading | .721–.794 | .579–.800 | .748–.826 | .736–.849 |
| Eigenvalue | 2.27 | 2.07 | 2.48 | 2.58 | |
| % Var. exp. | 56.83% | 51.68% | 61.89% | 64.57% | |
| Cronbach’s α | .746 | .677 | .794 | .815 | |
| Mean (SD) | 3.37 (1.53) | 4.29 (1.32) | 3.39 (1.62) | 2.86 (1.62) | |
| Privacy concerns
My personal data could be misused by [Platform] My data could be accessed by third parties My data could be misused by my [Platform] friends and followers My [Platform] account could reveal private information My [Platform] account could have negative consequences that I cannot foresee |
Factor loading | .854–.913 | .851–.914 | .884–.921 | .860–.921 |
| Eigenvalue | 3.83 | 3.80 | 4.07 | 3.99 | |
| % Var. exp. | 76.55% | 75.89% | 81.37% | 79.78% | |
| Cronbach’s α | .923 | .920 | .943 | .936 | |
| Mean (SD) | 3.92 (1.73) | 4.03 (1.59) | 3.85 (1.73) | 3.57 (1.76) | |
| Trust
I believe that [Platform] will protect my privacy I believe that [Platform] will not use my personal information for any other purpose I believe that [Platform] is a secure platform |
Factor loading | .926–.956 | .930–.954 | .938–.965 | .966–.976 |
| Eigenvalue | 3.64 | 2.66 | 2.71 | 2.82 | |
| % Var. exp. | 87.85% | 88.59% | 90.45% | 93.99% | |
| Cronbach’s α | .931 | .935 | .947 | .968 | |
| Mean (SD) | 3.18 (1.59) | 3.95 (1.60) | 3.78 (1.63) | 3.61 (1.74) | |
| Problematic use
spent a lot of time thinking about [Platform] or planned use of [Platform]? felt an urge to use [Platform] more and more? used [Platform] in order to forget about personal problems? tried to cut down on the use of [Platform] without success? become restless or troubled if you have been prohibited from using [Platform]? used [Platform] so much that it has had a negative impact on your job/studies? |
Factor loading | .749–.889 | .778–.849 | .809–.878 | .791–.869 |
| Eigenvalue | 4.22 | 4.04 | 4.31 | 4.27 | |
| % Var. exp. | 70.29% | 67.32% | 71.88% | 71.12% | |
| Cronbach’s α | .915 | .903 | .920 | .918 | |
| Mean (SD) | 1.82 (1.13) | 3.19 (1.55) | 2.66 (1.56) | 3.17 (1.70) | |
| Use intentions
I intend to use [Platform] I will use [Platform] I am planning on using [Platform] |
Factor loading | .967–.978 | .947–.958 | .967–.985 | .966–.983 |
| Eigenvalue | 2.84 | 2.72 | 2.86 | 2.85 | |
| % Var. exp. | 94.74% | 90.65% | 95.33% | 95.14% | |
| Cronbach’s α | .972 | .948 | .975 | .974 | |
| Mean (SD) | 4.51 (1.83) | 5.90 (1.31) | 5.41 (1.84) | 5.64 (1.61) |
Acknowledgements
None.
Declaration of Conflicting Interests
The author(s) declared no potential conflicts of interest with respect to the research, authorship, and/or publication of this article.
Funding
The author(s) received no financial support for the research, authorship, and/or publication of this article.
Ethics Approval
The Michigan State University Institutional Review Board approved the current human-subject study as an exempt study.
Supplemental Material
Supplemental material for this article is available online.
Data Availability Statement
Research data available upon request.
References
Supplementary Material
Please find the following supplemental material available below.
For Open Access articles published under a Creative Commons License, all supplemental material carries the same license as the article it is associated with.
For non-Open Access articles published, all supplemental material carries a non-exclusive license, and permission requests for re-use of supplemental material or any part of supplemental material shall be sent directly to the copyright owner as specified in the copyright notice associated with the article.