
Abstract
This study examined the variable relationships among four factors and school liking, controlling for gender, grade level, and maternal educational level. Repeated cross-sectional survey data from Danish public schools were analyzed across three measurement points (2015, 2017, and 2019) using multigroup structural equation modeling. Responses of students (Grades 0–3; ages 6–9), class teachers, and parents were analyzed in conjunction. The results revealed a strong association between adaptation to school norms and academic performance. Notably, girls demonstrated easier adaptation to school norms than boys, partly explaining the prevalent gender gap in academic performance. Furthermore, a positive association was found between classroom inclusion and school liking, indicating that socially marginalized students experience lower well-being. Finally, the parental community was associated with classroom inclusion, suggesting that strengthened cooperation among parents can protect students from social marginalization in the classroom. The findings emphasize the significance of students’ social skills for both academic performance and classroom inclusion, and also the importance of classroom inclusion for student well-being.
Plain Language Summary
The purpose of this study was to identify common patterns and conditions for students in the first years of school attendance in Grades 0 to 3 (ages 6–9). Based on three large surveys in Danish public schools across 13 municipalities, the study investigated which factors and variables influence how much students like school (i.e., an aspect of well-being). This study revealed general patterns in Danish public schools that influence both social and academic outcomes, helping to explain inequality and social marginalization in school. It demonstrates that feeling integrated into the classroom community is crucial for students’ well-being, and that girls perform better than boys in general, partly because of their school-adaptation abilities, which are also influenced to a small extent by background variables, including the mother’s educational level. The study, therefore, implies that students’ social skills are at the core of central challenges in primary educational settings.
Disentangling the Web of Marginalization
This study sheds light on the complex patterns of marginalization in Danish public schools based on the largest repeated cross-sectional survey in Danish educational history, which was conducted between 2015 and 2019 as part of the Program for Learning Management (PLM) school-development project (Qvortrup et al., 2016).
The data from PLM were gathered from multiple sources, including parents, class teachers, and students, which potentially reduces measurement error when analyzing complex inter-factor correlations (cf. Podsakoff et al., 2003). In educational research, Hattie (2015) emphasized the importance of accounting for the influence of background variables and factors when investigating associations among multiple variables within a single study. The data provided by PLM present an exceptional and unparalleled opportunity to effectively meet this requirement.
The Danish Ministry of Children and Education (MCE) implemented a comprehensive school reform in August 2014. Consequently, it has become a central political goal to improve students’ well-being and academic performance (MCE, 2020a). Hence, the Danish Student Well-Being Questionnaire (DSWQ) was developed, and since the school year 2014/2015 this national survey has been conducted annually to monitor student outcomes (MCE, 2020b). Although the DSWQ is generally considered the most comprehensive source of information on students’ well-being in Denmark (Knoop et al., 2016, 2017), it is limited to student responses, which is why the DSWQ does not provide the opportunity to study complex patterns of inclusion or marginalization that involve several actors. Two reports have concluded that the school reform has not improved students’ academic skills or well-being (V. M. Jensen et al., 2020; Nielsen et al., 2018), which is why it is critical to examine the relationships between social and academic outcomes to identify or clarify the underlying causes.
In education research, it is important to clarify the connection between academic and social factors (Hattie, 2015). Although findings have been ambiguous, existing studies indicate a significant association between well-being and learning (Gutman & Vorhaus, 2012; Lewis et al., 2011; Lyons & Huebner, 2016). This widespread view has resulted in an increased focus on well-being in public school systems in Scandinavia. Existing research points to several factors that may influence social and/or academic outcomes; for example, classroom inclusion (Havik, 2017; Knoop et al., 2017; Perry et al., 2019), parental involvement (Hattie, 2009; Jeynes, 2005, 2008, 2011; Pinquart & Ebeling, 2020), students’ social skills (Hattie, 2009; Knoop et al., 2018), gender (Egelund et al., 2018; Knudsen et al., 2005; Voyer & Voyer, 2014; Zlotnik, 2004), and social background (Hattie, 2009; L. B. Jensen et al., 2020; Nordahl, 2018).
Despite the insightful findings presented in previous analyses of PLM’s data (L. B. Jensen et al., 2020; Nordahl, 2018; Qvortrup et al., 2016) and the DSWQ (Knoop et al., 2016, 2017, 2018; Niclasen et al., 2018), it is noteworthy that these studies have predominantly focused on students at higher grade levels (Grades 4–10), primarily due to their more extensive survey participation.
One could therefore argue that there exists a knowledge gap concerning younger students (Grades 0–3; ages 6–9 on average), leading to the formulation of the following research question: Which crucial factors contribute to classroom inclusion, academic performance, and overall school liking in primary school?
Theoretical and Empirical Background
The following sections present the theoretical and empirical background, including the reasoning for the nine central hypotheses linked to the direct effects (H1–H6) and the indirect effects (H7–H9). In addition, the conceptual model is introduced along with the study’s central hypotheses ordered into both direct and indirect effects. Finally, the rationale for including control variables in the statistical model is explained.
Main Hypotheses Tied to the Four Factors
In a report on PLM, Adaptation to School Norms (ASN) was found to correlate with the parents’ educational level, suggesting that parents exert a significant influence on children’s social competencies (Nordahl, 2018). Similarly, the Organization for Economic Cooperation and Development (2012) found that involved and supportive parents play a crucial role in aiding their children’s development of necessary social and academic competencies. Hattie (2009) also highlighted parental involvement as a crucial factor that contributes to students’ social skills and academic performance. One possible explanation is that parents with higher education levels have a better understanding of the language used in schools, including their values and norms. As a result, their children are more likely to benefit and gain an advantage during their early years of schooling. It is worth noting that parental involvement is a multidimensional construct (Georgiou, 1996; Jeynes, 2008), which is why Parental Community (PC) was operationalized as a subdimension of parental involvement in this study. Specifically, it was expected that PC would positively affect ASN (see Figure 1: coefficient

Conceptual model depicting the inter-factor relations.
Educational research broadly suggests that parental involvement strengthens school outcomes, but researchers still lack an understanding of which components aid the most (Jeynes, 2008). Although parental involvement is evidently associated with positive outcomes beyond academic achievement, researchers still know relatively little about its effect on social outcomes, such as discrimination or bullying (Jeynes, 2008). Research indicates that parental involvement plays a protective role for at-risk students, shielding them from discrimination (Wang et al., 2018). Moreover, in a meta-analysis, Allen et al. (2018) discovered a significant correlation between parent support and school belonging—a concept often defined as “the extent to which the student feels personally accepted, respected, included, and supported by others in the school social environment” (Goodenow & Grady, 1993, p. 80). In this study, the factor Classroom Inclusion (CI) was measured, which concerns the individual student’s sense of inclusion, acceptance, or support in the classroom community. Hence, it was hypothesized that PC would be positively associated with CI (coefficient
Previous studies also suggest a link between parental involvement and academic achievement (Jeynes, 2005). A meta-analysis supports that parental participation, supportive parenting, as well as participation in school activities and communication with schools and teachers, enhance academic achievement (Rosenzweig, 2001). A more recent meta-analysis suggests that parents’ educational expectations improve students’ academic performance (Pinquart & Ebeling, 2020). Therefore, it was expected that PC would be positively associated with AP (coefficient
Given the expected variation in children’s social abilities and skills at school start (Hattie, 2009), ASN served as a mediator in the conceptual model. In PLM, social competencies were defined as “a set of skills, knowledge, and attitudes that are necessary to cope with different social environments or challenges, making it possible to establish and maintain positive social relations, which contribute to both increased well-being and academic skills” (Nordahl, 2018, p. 23; author’s translation). Thus, it was expected that ASN would positively affect both CI and AP (coefficients
The aforementioned six main hypotheses imply the presence of indirect effects, and based on the above empirical and theoretical considerations, it was expected that PC would affect AP, and that ASN would partly function as a mediator (coefficients
Inclusion and Marginalization
Marginalization is a multifaceted concept that involves exclusion and disempowerment. It is considered both a process and a state experienced by individuals or groups in society (Benjaminsen et al., 2015; Messiou, 2003, 2012). In educational research, marginalization can be measured on two subdimensions: (1) social marginalization, which involves feelings of being left out or bullied, and (2) academic marginalization, which pertains to limitations in academic participation and access to the curriculum (Messiou, 2003). Marginalization can occur in different social contexts, such as the classroom or the schoolyard (Messiou, 2012; Qvortrup & Qvortrup, 2018).
Inclusion is often seen as the opposite of exclusion, and marginalization is viewed as the state/process between exclusion and inclusion (Benjaminsen et al., 2015). The subjective experience of inclusion implies degrees of marginalization rather than a dichotomous categorization (Andersen, 2021).
In this study, social marginalization is examined at the classroom level in Danish primary schools, focusing on the factor Classroom Inclusion (CI; see Table 2).
The Sense of Social Inclusion and Well-Being
A quantitative study on the DSWQ showed that well-being was strongly influenced by the quality of student relations, whereas lower well-being was strongly associated with a lack of social inclusion (Knoop et al., 2017). Another Danish study on inclusion indicated that high-quality relations with teachers and peers are vital for students’ well-being (Perry et al., 2019). In line with these findings, research indicates that social exclusion can have detrimental effects on mental health and well-being, potentially leading to depression and anxiety (Graham et al., 2003; Rigby, 2000). Experiencing marginalization is commonly painful, but some students may overlook or lack awareness of their marginalized position (Messiou, 2003, 2012). International research highlights the significance of peer relationships and social support as essential buffers that counteract the negative consequences of social exclusion (Davidson & Demaray, 2007; Havik, 2017; Hodges et al., 1999; Rigby, 2000).
In summary, research indicates that promoting positive student relations and fostering a sense of social inclusion (i.e., reducing social marginalization) are essential for enhancing well-being. It was therefore expected that CI would be positively associated with school liking (SL; a key aspect of well-being). For this reason, SL was placed as the final, observed variable in the structural model (see Figure 2).

The proposed structural model.
The Conceptual Model
The conceptual model included four factors: Parental Community (PC), Adaptation to School Norms (ASN), Classroom Inclusion (CI), and Academic Performance (AP).
Figure 1 illustrates all possible pathways, derived from existing theory. This deductively inspired process yielded six primary pathways and nine main hypotheses, forming the foundation of a SEM model encompassing numerous combinations of variables.
The following one-directional hypotheses were assessed for all main variable relations involving two or three factors plus additional observed variables.
Direct Effects
H 1: PC improves ASN (PC → ASN).
H 2: PC improves CI (PC → CI).
H 3: PC improves AP (PC → AP).
H 4: ASN improves CI (ASN → CI).
H 5: ASN improves AP (ASN → AP).
H 6: CI improves AP (CI → AP).
Indirect Effects
H 7: PC boost AP through ASN (PC → ASN → AP).
H 8: PC enhances AP through CI (PC → CI → AP).
H 9: ASN enhances AP through CI (ASN → CI → AP).
In addition, all total effects are reported in the SEM analysis (see Table 6). The explained hypotheses (H1–H9) imply total effects.
Selection of Control Variables
In the following sections, the reasoning behind the selection of controls is explained since it is critical to control for confounding variables (Field, 2018). Although controls are selected from theory, they do not drive the main theory (Gaskin, 2016a, 2016b). Therefore, the conceptual model does not include any control variables (see Figure 1).
The Mother’s Educational Level
The cultural capital of parents influences their engagement in schools, potentially leading to disparities in both social and academic outcomes among students (Akselvoll, 2016, 2018). In Denmark, quantitative research has confirmed a significant impact of parents’ educational level on academic performance (L. B. Jensen et al., 2020; Nordahl, 2018). A meta-study by Desforges and Abouchaar (2003) suggested that highly educated parents are more actively involved in school practices, with maternal education being a strong predictor of parental engagement. To account for this, the mother’s educational level (MEL) was included as a central control variable.
Gender and Grade Level
Educational research has consistently found significant gender differences in both academic performance and well-being. International studies (e.g., Voyer & Voyer, 2014) as well as Danish research (e.g., L. B. Jensen et al., 2020; Nordahl, 2018; Qvortrup et al., 2016) have documented the existence of a gender gap in achievement, although the underlying causes are still under discussion (e.g., Egelund et al., 2018; Knudsen et al., 2005; Zlotnik, 2004).
A meta-analysis by Voyer and Voyer (2014) demonstrated a consistent advantage for females in school grades over several decades. Similarly, an analysis of PLM’s data from 2019 revealed that a smaller percentage of boys (70%) achieved high or very high academic performance (≥4 on a scale 1–5) compared to girls (78%) in Grades 0 to 3. This performance gap widened in Grades 4 to 10 (L. B. Jensen et al., 2020).
A Danish study revealed that girls tend to perform almost one grade higher than boys in ninth-grade graduation exams (Winter, 2020). The DSWQ also showed that girls generally reported a slightly higher liking for school compared to boys in Grades 0 to 3 (MCE, 2020c). In response to PLM’s survey question “Do you like school?” 70% of the girls agreed compared to 65% of the boys in 2015 (N = 28,063). The same applied to 68% of the girls and 59% of the boys in 2019 (N = 25,219).
In terms of the overall well-being of students (Grades 0–3), a previous analysis of PLM’s data revealed a significant difference (d = .11) between boys and girls (Egelund et al., 2018). The DSWQ also discovered significant gender differences in terms of general well-being among primary school students (MCE, 2020c). In line with these findings, international research suggests that girls tend to feel a greater sense of school belonging than boys in secondary school settings (Allen et al., 2018).
Given the previous findings, it was anticipated that girls would demonstrate a higher level of school liking (SL) compared to boys. Additionally, it was expected that SL would decline gradually from kindergarten to third grade, a trend that has been consistently observed in the DSWQ (MCE, 2020c).
Method
Data and Procedure
The analyzed data were extracted from Program for Learning Management (PLM; in Danish: Program for Laeringsledelse), which consisted of a partnership between Laboratory of Research-Based School Development from Aalborg University, Centre for Public Competence Development, and 13 municipalities. On three separate occasions, in 2015, 2017, and 2019, respectively, about 70,000 students (Grades 0–10) participated in a cross-sectional survey along with parents, teachers, class teachers, pedagogues, and school principals. More than 200 schools from 13 municipalities participated, resulting in a representative mapping of approximately 10% of the entire Danish school system (Qvortrup et al., 2016). The PLM survey comprised items (i.e., indicators) ordered into factors measured through different raters (incl. class teachers, students, and parents), which resulted in data particularly suitable for structural equation modeling (SEM), a multivariate technique useful for both testing and building theory on possible causal relations (Kline, 2016). Notably, including multiple raters is likely to reduce common method bias (Podsakoff et al., 2003).
In the present study, associations among several factors and observed variables were investigated. The conceptual model was built from empirical research, and CB-SEM was applied since the indicators were mainly considered reflective rather than formative (Hair et al., 2019). Since unexpected results are more likely to surface when analyzing complex variable relationships, this study also made use of exploratory procedures in the model building process. The data were prepared and initially analyzed in SPSS (version 27). Subsequently, SEM analysis was conducted in AMOS (version 27). Missing data analysis was conducted on the study’s 21 variables (17 indicators plus 4 single-item measures) that were analyzed in the structural model.
Table 1 displays a very high response rate (92–95%) for both students and class teachers across all measurement points. Responses by class teachers, parents, and students were tied together during the data collection process and subsequently merged into individual cases. Since all responses were anonymized, the data were treated as repeated cross-sectional surveys. The 40% complete cases in 2017 dropped to just 25% in 2019, mainly due to the lower response rate of parents—it is hard to achieve a response rate for parents above 50% (Nordahl, 2018). Since SEM with maximum likelihood (ML) estimation requires complete cases (implying listwise deletion) this approach was discarded because it would result in unacceptable information loss. Full information maximum likelihood (FIML) estimation was applied instead to estimate means of missing values. FIML produces the least biased estimates under most conditions compared to other methods (Enders & Bandalos, 2001). Although multivariate normality is assumed, FIML is considered robust when facing non-normal distributions if the sample size is large. Non-normal ordinal (incl. binary) variables can be analyzed with ML estimation if the sample is at least 10 times larger than the number of estimated parameters (Hair et al., 2019). In this study, a sample size of at least 2,430 (
Response Rate of Participants by Time Point.

Note. The average response rate was calculated across the study’s 21 variables. The number of survey responses is represented by “n”. Each class teacher provided multiple responses (one per student). Parents (the mother, father, or both) answered a shared questionnaire at one or multiple time points. Students answered a single questionnaire at one or multiple time points. The analyzed data were gathered from 185 schools in 2015, 179 schools in 2017, and 176 schools in 2019 (both regular and special schools).
Class teachers (or contact teachers) are responsible for specific classes or student groups.
To enhance generalizability a multi-model approach was utilized in which the SEM model was fitted across all measurement points. Using several measurement points can help cross-validate covariance structures (Cudeck & Browne, 1983). Although the parents’ response rate was lowest in 2019, the newest results are nonetheless the most relevant. By fitting the SEM model on each cross-sectional survey, the aim was to offset the weakness of the lower response rate in 2019. As evident from the SEM analysis, the results were highly similar across measurement points, indicating strong statistical generalizability to the population. To filter out unimportant correlations and enhance model reliability, pathways were only retained if statistically significant (p < .01) across all measurement points.
The Study’s Four Factors
Four factors (i.e., latent constructs) were measured using 4- and 5-point Likert scales (see Appendix 1 for descriptive statistics). The four factors were indirectly measured using three respondent groups: (1) class teachers, (2) parents, and (3) students. All factor names were translated into English. Depending on the applied theory, several factor names are viable when using SEM; the choice of factor label does not in any way affect the statistical results of a SEM analysis (Byrne, 2016; Field, 2018; Kline, 2016).
Academic Performance
Academic Performance (AP) was measured using a 5-point scale (1 = very low; 5 = very high). Class teachers evaluated each student’s performance in six subjects: Danish, math, English, natural sciences, reading, and music (Nordahl, 2018). This multi-item measure was developed based on prior research (Gresham & Elliot, 1990; Harter, 2012) and later adapted to suit the Nordic context (Nordahl, 2018; Sørlie & Nordahl, 1998).
Adaptation to School Norms
Adaptation to School Norms (ASN) was measured on a 4-point scale (1 = never; 4 = very often). Class teachers answered seven questions about students’ ability to adapt to school norms, which includes aspects such as maintaining order, following instructions, and attentive listening during talks or presentations. Originally, ASN was a component of the Social Skills Rating System (Gresham & Elliot, 1990) and later adapted to suit the Nordic context (Nordahl, 2018; Sørlie & Nordahl, 1998).
Parental Community
Parental Community (PC) was measured on a 4-point scale (1 = strongly disagree; 4 = strongly agree]. Parents answered seven questions about various aspects of the parental community, including contact with other parents and familiarity with other children in the class. This factor was originally used in research on parental involvement (Nordahl, 2000, 2003) and later adapted to PLM and named “Contact Between the Parents” (Nordahl, 2018, p. 64; author’s translation). In this study, the latent variable was labeled PC to better encompass the measured aspects, which arguably extend beyond mere contact between the parents (e.g., their ability to cooperate and actively work on improving the classroom environment; see Table 2, items PC1–PC7).
Exploratory Factor Analysis: Pattern Matrix.

Note. Extraction method: principal axis factoring. Rotation method: promax with Kaiser normalization. Cases excluded listwise. ASN = adaptation to school norms; PC = parental community; AP = academic performance; CI = classroom inclusion. Kaiser-Meyer-Olkin test = .91. Bartlett’s test of sphericity, p < .001. Extraction sum of squared loadings = 58.04%. Insubstantial factor loadings (λ < .3) were concealed to make the factor pattern more discernible.
All items were translated from Danish by the author.
Classroom Inclusion
Classroom Inclusion (CI) was assessed using a 4-point scale (1 = strongly disagree; 4 = strongly agree). Students answered four questions about classroom inclusion, covering aspects such as friendship and classmate support. To secure reliability and validity, younger children (Grades 0–3) answered simpler questions electronically, selecting smileys from four options (very unhappy → very happy) with adult guidance. This factor was developed based on prior research (Moos & Trickett, 1974) and later adapted to fit a Nordic context (Ogden, 1995; Sørlie & Nordahl, 1998) and named “Social Environment Between the Students” (Nordahl, 2018, p. 22; author’s translation).
In this study, the latent variable was labeled CI to reflect a theoretical focus on the psychological or subjective experience of belonging in the classroom, which concerns the individual student’s experience of inclusion, support, and acceptance by peers (cf. Goodenow & Grady, 1993; Qvortrup & Qvortrup, 2018; see Table 2, items CI1–CI4).
Control Variables and Single-Item Constructs
Controls are often included in larger SEM models in which multi-item and single-item constructs are mixed (Hair et al. 2019). When combining factors and observed variables, the model is considered partially latent (Kline 2016). All included controls and single-item constructs are described below.
The Mother’s Educational Level, Grade Level, and Gender
The mother’s educational level (MEL) was included as an exogenous variable, measured on an ordinal scale in four categories: (1) basic schooling, (2) general and vocational upper secondary education, (3) short and medium-cycle higher education, and (4) long-cycle higher education. Grade level (GL) was also included to explore variation across age groups in Grades 0 to 3. Gender differences were examined using the binary variable gender (1 = boy; 2 = girl).
School Liking
The single-item measure school liking (SL) was included as the final endogenous variable. SL was measured with the question “Do you like school?” on a 4-point scale (1 = strongly disagree; 4 = strongly agree). SL was an indicator within the well-being factor in PLM (Nordahl, 2018; Qvortrup et al., 2016). SL is measured annually in the DSWQ as a central indicator of well-being (MCE, 2020c).
Exploratory Factor Analysis
Exploratory factor analysis (EFA) was performed on the pooled data before proceeding with confirmatory factor analysis (CFA). Oblique rotation (promax) was applied rather than orthogonal since most social and psychological constructs are intertwined in reality (Field, 2018). Since all factors were considered reflective, principal axis factoring (PAF) was utilized. PAF considers common variance (co-variation), whereas principal component analysis accounts for total variance (Field, 2018). Each factor was assessed with Cronbach’s alpha (CA) that measures a scale’s internal consistency. Internal consistency is crucial for CB-SEM models based on reflective factors (Hair et al., 2019). It is commonly recommended that CA should be above .7 (Field, 2018). Initially, the internal consistency of the well-being factor was considered largely unreliable (α = .55). Therefore, well-being was measured with a single item instead (as school liking). CI was retained since it showed decent internal reliability (α = .73). The initial EFA included 33 indicators. All items with weak factor loadings (λ < .5) were removed to ensure adequate convergent validity in the CFA. Item AP6 (performance in music) was removed since it had the lowest factor loading of the congenial indicators measuring academic performance. Problematic items exhibiting substantial cross-loadings (<.2) were removed to ensure discriminant validity (Hair et al., 2019).
Table 2 displays the final EFA containing 24 indicators (9 removed). No items loaded substantially on multiple factors, supporting discriminant validity (Hair et al., 2019).
All four factors displayed acceptable to excellent internal reliability.
In Table 3 the factor correlation matrix supports discriminant validity as no correlation exceeded .7, which would imply a majority of shared variance (Hair et al., 2019). If intercorrelations among a set of indicators presumed to measure different constructs are not too high, discriminant validity is supported (Kline, 2016).
Factor Correlation Matrix.
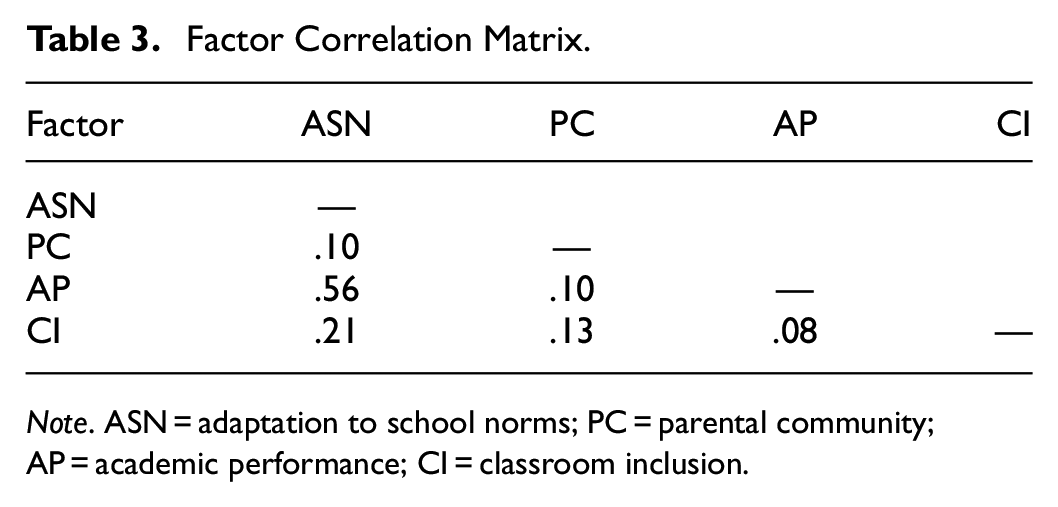
Note. ASN = adaptation to school norms; PC = parental community; AP = academic performance; CI = classroom inclusion.
The correlation between ASN and AP was moderate (r = .56). This significant correlation was expected as these factors were measured using common raters (class teachers). Although common method bias could partially influence the regression weights, especially between ASN and AP, discriminant validity was sufficiently supported (see Limitations).
Confirmatory Factor Analysis
Having established a factor model from EFA, the initial measurement model was assessed using common fit indices (cf. Kline, 2016). Before forming the final structural model, the measurement models were compared consecutively and trimmed.
Table 4 shows the absolute fit of the initial measurement model, indicated by the chi-square (
Fit Indices and Model Comparisons.

Note. Maximum likelihood estimation was applied across all measurement points (2015–2019).
CFI = comparative fit index; RMSEA = root mean square error of approximation; SRMR = standardized root mean square residual.
ASN6 (λ = .83), PC7 (λ = .56), and PC4 (λ = .58) were removed due to item redundancy; ANS1 (λ = .83), PC6 (λ = .63), and PC3 (λ = .83) were retained.
AP4 (λ = .66) and ASN8 (λ = .75) were removed; AP3 (λ = .72) and ASN7 (λ = .86) were retained.
PC6 (λ = .60) was removed; PC1 (λ = .65) was retained.
Two pairs of error terms (ASN3 and ASN5; AP1 and AP3) were allowed to covary.
CI1 (λ = .59) was removed to increase the average variance extracted and convergent validity.
Full information maximum likelihood was applied to all observations to handle missing values in the structural model. Insignificant pathways (p > .05) were removed (MEL → CI; AP → SL; PC → SL; Gender → CI).
p < .001.
Alternatively, researchers can assess the normed (relative) chi-square (
To assess convergent validity, the average variance extracted (AVE) and its square root was calculated for each factor. The initial measurement model had weak convergent validity since the AVE for CI was .39, below the recommended threshold of .5 (Hair et al., 2019), and about .5 for PC. No problems were detected with composite reliability (CR) since all factors had CR-values above .7 (Hair et al., 2019).
Table 5 shows that discriminant validity is supported since the square root of AVE on each factor (marked in bold) is larger than the inter-factor correlations (Hair et al., 2019). Item CI1 was removed to increase AVE and improve convergent validity for CI, which increased the AVE from .42 to .45. By removing item CI1, CR was reduced from .74 to .71. It was not possible to reach the commonly recommended value for AVE (>.5) with three indicators on each construct (Hair et al., 2019). However, some researchers argue that an AVE just below .5 is acceptable if CR is above .7 (Gaskin 2016a; Malhotra, 2011). Removing another item from the factor CI would bring CR below the critical value of .7 (Hair et al., 2019). Moreover, it is generally recommended that factors should be measured with at least three indicators (Hair et al., 2019). Thus, removing additional items would hurt the factor’s internal consistency. CI was therefore considered optimal with three indicators since removing additional indicators would result in inadequate values for both CR and CA. The three other factors exhibited no issues in relation to CR or AVE, supporting reliability and validity.
Validity Analysis of the Factors.

Note. Analysis conducted using the Master Validity Tool for Amos (Gaskin & Lim, 2019). CR = composite reliability; AVE = average variance extracted; MSV = maximum shared variance; MaxR(H) = maximum reliability. CI = classroom inclusion; PC = parental community; AP = academic performance; ASN = adaptation to school norms.
p < .001.
Results
Based on commonly applied criteria, R2-values of .02, .13 and .26 are considered small, medium, and large, respectively (Cohen, 1988). Significant R2-values below .02 are considered very small (cf. Sawilowsky, 2009). All results were standardized to allow for comparisons with other studies (Field, 2018). The following main results of T3 (2019) were revealed (p < .001) with the strongest effects (i.e., correlations) listed first:
Strong and Moderate Effects
A strong direct association was found between ASN and AP (β = .59; R2 = .35).
A moderate direct association was found between CI and SL (β = .39; R2 = .15).
Small Effects
A direct association was found between gender and ASN (β = .27; R2 = .07); gender indirectly affected AP through ASN (β = .16; R2 = .03).
A direct association was revealed between ASN and CI (β = .20. R2 = .04).
MEL directly affected AP (β = .11; R2 = .01). The total effect was substantially stronger (β = .20; R2 = .04), partly mediated by ASN (β = .08; R2 = .01).
MEL directly affected ASN (β = .13; R2 = .02).
GL had a total effect on CI (β = −.13; R2 = .02) and SL (β = −.19; R2 = .04).
Very Small Effects
PC was directly associated with ASN (β = .11; R2 = .01) and had a total effect on CI (β = .12; R2 = .01).
PC had a total effect on AP (β = .11; R2 = .01).
All results were cross-validated using multigroup SEM analysis. The results were remarkably similar across T1 (2015), T2 (2017), and T3 (2019), although the negative association between GL and CI was strongest in 2019.
Table 6 displays all ML estimates of the direct, indirect, and total effects for T1 (2015), T2 (2017), and T3 (2019), respectively. These results are discussed in the following section.
Maximum Likelihood Estimates of Direct, Indirect, and Total Effects.
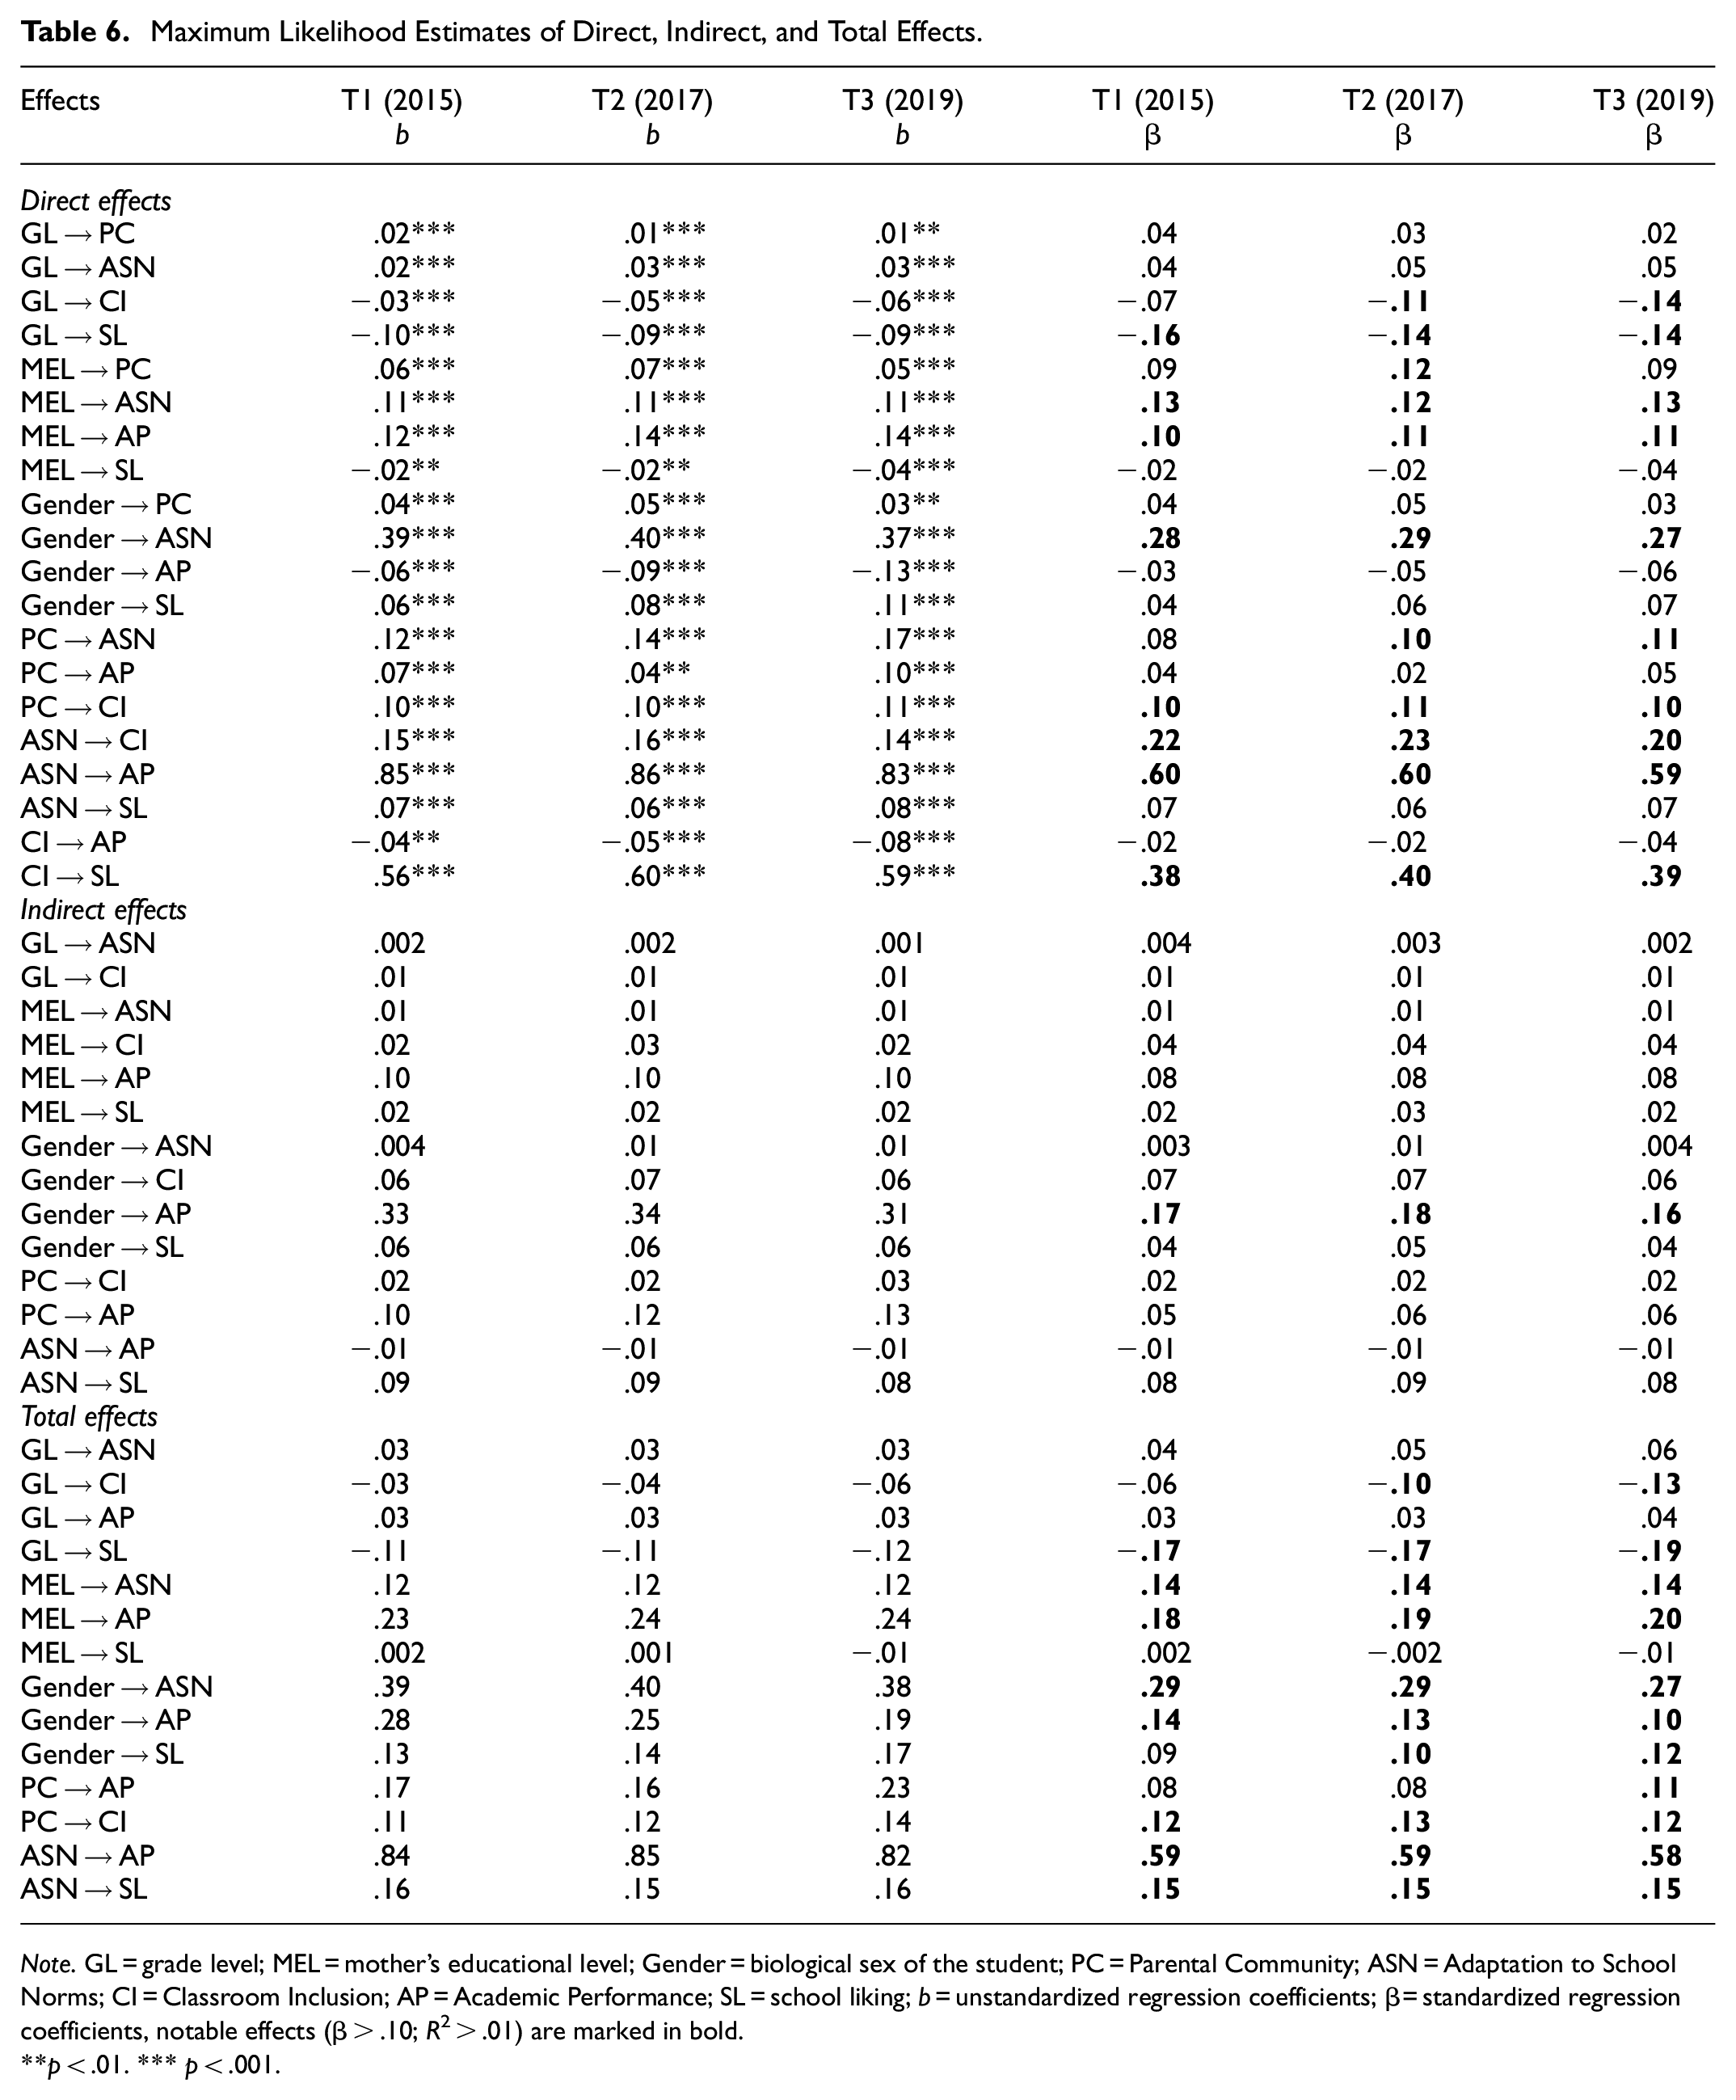
Note. GL = grade level; MEL = mother’s educational level; Gender = biological sex of the student; PC = Parental Community; ASN = Adaptation to School Norms; CI = Classroom Inclusion; AP = Academic Performance; SL = school liking; b = unstandardized regression coefficients; β = standardized regression coefficients, notable effects (β > .10; R2 > .01) are marked in bold.
p < .01. *** p < .001.
Discussion
As Figure 2 shows, the strongest direct association was found between ASN and AP (R2 = .35), suggesting that well-behaved students, who adapt well to school norms, generally exhibit superior academic performance (supporting H5), accentuating the well-known link between social skills and academic performance (Hattie, 2009). Conversely, this indicates that students who exhibit problematic behavior generally have weaker academic performance. Thus, poorly rated students are seemingly more likely to experience academic marginalization (cf. Messiou, 2003, 2012).
Surprisingly, gender and AP were not directly related. Instead, ANS mediated the effect of gender on AP (R2 = .03), revealing the strongest indirect effect. This indicates that girls perform better because they are superior at adapting to school norms, partly explaining the association between gender and AP previously found in PLM (L. B. Jensen et al., 2020; Nordahl, 2018). It is an ongoing debate what causes the widespread gender gap in performance (e.g., Egelund et al., 2018), which is already present at the primary school level (L. B. Jensen et al., 2020). As a contribution to this ongoing dispute, in which some have argued that modern schools are better suited for girls (e.g., Egelund et al., 2018; Winter, 2020; Zlotnik, 2004), this study suggests that social skills are crucial for academic performance and that hardly any gender disparity appears when controlling for the impact of school-adaptation ability. Thus, girls seem to perform better academically mainly because of their superior school-adaptation ability.
Both MEL (R2 = .02) and PC (R2 = .01) influenced ASN, suggesting that the mother’s educational level and the parental community positively influence students’ school-adaptation ability (supporting H1). Hattie (2009) argued that higher SES students quickly gain an unfair advantage because their parents know the language of schooling better. Both MEL (β = .08) and PC (β = .06) indirectly affected how students were judged in terms of AP (supporting H7). The combined indirect effect of MEL and PC on AP was weak (R2 = .02). Although no support was found for a direct effect between PC and AP (rejecting H3), PC had a positive but very small total effect on AP (R2 = .01). Thus, the results indicate that the mother’s educational level and the parental community of the classroom correlate positively (to a small extent) with the children’s school-adaptation ability and academic performance.
The second strongest direct effect was found between CI and SL (R2 = .15), suggesting that classroom inclusion moderately improves school liking of the individual student. In other words, students who experience classroom inclusion tend to like school more. This moderate effect suggests that inclusionary practices in the classroom are vital for promoting students’ well-being. According to a report on the DSWQ, this pattern also holds true for students in Grades 4–9 (Knoop et al., 2017).
Moreover, ASN was directly associated with CI (R2 = .04), indicating that adaptation to school norms positively affects classroom inclusion for individual students (supporting H4). No indirect effect was present on AP from either ASN or PC (rejecting H8 and H9). GL had a negative (total) effect on CI (R2 = .02). Students seemingly tend to experience less classroom inclusion (i.e., greater social marginalization) as they progress from kindergarten to third grade. A related study also discovered a decline in students’ perception of classroom interaction as they progressed through higher grade levels (Havik, 2017). Surprisingly, CI was not associated with AP (rejecting H6).
Furthermore, the association between SL and AP was insignificant (p > .05), providing evidence that both classroom inclusion and school liking are not associated with academic performance for students in Grades 0–3. Although research indicates that girls tend to have higher levels of school liking from kindergarten to third grade in Denmark (Egelund et al., 2018; MCE, 2020c), the total effect of gender (biological sex) on SL (R2 = .01) was very small. This suggests that gender alone does not cause school liking, necessitating exploration of other explanations.
Finally, a very weak direct link was found between PC and CI (R2 = .01). Apparently, children whose parents are more involved in the parental community feel a bit more included in the classroom (supporting H2), which somewhat confirms related research on discrimination and victimization (Jeynes, 2008; Wang et al., 2018).
Limitations
A recursive model was chosen since non-recursive models should generally be avoided on cross-sectional data because of issues with statistical identification (Hair et al., 2019). A recursive model does not account for possible feedback-loops or reciprocal effects (Byrne, 2016). Causal inference must therefore be performed with care, which is especially the case when variables are measured with cross-sectional data (Field, 2018).
Although SEM offers the advantage of potentially incorporating multiple endogenous factors in a single model (Kline, 2016), this study did not address the potential geographical variations across schools and municipalities identified in related education research (Allen et al., 2018). Moreover, the CI construct was somewhat limited. Although an acceptable value for CR was reached through model re-specifications, the AVE of .45 was slightly below the recommended .5 threshold (Hair et al., 2019). Thus, the results on CI should be interpreted with caution. In addition, ASN and AP were measured using common raters, which is known to increase the risk of common method variance (CMV; Podsakoff et al., 2003). CMV can either inflate or deflate parameter estimates, making true effects unclear. Therefore, the regression weights between ASN and AP should be interpreted with caution.
Harman’s (1967) single-factor test was employed to assess the level of CMV. All 21 variables were loaded into an EFA, after which the unrotated factor solution was examined (cf. Podsakoff et al., 2003). Harman’s test only revealed 28.2% of shared variance, which is acceptable according to this standard diagnostic technique.
Conclusions
In response to the research question “Which crucial factors contribute to classroom inclusion, academic performance, and overall school liking in primary school?” the results strongly indicate that children’s social abilities are vital for both social and academic outcomes. Overall, the findings reveal a complex interplay among gender and social background variables, which influences both social and academic outcomes.
The main finding suggests that enhancing students’ social skills would likely boost both social and academic outcomes. Girls seemingly perform better academically partly because they are better at adapting to school norms, implying that boys with adaptation difficulties are more likely to experience academic marginalization. In addition, children of higher educated mothers seemingly demonstrate greater social skills and perform better academically. Thus, educators could aid students in developing their social skills to diminish the gender gap in achievement—a common international challenge in the field of education (Voyer & Voyer, 2014). This study suggests that strengthening classroom inclusion is crucial since high-quality relations enhance school liking, which Danish school research confirms (Knoop et al., 2017; Perry et al., 2019).
In addition, this study suggests that students with greater school-adaptation abilities more often experience classroom inclusion, which might explain gender differences in school liking previously observed in Denmark (Egelund et al., 2018; MCE, 2020c). There is a tendency for classroom inclusion to weaken and school liking to drop as children progress in grade level. This gradual drop in school liking from kindergarten to third grade was similarly found in the DSWQ (MCE, 2020c).
Finally, the parental community had a limited but positive impact on students’ school adaptation, academic performance, and classroom inclusion. Thus, educators could work on strengthening the parental community to improve both social and academic outcomes. A meta-analysis has also emphasized the need for increased collaboration among home, school, and communities involving parents to create a supportive school atmosphere (Allen et al., 2018).
Further research is needed to clarify the mechanisms underlying the observed variable associations as this study primarily focused on identifying significant variable associations and estimating their crucial effects. While the identified patterns primarily pertain to the Danish public-school context, it is anticipated that key patterns are internationally relevant in other Western or Nordic countries.
Footnotes
Appendix 1
Descriptive Statistics of the Study’s 21 Items in the Structural Model.

| Items | N | Minimum | Maximum | Mean | SD | Skewness | Kurtosis | |||
|---|---|---|---|---|---|---|---|---|---|---|
| Statistic | Statistic | Statistic | Statistic | SE | Statistic | Statistic | SE | Statistic | SE | |
| SL | 25,218 | 1 | 4 | 3.51 | 0.01 | 0.74 | −1.58 | 0.02 | 2.13 | 0.03 |
| GL | 26,684 | 0 | 3 | 1.57 | 0.01 | 1.12 | −0.08 | 0.02 | −1.37 | 0.03 |
| Gender | 26,684 | 1 | 2 | 1.49 | <0.01 | 0.50 | 0.05 | 0.02 | −2.00 | 0.03 |
| MEL | 9,396 | 1 | 4 | 2.77 | 0.01 | 0.80 | −0.22 | 0.03 | −0.43 | 0.05 |
| CI2 | 25,065 | 1 | 4 | 3.63 | <0.01 | 0.71 | −2.01 | 0.02 | 3.59 | 0.03 |
| CI3 | 25,035 | 1 | 4 | 3.48 | 0.01 | 0.83 | −1.63 | 0.02 | 1.90 | 0.03 |
| CI4 | 25,024 | 1 | 4 | 3.61 | <0.01 | 0.68 | −1.86 | 0.02 | 3.24 | 0.03 |
| ANS1 | 25,713 | 1 | 4 | 3.03 | 0.01 | 0.79 | −0.40 | 0.02 | −0.46 | 0.03 |
| ASN2 | 25,711 | 1 | 4 | 2.90 | 0.01 | 0.91 | −0.46 | 0.02 | −0.61 | 0.03 |
| ASN3 | 25,705 | 1 | 4 | 2.92 | 0.01 | 0.83 | −0.26 | 0.02 | −0.67 | 0.03 |
| ASN4 | 25,717 | 1 | 4 | 2.67 | 0.01 | 0.91 | −0.09 | 0.02 | −0.83 | 0.03 |
| ASN5 | 25,687 | 1 | 4 | 2.92 | 0.01 | 0.88 | −0.39 | 0.02 | −0.65 | 0.03 |
| ASN7 | 25,713 | 1 | 4 | 2.56 | 0.01 | 0.91 | −0.01 | 0.02 | −0.80 | 0.03 |
| AP1 | 25,461 | 1 | 5 | 3.26 | 0.01 | 1.01 | −0.13 | 0.02 | −0.30 | 0.03 |
| AP2 | 25,044 | 1 | 5 | 3.29 | 0.01 | 0.96 | −0.10 | 0.02 | −0.14 | 0.03 |
| AP3 | 21,132 | 1 | 5 | 3.07 | 0.01 | 0.90 | −0.10 | 0.02 | 0.49 | 0.03 |
| AP5 | 22,487 | 1 | 5 | 3.20 | 0.01 | 1.11 | −0.15 | 0.02 | −0.51 | 0.03 |
| PC1 | 9,193 | 1 | 4 | 3.04 | 0.01 | 0.66 | −0.47 | 0.03 | 0.72 | 0.05 |
| PC2 | 9,227 | 1 | 4 | 2.96 | 0.01 | 0.73 | −0.40 | 0.03 | 0.06 | 0.05 |
| PC3 | 9,188 | 1 | 4 | 2.67 | 0.01 | 0.75 | −0.17 | 0.03 | −0.26 | 0.05 |
| PC5 | 9,194 | 1 | 4 | 2.83 | 0.01 | 0.70 | −0.31 | 0.03 | 0.12 | 0.05 |
Note. SL = school liking; GL = grade level (kindergarten to third grade); Gender = biological sex of the student (1 = boy; 2 = girl); MEL = mother’s educational level; CI = classroom inclusion; ASN = adaptation to school norms; AP = academic performance; PC = parental community. T3 data (2019).
Acknowledgements
I am grateful to my main supervisor, Professor Jacob Brix, for his continuous support, and to my co-supervisor, Associate Professor Antonia Scholkmann, for her skilled feedback on the first draft of this paper. Additionally, I extend my thanks to all the children, parents, and teachers who participated in PLM’s surveys, along with Professor Thomas Nordahl for his inspirational work on PLM.
Declaration of Conflicting Interests
The author declared no potential conflicts of interest with respect to the research, authorship, and/or publication of this article.
Funding
The author received no financial support for the research, authorship, and/or publication of this article.
Ethical Approval
All survey responses were anonymized in adherence to ethical standards.
Data Availability Statement
Data sharing not applicable to this article as no datasets were generated or analyzed during the current study.