
Abstract
The Digital Stress Scale (DSS) is used to measure digital stress, which is the perceived stress and anxiety associated with social media use. In this study, the Chinese version of the DSS was validated using a sample of 721 Chinese college students, 321 males and 400 females (KMO = 0.923; Bartlett = 5,058.492, p < .001). Confirmatory factor analysis (CFA) and item response theory (IRT) revealed that the five-factor model fits our data best. And the good criterion validity was shown through the association of the Chinese version of the DSS with anxiety and depression. The results of measurement invariance supported that the scale has measurement equivalence across the region (rural or urban). However, they did not support strict measurement invariance across gender. Overall, our results suggest that the DSS is an ideal tool for measuring digital stress in a Chinese sample. People can benefit from assessing digital stress, which has the potential to moderate the relationship between social media use and mental health. These psychometric investigations of the DSS will allow future research to investigate construct validity better.
Plain language summary
Purpose: We aimed to assess the Psychometric Properties of the Chinese version of the Digital Stress Scale (DSS) among adolescents. Methods: First, we finished the Chinese version of the Digital Stress Scale by back-translation procedure and pre-test. Second, the internal consistency, criterion-related validity, construct validity, measurement equivalence and item analysis of the scales were tested. Conclusions: The DSS is a great instrument for measuring digital stress in a Chinese sample. Confirmatory factor analysis (CFA) and item response theory (IRT) revealed that the five-factor model fits our data well. The results of measurement invariance supported that the scale has measurement equivalence across the region (rural or urban). However, the scale did not show strict measurement invariance across gender. The criterion-related validity and internal consistency were great. Implications: People can benefit from assessing digital stress, which has the potential to moderate the relationship between social media use and mental health. Limitations: First, this study does not provide specific suggestions for future item modifications. Second, research samples are not conducive to the generalization of our findings. Third, this research does not use measures to answer a substantive developmental question using additional variables.
Keywords
Introduction
Social media are immensely popular among Chinese college students, and pervasive in many parts of their lives, from life entertainment to interpersonal interactions. Especially during the global pandemic of COVID-19, all kinds of social media, such as massive open online courses (MOOCs), Rain Classroom, WeChat, QQ, Tencent Meeting, and Ding Talk, have developed and gradually been employed as learning tools in the classroom (Su et al., 2021). However, the increased use of social media by students has led to concerns about possible associations between digital media use and mental health (Twenge & Campbell, 2019). Previous studies have reported that the frequent use of social media may lead to negative emotional stresses, including poor sleep quality, anxiety, depression, lower self-esteem, loneliness, and social stress (Banjanin et al., 2015; Barry et al., 2017; Ehrenreich & Underwood, 2016; Woods & Scott, 2016). Digital stress is a relatively new phenomenon among the negative outcomes of social media use. And it has not been widely concerned in China by researchers. Measuring digital stress is useful for assessing the mental health of Chinese college students. To address this gap in the literature, the present study will adapt the original version of the China College Students’ Digital stress scale (DSS), test its psychometric characteristics, and evaluate its effect in the China sample. It is expected to provide references for future research on the clinical effects of DSS.
Social Media, Mental Health, and Digital Stress
Social media means a variety of Internet-based networks that enable adolescents to create content and interact with others verbally and visually (Carr & Hayes, 2015; Testa et al., 2020). Keles et al. (2020) conducted a systematic narrative review and stated that the relationship between social media use and mental health problems is correlational but not conclusively causative. Odgers and Jensen (2020) summarized the linkages between digital technology usage and adolescent mental health. They documented a small association between social media usage and well-being. Moreover, there are mixed opinions about social media. Some studies concluded that the effects of social media use were positive, while others found that the effects were negative. In a systematic review, Liu et al. (2019) conducted a more focused review of different types of social media use and well-being. They found that the association between digital media use and well-being also depends on how the technology is used. Interaction, self-presentation, and entertainment on social media were positively correlated with well-being, whereas content consumption, such as browsing, was negatively associated with well-being. And above all, most adolescents have experienced both optimism and pessimistic about social media usage. While social media promote interpersonal interactions and allow users to communicate information and express personal experiences, the possible disadvantages of social media should not be underestimated. The emergence and intensive use of social media induce bad behaviors and decrease health both mentally and physically. These negative aspects are the following research priorities. It may help us facilitate individualized prevention and intervention strategies to help individuals maintain or improve their mental health.
Reilly (2020) conducted a survey with adolescents aged 11 to 18 years to discuss the good and bad sides of social media use. On the negative side, they found that the constant use of their devices is associated with sleep quality. One of the narratives in their studies of participants was that always being online makes them wait for responses and not being able to sleep. Moreover, social media usage pressurizes users and holds a potential risk for low mood or anxiety. Adolescents with a strong desire to be accepted tend to excessively compare themselves with others, and focus on the negative aspects of themselves. Taking posting on social media as an example, many adolescents experience high levels of anxiety due to the fear of receiving negative comments online (Calancie et al., 2017). In general, the need to maintain intimacy or close connections with others through social media contributes to rising stress (Weinstein & Selman, 2016). Digital stress is one of the stress responses to social media use that comes with anxious emotions. Hall et al. (2021) defined digital stress as stress and anxiety from notifications or social media usage.
Some people experience digital stress due to social media demands. A study has investigated the psychological health effects of digital stress based on a representative survey of 1,557 German Internet users (Reinecke et al., 2017). They found that the frequent use of social media, including sending, receiving and checking messages, may increase perceived stress. The study by Nick et al. (2022) investigated the self-reported digital stress of students. Some descriptive statistics described those individuals with higher levels of social media usage reported higher levels of digital stress. Therefore, digital stress may be an important intervening factor between digital social media usage and mental health outcomes (Steele et al., 2020). This study considers digital stress one of the most important predictors of negative mental health and may predict the level of mental health related to social media use among adolescents.
The Digital Stress Scale
The preliminary theoretical model of digital stress, as indicated by Steele et al. (2020) via a summary of relevant literature, consists of four components, including availability stress, recognition anxiety, fear of missing out, and communication overload. Hall et al. (2021) validated the latent factor structure of digital stress through exploratory factor analysis (EFA) and Confirmatory factor analysis (CFA) to develop the digital stress scale. It is a five-point Likert-type scale including 24 items and consisting of five dimensions: connection overload, approval anxiety, online vigilance, availability stress, and fear of missing out.
The digital stress scale (DSS) was significantly associated with depressive symptoms, anxiety, and stress, and its reliability and validity were satisfactory (Hall et al., 2021). Connection overload is a phenomenon that involves people being constantly distracted from important life activities by multiple social media platforms, and these distractions are ubiquitous and frequent (LaRose et al., 2014). Likewise, availability stress is the internalization of peer expectations, where individuals are constantly in a state of availability and respond to information through digital means (Hall et al., 2021). Approval anxiety reflects anxiety about others’ comments and reactions to social media posts and images. Online vigilance affects perceived stress levels by promoting and intensifying permanent connected media usage patterns (Freytag et al., 2021). Finally, FoMO has been linked to increased use of social media (such as Facebook) and preoccupation with feeling unpopular or isolated on it (Beyens et al., 2016).
Measurement Invariance of the DSS Across Gender and Region
Measurement invariance can be used to determine whether scale items have the same meaning and function across groups. For example, recent research has examined gender differences on social networking sites (Choi, 2022). The envy generated by passive social media use lowers subjective well-being, and this effect is stronger among women. Adolescent girls spend more time on smartphones than boys, and the associations between heavy digital media use and low psychological well-being are also greater (Twenge & Martin, 2020). However, there is nothing to know whether this difference is brought about by the gender of the sample itself or is induced by the scale. It is valuable to establish that the scales of measured constructs across the gender examined have the same meaning and that there are no biases and differences in the meaning of items. This study will investigate whether DSS is equivalent across gender.
Furthermore, the regional differences in China’s urban-rural gap are large. The previous researchers suggest that there are unavoidable differences between rural and urban areas within China in terms of the living environment, economic development, and education (Lai et al., 2013; Zhang et al., 2018). Comparing the items consistently of DSS between the city and rural students is useful. Therefore, our study also estimates whether DSS is equivalent across regions.
Aims of the Present Study
The current research aimed to validate the Chinese version of the DSS among college students. We paid particular attention to participants’ mental health when using digital social media. Digital media gives the impression that it is a tool to provide convenience services (Davis, 2012). This impression may shift with various psychological vulnerabilities. Digital stress is a form of technology-related psychological stress arising from digital media activities, which is associated with well-being, anxiety, depression, and loneliness in varying degrees (Ahn, 2011; Reinecke et al., 2017; Twenge, 2019). Thus, this study sought to predict the level of mental health associated with adolescent social media use through digital stress. At the same time, the hypotheses related to validating the Chinese version of the DSS among Chinese college students were proposed.
Based on the theoretical model of Hall et al.’s (2021), digital stress should consist of five separate but related components, including connection overload, approval anxiety, online vigilance, availability stress, and fear of missing out. And the evidence suggests that the reliability and validity of the five-factor model is adequate. We expected the five-factor model to fit our data well. Therefore, we hypothesized that the factor structure of DSS in the Chinese sample conformed to the five-factor model (H1). In this regard, Confirmatory factor analysis (CFA) was used to confirm the factor structure of the DSS.
Second, the Criterion-Related validity and internal consistency. DSS would be expected to be positively associated with social anxiety and perceived stress (H2).
Third, the rigorous CFA-based multi-group comparison was used to investigate the scale’s measurement invariance across gender and region. We hypothesized that the Chinese version of the DSS would exhibit rigorous measurement invariance across Chinese college students of different genders and regions (H3).
Finally, IRT analyses were performed to evaluate the psychometric properties using Chinese samples. The present study hypothesized that the Chinese version of the DSS has good psychometric properties (i.e., item parameters, item characteristic curves, and test information) within the IRT framework (H4).
Materials and Methods
Participants and Procedure
The sample consisted of 721 university students (both undergraduates and graduates) recruited from universities or through advertisements on the Internet. All were citizens of China studying at universities in Southeastern China. During the formal test process, participants took a total of 25 min to complete the online questionnaire which included the Chinese versions of the DSS, the Social Interaction Anxiety Scale-6 and the Social Phobia Scale-6 (SIAS-6/SPS-6), and the Perceived Stress Scale-10 (PSS-10). All study procedures involving human participants followed institutional ethical standards, and all participants provided oral informed consent.
The final sample consisted of 721 Chinese students, with 321 males (44.5%) and 400 females (55.5%) ranging in age from 17 to 33 years (M = 19.76, SD = 1.936). The sample came primarily from rural areas (63.5%), while 36.5% were city residents. Only 14.0% indicated they were graduate students, the rest were undergraduates (86%), which included freshmen (31.8%), sophomores (38.1%), juniors (15.0%), and seniors (1.1%).
Measures
The Digital Stress Scale (DSS)
The original version of the Digital Stress Scale (DSS) consists of 24 items (Hall et al., 2021). Five factors are part of DSS: Connection overload (CO, 6 items), Approval anxiety (AA, 6 items), Online vigilance (OV, 4 items), Availability stress (AS, 4 items), and Fear of Missing out (FoMO, 4 items). Each item uses a five-point Likert-type response format ranging from 1 (“never”) to 5 (“always”) to assess subscales. The Cronbach’s
The Social Interaction Anxiety Scale-6 and the Social Phobia Scale-6 (SIAS-6/SPS-6)
The Social Interaction Anxiety Scale (SIAS) and the Social Phobia Scale (SPS) are companion questionnaires developed by Mattick and Clarke (1998). The SIAS-6/SPS-6 are short versions of the SIAS/SPS scales, and are the most commonly used instruments to assess social anxiety. The SIAS-6/SPS-6 has 12 items, and each item is rated on a five-point Likert scale ranging from 1 (“not at all characteristic of me”) to 5 (“extremely characteristic of me”). The Chinese version of the SIAS-6/SPS-6 has been shown to have excellent psychometric properties in Chinese samples (Ouyang et al., 2020). In the current study, Cronbach’s
The Perceived Stress Scale-10 (PSS-10)
The 10-item version of the Perceived Stress Scale (PSS-10) is a self-report scale used to assess respondents’ self-perceived stress levels (Cohen & Williamson, 1988). Each item is rated on a five-point Likert scale ranging from 1 (“never”) to 5 (“very often”), with items 4, 5, 7, and 8 being reversed scores. Total scores are calculated by adding the response rating of each item, with higher scores representing higher levels of perceived stress. Lu et al. (2017) have reported that the PSS-10 scale shows adequate internal consistency among Chinese undergraduates (
Statistical Analysis
Factor Structure
CFA was conducted to validate the Chinese version of the DSS’s structure in Chinese samples with Mplus7.4 (Muthén & Muthén, 1998–2015). The chi-square (χ2), root mean square error of approximation (RMSEA), standardized root mean square residual (SRMR), comparative fit index (CFI), and Tucker-Lewis index (TLI) were used to evaluate the model fit. The smaller the value of χ2, the better the model fit. However, χ2 is easily affected by sample size, which increases the probability of model rejection. Therefore, we used the ratio of chi-square to degrees of freedom (χ2/df) instead of the chi-square (χ2). RMSEA and SRMR values less than 0.08, and CFI and TLI values above 0.90 were considered acceptable (Hu & Bentler, 1998; Steiger, 1998).
Internal Consistency and Criterion-Related Validity
Cronbach’s
Measurement Invariance
Measurement invariance shows that a measure is able to provide similarly accurate measurements of the same property under different conditions (Drasgow, 1984; Horn & McArdle, 1992). Multi-group CFA is the most commonly used method to determine measurement invariance in structural equation mode (Van De Schoot et al., 2015). The invariance test is a continuous procedure that gradually constrains the measured parameters (i.e., factor loadings, item thresholds, and residuals) to ensure that they are equal in the sample population at each level of invariance. The model from the previous step is nested in the model from the next stage, with the last model becoming progressively constrained. The exact procedure for assessing invariance is as follows: the Configural Invariance model (no invariance); the Metric Invariance model (factor loading invariant); the Scalar Invariance model (item intercepts invariant as well as the factor loading invariant); and finally, the Strict Invariance model (item uniqueness invariant, factor loading invariant, and item intercept invariant). The model fit indices were used to examine whether there was support for parameter invariance. For example, the constrained model is supported if the decrease in CFI and TLI is less than 0.01 compared to the previous model. When the RMSEA changes are smaller than 0.2, this is also considered to be evidence of a high-quality model. Chi-square difference testing is also performed to compare the less restrictive model with the other more restricted models (Cheung & Rensvold, 2001, 2002). However, significant differences in the chi-square difference test are highly likely to be influenced by the sample size.
IRT Analyses
Given the DSS’s five response options, a graded response model (GRM; Samejima, 1969) was used for the IRT analyses. If we score an item in a graded manner, the amount of information provided by an individual item or a test is greatly increased. The subject’s underlying ability will be denoted by
PARSCALE 4.1 was used to draw ICCs and test information curves to establish a clear representation of each item’s characteristics. The ICC can be used to describe the relationship between the probability of the correct response to an item and the ability scale. Test information curves are obtained by totaling all item information curves. An item information curve is a graph of the information function that compares the amount of information to a level of ability. The accuracy of the subject’s true ability level can be ensured based on the amount of information available at this ability level. Furthermore, item information is directly connected to measurement standard error (SE). The smaller the standard error of measurement, the more information there is in the test. The item offers the greatest amount of information to subjects at the ability level corresponding to the difficulty parameter.
The Translation Process of the DSS
Stage 1
The current research aimed to follow the rigorous back-translation procedure to create the Chinese version of the DSS (Brislin, 1986). First, the DSS was translated independently by two bilingual researchers (including the first author). During the translation, some disagreements were resolved through discussion. For example, terms that did not match the original intended meaning were revised (“Facebook” in the English version of the measure was replaced with “WeChat” in the Chinese version). Then another bilingual researcher translated the Chinese version back to English without referring to the original version of the DSS. The items in the two English versions were compared word by word. Finally, translators and educational measurement experts made necessary modifications and reached a consensus on the final Chinese version of the DSS.
Stage 2
During the pilot test, the Chinese version of the DSS was then given to 10 Chinese college students who were unrelated to this study. According to participants’ feedback, some items with high repeatability have caused wastefulness and irrationality. For instance, items 7, 9, and 11 which measure approval anxiety, have similar stems (i.e., “I am nervous about how people will respond to my posts and photos”; “I feel nervous after I share a post or a photo to see how others respond to it”; “I feel nervous about how others will respond when I post new updates on social media”). Considering the pilot test and students’ feedback, we found that some items with similar phrasing and conceptual overlap led to duplication and redundancy of items. The items that were removed are as follows: items 1, 9, 11, 12, 15, 18, and 22.
The Final Version
Once the translation and modification process was completed, the final version of the Chinese DSS retained only 17 of the original 24 items still covering the five factors: connection overload (items 2 through 6), approval anxiety (items 7, 8, and 10), online vigilance (items 13, 14, and 16), availability stress (items 17, 19, and 20), and FoMO (items 21, 23, and 24). Each item is rated on a five-point Likert scale.
Results
Factor Structure
The factor structure of the two models is compared in Table 1. Model 1 is the original DSS with 24 items and Model 2 is a short form of the DSS with 17 items. The fit indices of Model 1 were poor, with both CFI and TLI lower than 0.90 (RMSEA = 0.076, SRMR = 0.144, CFI = 0.780, TLI = 0.754). The model fit for Model 2 is sufficiently adequate: χ2/df = 3.63, p < .001, RMSEA = 0.06, SRMR = 0.046, CFI = 0.920, TLI = 0.900. χ2/df doesn’t meet the criterion of <3 due to the sample size. However, this was deemed nonetheless acceptable considering that the other indices had a good fitness. Figure 1 shows the factor loadings of Model 2, and the standardized loadings of all items were significant at p < .001. Also, the vast majority of the items had factor loadings above 0.60. The factor loading of the DSS ranges from 0.571 to 0.830. As a result, the five-factor structure of the DSS fits the Chinese sample well.
Fit Indices for DSS in Confirmatory Factor Analysis

Note. Model 1 = the original DSS with 24 items; Model 2 = the adaption version of DSS with 17 items;

Five-factor model.
Internal Consistency and Criterion-Related Validity
The internal consistency of the DSS and its five subscales was evaluated by Cronbach’s
According to Pearson’s correlation coefficient analyses, the Chinese version of the DSS demonstrated a good correlation with the SIAS-6/SPS-6. The DSS also correlated well with the PSS-10. The SIAS-6/SPS-6 (
Internal Consistency and Criterion-Related Validity.
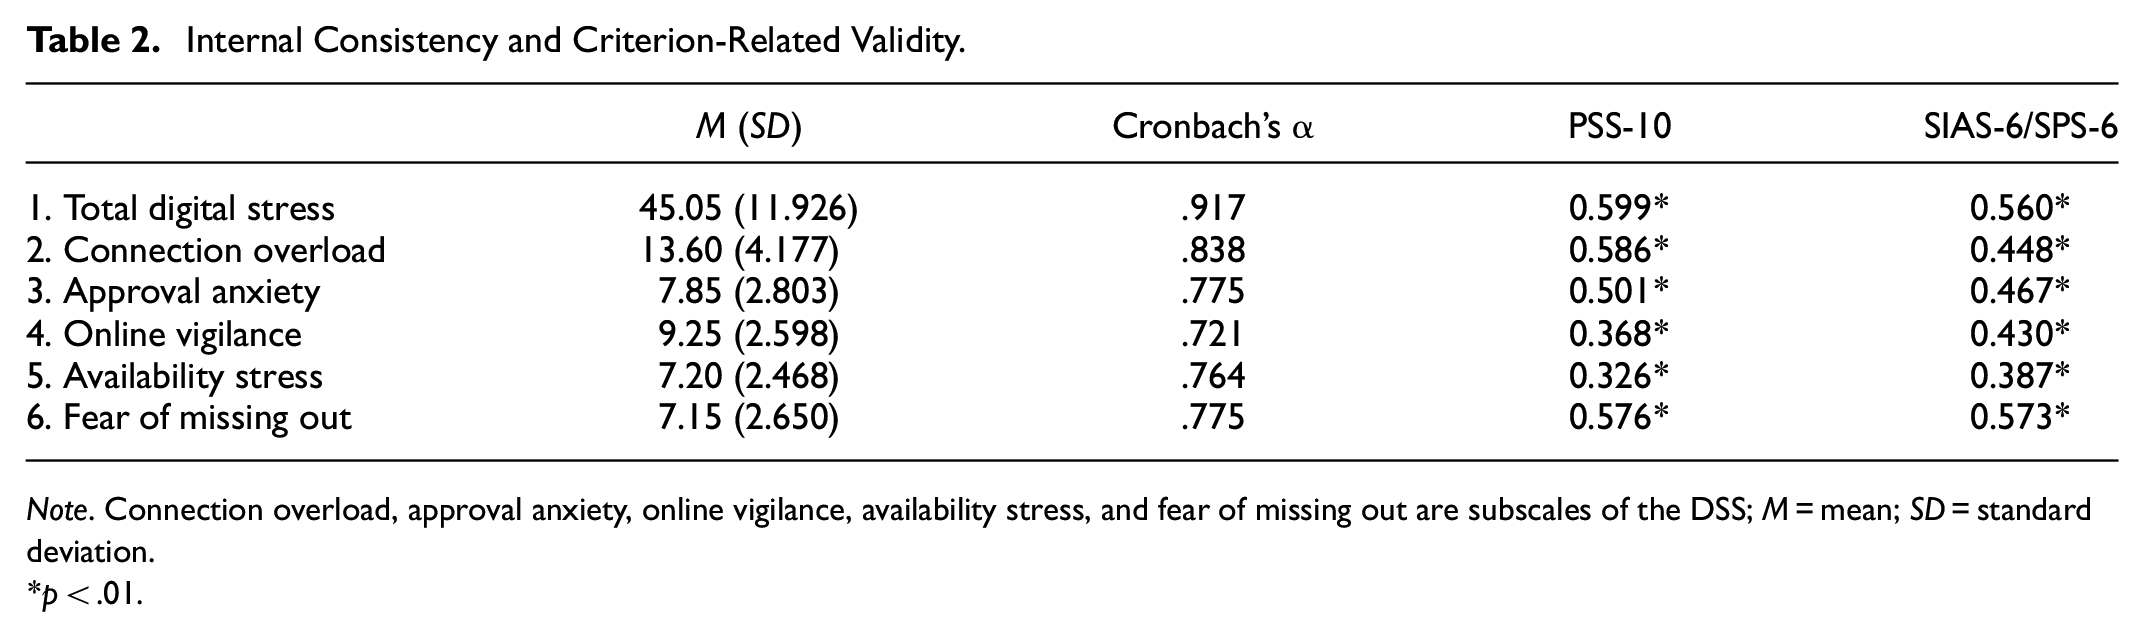
Note. Connection overload, approval anxiety, online vigilance, availability stress, and fear of missing out are subscales of the DSS; M = mean; SD = standard deviation.
p < .01.
Measurement Invariance
The results of the measurement invariance according to subjects’ gender are shown in Table 3. The configural invariance model (Model 1) fits the data well (χ2 = 552.886, df = 218, RMSEA = 0.065, CFI = 0.923, TLI = 0.904). After constraining the factor loading invariant in Model 2, the results change slightly from Model 1 (RMSEA = 0.001, CFI = 0.001, TLI = 0.004). The chi-square difference test also reveals that the result was not significant. Model 3 has restrictions with item intercepts invariance and factor loading invariance (χ2 = 631.202, df = 242, RMSEA = 0.067, CFI = 0.911, TLI = 0.900), and the fit indices change more than in Model 2 (RMSEA = 0.003, CFI = 0.011, TLI = 0.008). Our findings do not support the scalar invariance model since the CFI decreased in comparison to Model 2 to exceed 0.01, and the change in chi-square was also significant. The four-parameter levels of the equivalence test are nested within each other, with the model at the former level nested within the model at the latter level, and only if the equivalence at the former level holds can the equivalence test at the higher level continue (Byrne et al., 1989; Vandenberg & Lance, 2000). The following strict measurement invariance model could not be conducted since the scalar invariance model did not support it.
Measurement Invariance Tests by Gender.

Note.
p < .01.
We also assessed measurement invariance according to the participants’ region (Table 4). Similar to gender, the fit indices in Model 1 are high (
Measurement Invariance Tests by Region.

Note.
p < .01.
IRT Analyses
Item Parameters
The item parameters of the Chinese version of the DSS are presented in Table 5. There are five items designated as connection overload (CO1–CO5), and three items each for approval anxiety (AA1–AA3), online vigilance (OV1–OV3), availability stress (AS1–AS3), and fear of missing out (FoMO1–FoMO3). For all of these 17 items, the discrimination parameters
Item Parameters.

Note. a = discrimination parameters; b (b1–b4) = threshold parameters; connection overload (CO1–CO5); approval anxiety (AA1–AA3); online vigilance (OV1–OV3); availability stress (AS1–AS3); fear of missing out (FoMO1–FoMO3).
Item Characteristic Curves (ICC)
ICC was used to analyze the DSS item characteristics. The vertical axis shows the probability that the subjects answered correctly
Part of the ICCs are shown in Figure 2, and all of them can be found in the Appendix. For instance, Item 1 in the connection overload indicates that the item has five response levels ranging from 1 (“never”) to 5 (“always”). Curve 3 indicates that subjects with a latent

Part of the item characteristic curves (ICCs).
Test Information Curves and Standard Error Curves
The information function describes the estimated degree of each ability level. The information value of an item becomes bell-shaped with the level of the subject’s ability trait. As shown in Figure 3, the horizontal axis is the latent ability, the left vertical coordinate is the amount of information in the test, and the right vertical coordinate is the standard error. The dashed line in the graphs indicates the standard error curves, and the solid line indicates the test information curves. The test information curve of connection overload had the highest information with 6.38 at

Test information curves and standard error curves for all subscales.
Discussion
Digital stress is prevalent due to the regular use of social media in daily life, and many adolescents experience this stress regardless of gender, race, or ethnicity (Nick et al., 2022). Digital stress is an important indicator of the relationship between moderated social media use and mental health, and people will benefit from the assessment of digital stress. The purpose of this study was to examine the factor structure and psychometric properties of the Chinese version of the DSS in a Chinese sample by assessing the Chinese college students’ level of digital stress. With nearly a quarter of the original DSS items removed, our new brief DSS is still reliable and captures the core features of digital stress. Hence, the following discussion is centered on the hypotheses previously formulated in this study.
According to hypothesis 1 (H1), the five-factor model with 17items is shown to be robust, indicating that the DSS can be used to measure digital stress in the Chinese context. The CFA results demonstrate that the five-factor model of the DSS fits the data well in Chinese samples, and is consistent with the theoretical model of Hall et al. (2021). The index of CFI and TLI are both above 0.90 and the RMSEA is less than 0.80. These findings suggest that the DSS can be generalized to the Chinese population in order to assess digital stress.
Second, consistent with previous research hypotheses (H2), the Chinese version of the DSS shows satisfactory internal consistencies (
With regard to our third research hypothesis (H3), the measurement invariance tests for gender indicate that the factor structure (factor loading and item intercept) of the DSS is not invariant between males and females. Therefore, subjects of different genders might have biased results when using the DSS for digital stress testing. The effects of social media can be gender-conditional, and different kinds of social media activities are associated with well-being to different degrees (Svensson et al., 2022). Choi (2022) found that women tend to use social media for relationship maintenance and have more social comparison orientation. Females are more likely to use online social media communities than males (Ahn, 2011). Therefore, there is a slight difference between the results obtained using the DSS to measure digital stress levels in men and women, with women being more likely to be exposed to digital stress in the social media environment. Furthermore, the results of the study may be influenced by the male-to-female ratio of the sample. The number of female students in this study surpassed the number of male students by one-fifth. Finally, the factor structure and uniqueness for the DSS also hold for measurement equivalence across different regions, which means that the scale is equally effective for both urban and rural respondents.
Regarding the final research hypothesis of this study (H4), the results of the IRT analyses show that the Chinese version of the DSS has excellent discrimination parameters and threshold parameters. While the ICCs are generally good, a few items do require further adjustment. For example, two items for online vigilance appear to be flawed. The distinction between the scores in Item 1 (“I must have my phone with me to know what is going on”) is not evident, particularly with scores ranging from 0 to 1 (from “never” to “some of the time”). A similar issue occurs with Item 3 (“I feel socially unavailable when I do not have my phone”). Nevertheless, the test information curves show that the Chinese version of the DSS is a credible measure for the vast majority of its intended subjects.
Limitations and Future Direction
There are several limitations to the current study. First, although the study’s findings demonstrate that the subscales are reliable based on the CFA, some of the items will nonetheless need to be modified and enhanced by IRT. And our study does not provide specific suggestions for future item modifications. Second, the current study looked at only undergraduate and graduate students at Chinese universities. Although our sample was well distributed across all study years, it nonetheless comprised primarily freshmen and sophomores (69.9% of the total sample) which is not conducive to the generalization of our findings. Future research should evaluate the model structure and item functioning of the Chinese version of the DSS using other samples. Finally, future researchers can investigate the current status of digital stress levels among Chinese college students and study the relationship between college students’ digital stress levels and academic performance. All offline campus academic activities were suspended during the COVID-19 pandemic, and the virtual community in digital spaces became the only way to participate with others socially. Future research should provide recommendations to help students and instructors overcome the shortcomings of social media.
Conclusion
The current study focused on assessing the psychometric properties adequacy of the Chinese version of the DSS. The excellent fit indices and psychometric properties all prove that the Chinese version of the DSS has adequate reliability and validity in Chinese samples. The Criterion-Related validity also shows that the Chinese version of the DSS has a basic agreement with other indicators of stress. According to its measurement invariance, the Chinese version of the DSS has shown itself to be regionally invariant, but gender differences might influence the effect of the test. Nonetheless, the factor analysis and item function support the Chinese version of the DSS in Chinese college students. The Chinese version of the DSS can serve as a valid and reliable alternative to the original DSS for Chinese college students in nonclinical settings. Additional research would be necessary to determine if the findings generalize to a broader Chinese population. Furthermore, these psychometric investigations of the DSS will allow future research to investigate construct validity better.
Supplemental Material
sj-docx-1-sgo-10.1177_21582440241247406 – Supplemental material for Factor Structure and Psychometric Properties of the Digital Stress Scale in a Chinese College Sample
Supplemental material, sj-docx-1-sgo-10.1177_21582440241247406 for Factor Structure and Psychometric Properties of the Digital Stress Scale in a Chinese College Sample by Chunlei Gao, Mingqing Jian and Ailin Yuan in SAGE Open
Footnotes
Acknowledgements
The author would like to thank the students who kindly gave of their time when participating in this study.
Author’s Contribution
All authors contributed to the study conception and design. Material preparation was performed by Chunlei Gao and Ailin Yuan, data collection and analysis were performed by Chunlei Gao and Mingqing Jian. The first draft of the manuscript was written by Mingqing Jian and all authors commented on previous versions of the manuscript. All authors read and approved the final manuscript.
Declaration of Conflicting Interests
The author(s) declared no potential conflicts of interest with respect to the research, authorship, and/or publication of this article.
Funding
The author(s) disclosed receipt of the following financial support for the research, authorship, and/or publication of this article: This study was funded by the National Educational Examination Research Planning 2021 Annual Project (GJK2021025).
Ethical Approval
All procedures performed in studies involving human participants were in accordance with the ethical standards of the institutional and/or national research committee and with the 1964 Helsinki declaration and its later amendments or comparable ethical standards.
Supplemental Material
Supplemental material for this article is available online.
Data Availability Statement
The datasets generated during and/or analyzed during the current study are available from the corresponding author on reasonable request.
References
Supplementary Material
Please find the following supplemental material available below.
For Open Access articles published under a Creative Commons License, all supplemental material carries the same license as the article it is associated with.
For non-Open Access articles published, all supplemental material carries a non-exclusive license, and permission requests for re-use of supplemental material or any part of supplemental material shall be sent directly to the copyright owner as specified in the copyright notice associated with the article.