
Abstract
Using a high-dimensional time-varying parameter vector autoregression framework, we propose a volatility spillover network to analyze risk contagion direction, path, and intensity under supply-demand relationships when important events break out in the real estate market. We characterize daily return volatility spillovers across firms from January 2010 to April 2022 and find a high correlation among these firms because the real linkage based on industrial chain structure strengthened. Meanwhile, the outbreak of essential events in the real estate market corresponds to several peak values of return volatility. The empirical results show that excessive correlation induces risk contagion across the network, and spillover effects are significant under extreme market conditions, manifesting as cross-industry contagion and intersectoral diffusion. The volatility spillover effects within real estate firms are higher than spillover effects across markets. In addition, the industrial chain structure better explains the mechanism of cross-industry risk contagion, firms located upstream of the real estate industry chain are risk receivers, and those located downstream are risk spillovers. Real estate firms mainly spread risks to financial institutions and firms that provide production goods. Our findings are of constructive significance to the related policies by regulatory authorities and provide multi-angle empirical evidence support for the risk supervision theory of “too connected to fail.”
Keywords
Introduction
Preventing major financial risks is the core task and eternal theme of modern financial risk management. Among all kinds of hidden financial risks, risks brought by the real estate market are particularly prominent. From the perspective of international experiences, the global financial crisis caused by the subprime mortgage crisis of 2008 is a severe consequence caused by the sharp decline of real estate prices in the United States. The bursting of the Japanese real estate market bubble in the late 20th century caused financial risks and led to a continuous economic downturn in Japan. However, after years of rising housing prices in China, financial institutions and the relevant real economy have invested a large number of funds in real estate in order to obtain high returns, which has led to the emergence of bubbles in China’s real estate market. For example, real estate fixed asset investment (FAI) has been consistently high, accounting for around 27% of the economy’s total FAI in 2021, housing price fluctuations affects the liquidity state through the redistribution of wealth, thus causing changes in the distribution of bank loans and the conduction of systemic risks. With soaring housing prices, real estate developers tend to over-expand their borrowing scale to elevate production and thus obtain more profits, which may cause a housing price bubble. Once it declines, these developers may encounter liquidity risks and long-term solvency problems, which not only directly affects its purchase and investment behavior, but also indirectly affects the related firms and incur massive losses through asset-liability channel and input-output relationship in the industrial chain, transmitting risk to various sectors over the industrial chain. In fact, intersectoral linkage is a crucial component of systemic risk. The systemic risk arises for the consequence of a high degree of interconnectedness across the real estate market (Martínez-Jaramillo et al., 2010; Sun et al., 2019), and an extreme financial default of a single firm may cause other related firms’ failure, with the supply-demand chain reaction for holding common property or assets leading to a collapse of the entire financial system. Under this circumstance, the breakout will increase the risk of debt default for upstream suppliers, and shrink supply to downstream customers, which leads to a downstream product backlog. In September 2021, China’s Evergrande, one of Chinese famous real estate developers, suffered a debt crisis, and real estate risks transmitted and spread through the industrial chain, increasing the risk of industrial chain interruption. How to avoid the impact of a particular node being transmitted to the upstream and downstream enterprises and causing systemic risks has become a significant challenge faced by the current regulatory authorities. Based on this, the question this paper attempts to answer by investigating the volatility connectivity of risk in China’s real estate market is: What is the correlation between real estate and relevant industrial chain companies? Under this correlation, what is the risk spillover effect of companies in the industrial chain? To what extent does it affect the companies involved? What is the contagion mechanism of cross-industry contagion of the real estate risks? To answer these questions, this paper takes the real estate market as a breakthrough point, constructs a high-dimensional time-varying volatility spillover network for empirical analysis, and analyzes the risk spillover mechanism of real estate and the related companies in the industrial chain. Then, this paper focuses on risk contagion direction, transmission path, and contagion intensity under supply-demand relationships and proposes a contagion mechanism based on industrial chain structure. Finally, this paper provides some suggestions for China’s government to prevent and defuse real estate risks.
The rest of this paper is organized as follows. Section “Literature Review” outlines the related literature. In Section “Methodology,” we introduce input-output table to define the sectors and firms which show interconnection linkages with the real estate sector, and measure network connectedness based on the high-dimensional TVP-VAR model. In Section “Empirical Data and Results,” we examine the contagion direction, path and intensity of risk in the volatility spillover network. We further analyze the real estate risk contagion mechanism from the new perspective of industrial linkage, and we conclude and give suggestions in Section “Conclusion.”
Literature Review
The discussion on the spillover effect of real estate risk focuses on the risk contagion between the real estate market and the financial system represented by the risk contagion relationship between the real estate market and commercial banks (Deng et al., 2019) or the real estate market can be included in the generalized financial system to analyze the risk contagion relationship between it and multiple financial sectors (Morelli & Vioto, 2020). For example, Xu et al. (2021) found that the risk spillover channel from the real estate industry to the financial sector has gradually changed from the traditional single banking industry to the accumulation and superposition of multiple risks, such as banking, securities, and trust industries. It can be found that the above studies all incorporate the real estate market into the financial system to analyze the risk contagion relationship, focusing on the characteristics of risk contagion in the financial system without considering the cross-industry contagion relationship of real estate risks to the real economy. However, financial market volatility is closely related to the performance of the real economy. Especially under the circumstance of industrial transformation and upgrading, cross-industry risk contagion has become a significant hidden danger affecting financial stability. In addition, the severe shocks caused by systemic risk events in the financial market also reflect that the study on financial risk contagion should not be limited within the financial market sector, but should also incorporate the real economy into the analysis framework to study its position and role in the chain of risk contagion. In recent years, some scholars have begun to pay attention to the cross-industry risk contagion between the financial system and the real economy. According to Giannetti and Saidi (2019), the decline in the value of mortgage assets would further exacerbate the financial sector’s vulnerability and form a path for the transmission of the downside risk of the real economy to the financial sector. Some scholars also believe that the industrial chain may become an essential mechanism for risk cross-industry contagion (Nguyen et al., 2020; Yang et al., 2023). For example, Acemoglu et al. (2017) believed that heterogeneous risks in the industrial network could be transmitted to its trading partners along the input-output chain. Ahern and Harford (2014) found that trade networks helped to explain the formation and transmission of M&A waves, and vertical mergers among companies would lead to risk endogenization in the upstream and downstream sectors of the industrial chain. The literature above mainly uses the industrial chain to explain the contagion of operational risks among companies (Grant & Yung, 2017). However, it needs more studies on the contagion mechanism of systemic financial risks. As a pillar industry of the national economy, the real estate industry has a large financing scale and a long industrial chain and forms extensive and close industrial associations with other real economic industries through supply-demand relationships (Xu et al., 2021). Once the real estate industry falls into crisis, the risk will likely be transmitted to the macro economy along the industrial chain, leading to systemic risk. Therefore, this paper combines the production network with the risk contagion network to explain the mechanism of real estate risk contagion to the real economy along the industrial chain structure from the new perspective of industrial governance.
Recent theoretical works have emphasized network connectedness in financial contexts (Barunik & Krehlik, 2018; Kou et al., 2019). There are two types of empirical data, one uses real bank balance sheet data to build a direct correlation network (Anderson et al., 2019) or an indirect correlation network (Shi et al., 2021). Those models are based on specific forms of association, such as direct inter-bank lending or indirect association of holding common assets, which can only capture a small part of risk with low time-frequency dynamics. In comparison, using financial market data, such as stock returns (So et al., 2020; Yang et al., 2018), return volatility (BenSaida et al., 2018; Sharif et al., 2020), tail risk dependence indicators (Abuzayed et al., 2021; Guo et al., 2021) and other high-frequency financial data can overcome the above shortcomings, making it possible for measuring risk contagion channels in both direct and indirect associations, and exploring risk contagion across sectors and markets. In order to make the related information contained in the network completely, there are more improving methods of network construction has been conducted. Diebold and Yilmaz (2014) proposed a generalized variance decomposition method based on a VAR model to construct a directed weighted association network between entities. With the expansion of the research scope, more scholars propose complex network methods for constructing high dimension model. For example, Demirer et al. (2018) combined the LASSO estimation method with the VAR model and uses generalized variance decomposition to construct a high-dimensional correlation network between multinational banks. Therefore, based on the latest research results, this paper uses the complex network defined by generalized variance decomposition based on the TVP-VAR model, combined with the Kalman filter and Elastic Net to capture the “high-dimensional” and “time-varying” characteristics of risk spillover, describing the process of real estate risk contagion. Our methodology solves the problems of sample omission in the window period and unstable estimation results of high-dimensional data in the “rolling window method.”
Compared with the existing research results, this paper is innovative in both theory and method. Firstly, this paper mainly studies the characteristics of risk contagion between the financial sector and the real economy. It attaches importance to the real economy’s critical role in transmitting systemic risks. Most studies on the triggering mechanism of systemic financial risks focus on financial institutions (Brunetti et al., 2019; Sun et al., 2019) and financial markets (Collet & Lelpo, 2018). Few studies have studied the characteristics of risk contagion between the financial system and the real economy. It ignores the critical role played by the real economy in transmitting systemic risks (Uluceviz & Yilmaz, 2021). Inter-industry risk contagion has become a significant hidden danger affecting financial stability in industrial transformation and upgrading. In addition, the cross-market and cross-country shocks caused by financial market risk events in recent years also reflect that the research on financial risk contagion should not be limited to the financial sector but should incorporate the real economy into the analysis framework (Yang et al., 2023). Therefore, it is essential to scientifically judge the position and role of different industries and enterprises in the risk contagion chain.
Secondly, this paper examines the contagion mechanism of real estate risk between industries from the perspective of the industrial chain. At present, there is a lack of literature examining the risk spillover mechanism of real estate risk between industries from the perspective of the industrial chain. Previous studies have shown that the industry chain can explain the business performance correlation between industries. For example, Barrot and Sauvagnat (2016) explored whether the firm-level shocks would spread in the production network through the supply chain and found that when exogenous natural disasters hit the firm, the interruption of input of a specific firm would lead to the output loss of the whole industry. Financial market volatility is inseparable from the performance of the real economy, so the risk of financial market volatility is likely transmitted from the trade network to the real economy when an exogenous shock is made (Acemoglu et al., 2012). Therefore, it is essential for this paper to examine the risk contagion mechanism of real estate risk between industries from the new perspective of “industrial governance” to explore the early warning mechanism of industrial risk.
Thirdly, this paper studies the risk spillover effect of real estate risk shocks on the financial sector and the real economy from firm-level. The existing literature explains that the risk shock caused by the real estate industry is the main external shock to financial institutions and even the real economy (Deng et al., 2019; Koetter & Poghosyan, 2010). However, the spillover impact of the real estate market on financial institutions is mainly considered from the macro or overall industry, and there is a lack of research from the perspective of micro real estate enterprises. It is of great practical significance to analyze the real estate enterprises and real enterprises as network nodes and reveal the risk spillover effect of each real estate enterprise on the enterprises in the industrial chain to resolve this round of real estate risks accurately.
Fourthly, this paper combines the high-dimensional TVP-VAR model with the network topology to capture the “high-dimensional” and “time-varying” characteristics in the global dynamic complex network simultaneously, improving the methodology of the current relevant literature. Although some scholars use the more informative stock price to study the risk spillover between institutions from the perspective of complex networks (Abuzayed et al., 2021). However, due to the limitation of research methods, the constructed network is unchanged during the whole sample period, while the network structure among institutions is constantly changing due to the introduction of various policies or changes in the economic situation. Diebold and Yilmaz (2014) use rolling window estimation to solve this problem, but the results of rolling window estimation depend on the selected window width and the volatility spillover calculated. As a result, it will lose much valuable information. Therefore, it cannot reflect the dynamic characteristics of the entire network (Antonakakis et al., 2017). In this paper, the high-dimensional time-varying vector autoregressive model is used to describe the “high-dimensional” and “time-varying” characteristics of risk and the complex network model is constructed by calculating the generalized variance decomposition to obtain the volatility spillover intensity of the real estate industry and related industries. Our methodology solves the problems of sample omission in the window period and unstable estimation results of high-dimensional data in the “rolling window method.”
Methodology
High-Dimensional TVP-VAR Model
At present, rolling window method and time-varying parameter method are mainly used to describe the dynamic characteristics of financial risks. In view of the fact that this paper studies the risk spillover effects of real estate and other sectors from firm level, involving a large number of sample firms, so a high-dimensional time-varying parameter model is needed.
Base Model
According to Primiceri (2005), a vector autoregressive model (VAR) with time-varying coefficients, variances, and covariances is:


and

Where
Time Varying Parameter Estimation
The existing literature mostly uses the Markov Chain Monte Carlo method (MCMC) to estimate the Kalman filter to obtain the consistent estimation of time-varying parameters. Koop and Korobilis (2013) believe that this method relies on the prior distribution of parameters, and estimation efficiency will be greatly reduced if model dimension is too high. They propose a Kalman filter algorithm with a forgetting factor (also known as discount factors). The key assumption of the Kalman filter is that the coefficients must satisfy a normal distribution:

where formulae for

where

This is the only place where

there is no longer a need to estimate or simulate
Similarly, the time-varying variance-covariance of

Where
Referring to Koop and Korobilis (2013), this paper sets the value of

Elastic net parameter optimization incorporates both LASSO and ridge regularization. Both α and ζ are hyperparameters from cross-validation.
Generalized Impulse Response Functions
We then use these estimates to calculate generalized impulse response functions (GIRFs) between every pair of firms:

Once we have the estimated VAR coefficients and residuals, it is straightforward to calculate the GIRFs between all of the firms. The
Volatility Spillover Network Model
Assuming that the network topology W=

The net pairwise volatility spillover between firm j and firm i is simply the difference between the gross volatility shocks transmitted from firm j to firm i and those transmitted from j to i. If
Industrial Chain Structure
Based on the input-output relationship, this paper calculates the backward and forward correlation of the real estate industry to reflect the interdependence of all industries in the chain.
Backward Linkage Effect
The backward linkage effect indicates that an industry’s development requires consuming other industries’ products or services, namely the demand-pull effect. The backward linkage effect is measured by the complete consumption coefficient, which refers to the total amount of products or services directly and indirectly consumed by other industries for each unit of final product provided by an industry J. The complete consumption coefficient captures the relative importance of upstream industry I, and the larger the coefficient is, the more dependent the industry J is on upstream industry I. The formula of the complete consumption coefficient is as follows:

where

where
Forward Linkage Effect
The forward linkage effect refers to one industry’s influence on other industries that use its products or services as inputs, namely the supply-push effect. The forward linkage effect is measured by the complete distribution coefficient, which refers to the total amounts of products or services directly and indirectly provided to other industries in the industry I’s production process. The complete distribution coefficient captures the relative importance of downstream industry J, and the larger the coefficient is, the more dependent industry I is on downstream industry J. The formula of the complete distribution coefficient is as follows:

where

Where
Empirical Data and Results
Data Set
Real estate market has demand-pulling effects on upstream industries and supply-driving effects on downstream industries. This paper uses input-output table data of the National Bureau of Statistics in 2018 to calculate both the complete consumption coefficient and complete distribution coefficient for selecting six most related industries with getting high scores in these two coefficients. According to Yang et al. (2018), we then select 50 listed companies with a listing date earlier than January 1, 2010 taking the highest proportion of market value. The selected sample firms are shown in Table 1. The daily data of listed companies comes from the Wind database. The research sample range is from January 1, 2010 to April 18, 2022, with a total of 149,200 samples.
Details of Real Estate and Its Related Companies.

According to Fang et al. (2019), we calculate the logarithmic returns for all financial data, and estimate the return volatility with a univariate GARCH (1,1) framework.
Results of Return Volatility
Figure 1 plots the return volatility of sample firms since 2010. We find that the volatility of all related firms shows resonance in general. The reasons can be explained from two aspects: one is that the risk volatility spillovers reflect the real business transactions. For firms with direct business transactions, risk spreads along the industrial chain, and for firms with competitive or complementary relationship, risk transmits through similar risk exposure. The other one is that risks may also spread through the information mechanism. The severe psychological panic and loss of confidence from investors during the crisis have intensified the “herd effect” and information asymmetry in the market. Once a crucial firm (such as China Evergrande) in the real estate market trapped and has a capital chain rapture, it may cause investors to sell assets of related firms irrationally, which finally triggers risk contagion in the network.

Stock return volatility of 50 listed companies: from 2010 to 2022.
Particularly, several peaks of return volatility in Figure 1 are corresponding to specific major external shocks during the sample periods. For example, on April 14th, 2010, State Council issued the “Notice on Resolutely Curbing the Excessive Rising of Housing Prices in Some Cities,” namely new “Ten Articles of the State,” Carrying out pilot works on housing purchase restriction orders. The purchase restriction policy directly affected the supply-demand relationships in the real estate market, and indirectly affected innovation activities of the real economy through the industrial chain. It can be seen that there are huge potential risks behind the extreme prosperity of the stock market in the first half of 2015, which shows great return volatility at that time. The reason for this phenomenon is that excessive market liquidity risks lead to severe exposure of most firms in the industrial chain, and the exposure could be extremely widespread when distress events occur. Therefore, a great return volatility may be induced when potential risk accumulates and the “stock market crash” suddenly broke out. Another peak occurs during the outbreak of the COVID-19 epidemic in 2020. As a typical exogenous negative shock, public health emergencies caused huge volatility to the financial market. Noted that the third peak of return volatility occurred when China Evergrande’s debt default event broke out. In September 2021, two subsidiaries of China Evergrande Group failed to fulfill their guarantees for third-party wealth management products on schedule. By December 2021, China Evergrande announced that it could not fulfill its 260-million-yuan overseas debt guarantee obligations, which triggered the maturity of overseas debts and led to overseas debt defaults. Thus, its stock price plunged nearly 20% and related firms’ stock prices were plunged as well. Our empirical finding is consistent with the idea that major exogenous shocks increase the connectedness of financial networks (Chen et al., 2021; Yang et al., 2020), which proves that a dynamic volatility spillover network in real estate industrial chain has a reasonable and practical significance.
Risk Transmission Path of Volatility Spillover Network
For further analysis of the mechanism and the intensity of risk contagion in volatility spillover network, comparing the complex linkage structures at different times, this paper focuses on the dynamic evolution trend of net pairwise volatility spillovers to make a visual analysis of the connectedness network (see Figure 2). A complex network is an interdependent network composed of interrelated entities, where entities act as complex networks. The connection between different nodes is used as the edge of the complex network, so as to effectively describe the complex association network.

Net pairwise volatility spillover networks in specific times. (a-d) show the directional connectedness among the pairs of 50 firms on April 30, 2010, September 23, 2015, August 27, 2020, and September 17, 2021, respectively. Each node represents a firm and the edges connecting them represent the risk spillover between them. The node size indicates the intensity of the spillover effect in the network.
Overall, the network structure changes dynamically. In 2010, the net pairwise spillover happens in few firms and most firms in the network are risk receivers, mainly took the responsibility of absorbing risk. The real estate’s net pairwise volatility spillovers increase substantially in 2015, 2020, and 2021, with a more complex network structure in a dynamic evolution trend. Besides, it shows that more firms in real estate industrial chain involved to transmit risk and the spillover effects of those firms are relatively average. This dynamic evolution trend of transforming from aggregation to decentralization confirms that real estate related firms under close supply-demand relationships have stronger correlation during the important time of the real estate market.
On April 30, 2010, the announcement of the housing price “purchase restriction order” not only controlled the soaring of housing prices, but also influenced the relationship between supply and demand in the real estate market, curbed its speculation and excessive investment, and finally reduced its profits. The “purchase restriction order” of housing price means that the one purchasing family can only purchase one new commercial house in the same city. The first city to issue this purchase restriction order was Beijing. Then Chengdu, Shanghai, Tianjin, and other cities followed issued housing purchase restriction policies, such as the “State Ten” regulation. China Overseas Land (4) and Longfor Group (6) have obvious risk spillover effects during this time. The spillover effects of Yangtze Power (10), ENN Natural Gas (13), China Guodian (15), and Datang International Power (17) play in the diffusion of real estate risk because those firms are the upstream firms offering electricity gas for the real estate market. Also, Ping An (33) becomes the one with the most obvious risk spillover effect among all financial institutions during this period.
By the end of 2015, the year-on-year price index of newly housing prices in 70 large and medium-sized cities experienced negative growth for the first time ever since 2010. Vanke (1) becomes the one with the most obvious risk spillover effect in the network at this time. China Evergrande (3), China Resources Land (5), China Fortune Land (7), and Gemdale (9) also show as risk contagion nodes in the network. In August 2020, the Ministry of Housing and Urban-Rural Development jointly issued the “Three Red Lines” policy for capital monitoring and financing management of crucial real estate firms. The “three red lines” for real estate are a vital policy to restrict the financing of real estate developers jointly issued by the central bank and the Ministry of Housing and Urban-Rural Development in August 2020. The “three red lines” represent three bottom lines for real estate developers, namely, the asset-liability ratio should not exceed 70% after excluding advance payments, the net debt ratio should not exceed 100%, and the cash-to-debt ratio should not be less than one firms. If all real estate firms exceed these three bottom lines, they will be classified as red firms, and the state stipulates that such real estate firms are not allowed to add interest-bearing debt; If it exceeds the two bottom line standards, it is classified as orange, and the annual growth rate of interest-bearing liabilities shall not exceed 5%; If it exceeds a bottom line standard, it will be classified to yellow firms, and the annual growth rate of interest-bearing liabilities will be relaxed to 10%; Real estate firms that exceed the bottom line are classified as green firms, and the annual growth rate of interest-bearing liabilities is relaxed to 15%. Yu Garden (26), Shanxi Taigang Stainless Steel (43), and Chins Commodities City (24) play in the diffusion of real estate risk during this period. Under the constraints of the “three red lines,” external financing channels for real estate had been restricted, and the strength and scale of credit expansion had been tightened, which prompted real estate companies to return to rational development from high-debt expansion. As mortgage interest rates increased, the sales of commercial housing had slowed down, the short in receivables as well. The cash flow gap of real estate firms will not only affect the purchase and investment behavior of real estate firms, but reduce the driving effect on downstream retailing and business service industries, also affect the progress of real estate construction and further reduce the demand of steel in real estate construction. In September 2021, China Evergrande debt default risk spread and most firms in the industrial chain had been affected to different degrees. At this time, the largest size node belongs to China Evergrande (3) with the most significant spillover effect in the network, which means that the risks caused by the rupture of the capital chain of China Evergrande rapidly spread to the upstream and downstream under supply-demand relationships, and regulatory authorities should pay close attention to the potential rise in systemic risks caused by this shock. So, it can be found that the enhancement of firms’ connectedness is a crucial origin of systemic financial risks.
Considering the transmission paths of risk in the network, we find contagion channels are diverse. On April 30, 2010, China Overseas Land (4) ranks first and seven firms belonging to retailing and business services industries become the main risk absorbing destinations, which indicates that firms in the downstream industries at this time mainly undertake the function of risk absorption. The real estate risk weakens the driving effect on its downstream industries, resulting in downstream firms facing oversupply and inventory backlog problems. Affected by the “stock market crash” in 2015, stock returns of real estate related companies plummeted. The return volatility in the financial market shocked the real economy through credit-debt channels and supply-demand relationships. In September 2021, we find the China Evergrande’s debt default risk transmitted to 23 firms in the network, mainly are electricity and gas companies, financial institutions, real estate’s companies, and iron and steel companies. We prove that real estate risks mainly spread to upstream supply industries that provide production materials and financial institutions that provide financial support, while service industries such as retailing and business services which derived from the development needs of the real estate industry are less affected by real estate risks. This is because the relationship between real estate’s companies and supply companies is much closer than demand companies, so that the driving effect of the real estate market on upstream services is greater than its pulling effect on downstream services. To be specific, the correlation between real estate and banks is the highest among the network. Not only the funds of real estate firms mainly come from bank credit, but the financial support of steel, construction, and other firms who have strong correlations with real estate firms also come from banks, thus the credit funds invested by the banking system in the real estate market have increased exponentially (Si et al., 2019), which leads to the financialization and foaming tendency of the real estate market. Once the credit crisis affects housing price, related firms in the network are unable to repay the bank loans because of a broken cash flow, thus the insolvency causes the bank crisis and the bankruptcy of the firms in the network.
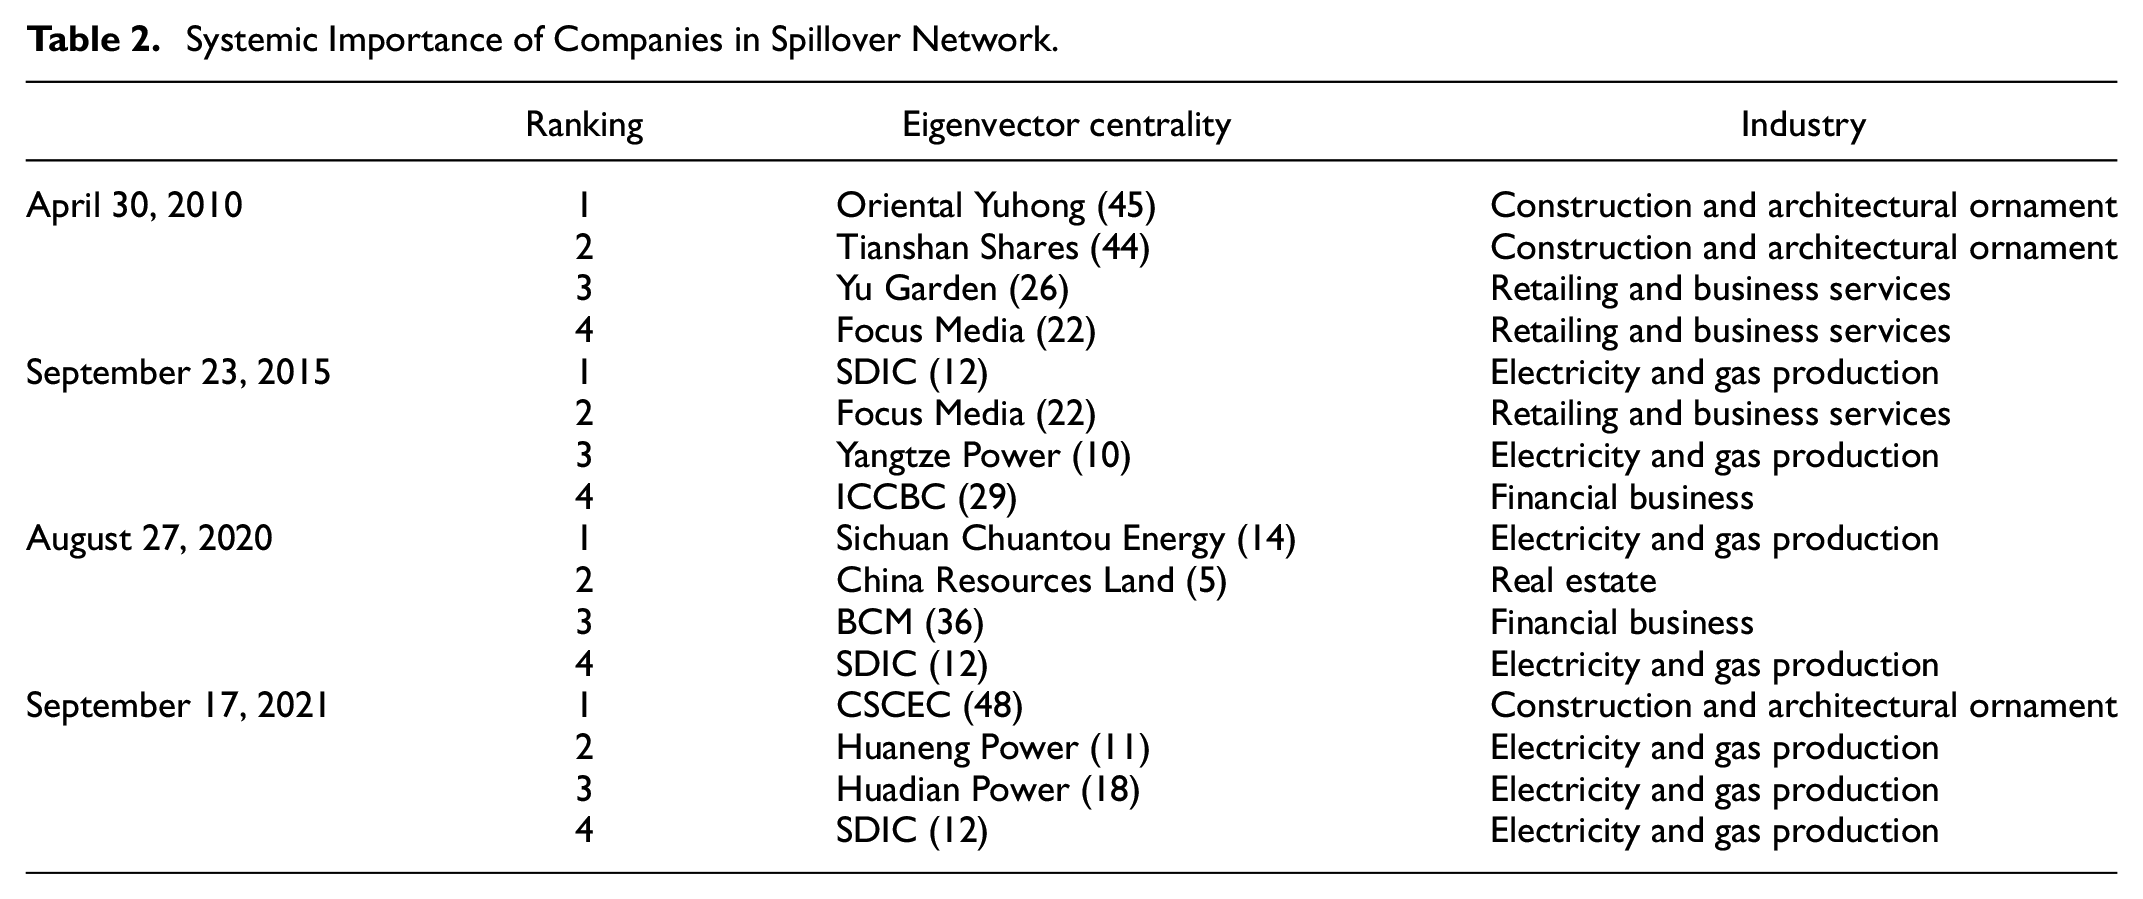
Ranking of Systemic Importance in Spillover Network
The eigenvector centrality (EVC) identifies the systemic importance of firms in the network by assigning relative scores to firms based on how connected they are to the rest of the network. We find the most relevant spillover network nodes based on the eigenvector, which measures the importance of the sum of direct (single-period) and indirect (multi-period) risk impacts of nodal firms in the volatility spillover network. In addition, we tabulate eigenvector centrality over four time periods and the results in Table 2 show that on April 30, 2010, the east Oriental Yuhong (45), Tianshan Shares (44), Yu Garden (26), and Focus Media (22) stand out and play important roles in the network. These firms may not have the most significant net risk spillover effects, but do have the strongest indirect association formed through multi-step links. On August 27, 2020, Sichuan Chuantou Energy (14), China Resources Land (5), BCM (36), and SDIC (12) become important nodes, which means that upstream supply companies that provide production materials, financial institutions that provide financial support, and real estate companies occupy important positions in the net risk spillover network, so focusing on the use of funds by these companies is conducive to controlling the spread of systemic financial risks.
Systemic Importance of Companies in Spillover Network.
Analysis of Risk Contagion Intensity
In addition, we investigate risk contagion intensity of real estate firms (see table 3). During the “China Evergrande debt default” crisis period, the interconnection among firms within real estate industry is the most significant, accounting for 35.82%, real estate market’s risk influence on financial institutions accounts for 15.50%, and the proportion for construction and architectural ornament companies is up to14.62%. The proportion of retailing and business service companies is 13.25%, the impact on iron and steel companies is 10.80%, and the impact on electricity and gas production companies’ risks is 10.01%. From the perspective of risk contagion intensity within real estate industry, the risk spillover effect between Vanke (1), Poly Development (8), and OCT (49) companies is significant, which can clearly perceive a risk aggregation phenomenon in the network. From the perspective of inter-market spillover effects, financial institutions become the main risk absorbers of external risk spillovers in the real estate industry. The reason is that many products in the financial market are related to real estate, and there is a strong symbiosis between the two markets. On the one hand, real estate is the most important collateral in China’s financial market. On the other hand, real estate loans are the main component of resident loans. There are extensive claims or debts between financial institutions and real estate companies and residents. Besides, a large amount of off-balance sheet funds also entered the real estate market. All these ties strengthen the relationships between real estate market and financial institutions, which leads to the negative financial externalities of the real estate market if real estate firms trapped, risks will quickly spread to various financial institutions in the network through asset-liability correlation and market expectation reversal, inducing systemic financial risks in the end.
Risk Intensity of Real Estate Industry During China Evergrande Defaults.

Analysis on the Mechanism of Industry Chain Structure on Real Estate Risk Contagion
This paper studies the mechanism of industrial chain structure on real estate risk contagion, the regression equation is defined as:
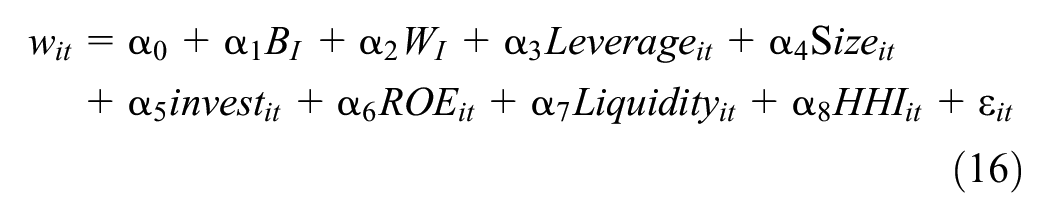
where
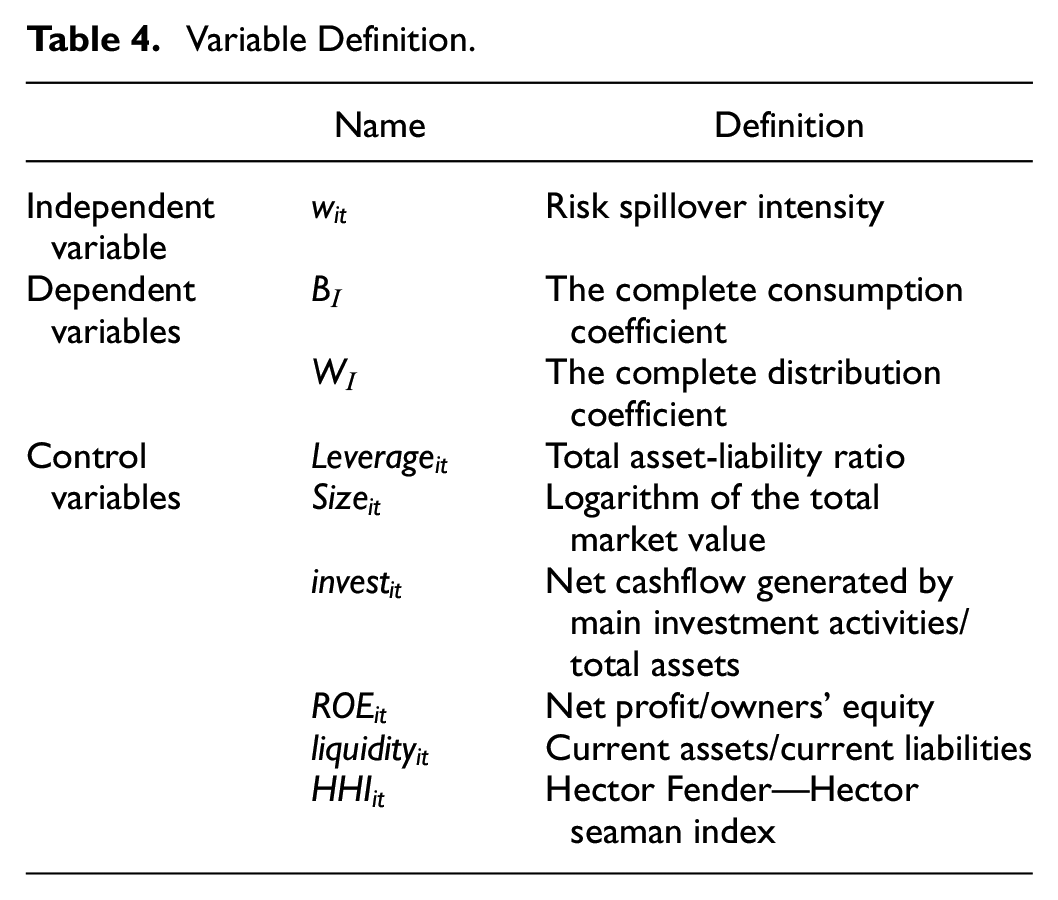
In addition, referring to Chiu et al. (2015) and Yang et al. (2023), this paper also controls companies and industries variables, including leverage (
Variable Definition.
Descriptive Statistics.

Table 6 reports the regression results.
The Mechanism of Industrial Chain Structure on Real Estate Risk Contagion.

***, **, * denote statistical significance at the 1%, 5% and 10% levels, respectively.
As for firms’ control variables,
This paper also uses the Probit model for the robustness test. The dependent variable is the risk spillover intensity of firm i, determined by whether it is above the sample median; samples above the median are assigned a value of 1, and samples equal to or less than the median are assigned a value of 0. The results shown in Table 5 are robust and consistent with the base model results, further indicating that the industrial chain structure can explain the mechanism of cross-industry contagion in real estate, with upstream firms acting as risk absorption and downstream firms acting as risk diffusion.
Conclusion
Using network perspectives in economic contents, this paper deeply analyzes the risk spillover network based on real estate firms and its related firms in industrial chain structure, and studies the spillover effect in the network. Our empirical results suggest that: (1) Real estate inter-firm network provides essential information on how firms are connected with one another and how these linkages have changed over time. There is a high correlation among firms with close relationships of industrial chain, and there is a significant risk spillover effect in the network, which means the prevention of real estate risks should pay attention to the firms related to the industrial chain under supply-demand relationships, not be limited to the real estate firms and financial institutions. (2) Excessive correlation is a crucial origin of system-wide risk. (3) From the direction of risk spillovers, real estate risk spillover networks show a dynamic evolution trend in different periods, more connected firms become more fragile through higher exposure to direct contagion from a distressed neighbor, vulnerability to system-wide shocks, and network crisis reinforced contagion. (4) From the perspective of risk transmission paths, the risk from real estate firms mainly spread to financial institutions that provide financial support, electricity and gas production companies that provide production materials, and construction and architectural ornament companies that provide building materials, which shows the upstream firms dominate the risk absorption. (5) From the perspective of risk contagion intensity, the interconnection among real estate firms is the most significant, and the risk spillover effect between Vanke, Poly, and OCT is the most significant, reflecting a risk aggregation in the real estate market. Secondly, the net risk spillover effect of real estate firms on financial institutions is most obvious in the inter-market spillovers, and financial institutions mainly undertake the function of risk absorption. (6) Industrial chain structure is an essential channel for cross-industry risk contagion in the real estate market. Firms located upstream of the real estate industry chain are risk receivers, and those located downstream are risk spillovers, which confirms the reverse transmission of real estate risks along the industrial chain.
This paper also has a limitation. In order to capture the “high-dimensional” and “time-varying” properties of the dynamic complex network and to characterize the risk contagion of the Chinese real estate market, we integrate the Kalman filter and Elastic Net approaches. The purpose of the methodology is to lose as little actual information as possible to ensure the consistency of the estimation results. Unfortunately, there are still certain restrictions in this paper’s sample selection. For an empirical analysis, we choose 50 representative companies related to the real estate industry. This article has enhanced and increased the research sample when compared to earlier research on the VAR low-dimensional model, although it still has limitations. To accomplish global dynamic analysis, more dimension reduction techniques must to be taken into consideration in further research.
Based on the above conclusions, this paper gives the following policy suggestions to prevent risk spillover from the real estate industry to other related industries. Firstly, the real economy and the financial sector should be integrated into the monitoring scope of risk early warning to prevent the cross-industry and cross-sector contagion of real estate risks. This paper finds that real estate risks will spread between upstream and downstream industries along the industrial chain network, and the risk contagion between industries shows an apparent “cascade effect,” that is, the impact of the real estate sector can quickly spread and cause systemic risks. In the context of China’s industrial chain undergoing structural adjustment, transformation, and upgrading, it is necessary not only to implement more accurate and strict monitoring of the real estate sector but also to monitor the capital exchange between the financial sector related to the real estate sector and the real economy sector, improve the financial early warning mechanism, and adhere to the bottom line of no systemic risk. Secondly, for risk events in different periods, the critical risk nodes in the risk spillover network should be accurately identified by capturing the changes in the systemic importance of each industry segment. The real estate risk spillover network shows a dynamic change trend in different periods, so finding vital nodes in the network and preventing cross-industry contagion of real estate risks is necessary. Thirdly, the contagion path of real estate risk should be identified in combination with the structure of the real estate industry chain. This paper shows that the real estate industry’s risk diffusion represents the risk spillover from the downstream to the upstream sectors. In the real estate industry network, primary industries such as electricity, gas, and water supply and the financial sector bear the vital function of risk absorption. In contrast, service industries such as business services take the primary role of risk diffusion. At present, we should pay attention to the prudential supervision of vital areas such as real estate finance, the electric, gas, and water supply industry that provides the production for real estate, and strengthen the risk monitoring of the downstream sector of real estate. In addition, in the case of real estate risk events, we should stabilize market expectations promptly, increase credit support in its upstream and downstream sectors, implement measures taken by the financial system to support the real economy, and prevent systemic risks that may be caused by industrial chain contagion.
Footnotes
Acknowledgements
We sincerely thank editors and anonymous reviewers for their constructive comments and discussions that helped to improve this paper.
Author Note
We would like to declare that the work described was original research that has not been published previously, and not under consideration for publication elsewhere, in whole or in part. All the authors listed have approved the manuscript that is enclosed.
Declaration of Conflicting Interests
The author(s) declared no potential conflicts of interest with respect to the research, authorship, and/or publication of this article.
Funding
The author(s) received no financial support for the research, authorship, and/or publication of this article.
Data Availability Statement
Data sharing not applicable to this article as no datasets were generated or analyzed during the current study.