
Abstract
Consumer satisfaction in e-commerce directly depends on logistical services. There is a constant dilemma in which logistical service dimensions affect consumers’ product satisfaction. The aim is to determine how specific dimensions of logistics services affect product satisfaction in the e-commerce industry of Pakistan. For this research, a survey questionnaire with a deductive approach was utilized by collecting data from 197 respondents through a convenient sampling technique. Further, hypotheses were tested through a quantitative method with the help of SmartPLS. A measuring instrument was used with six dimensions, that is, availability, delivery time, shipping costs, product quality and condition, information quality, and customer satisfaction related to the product. This research revealed an insignificant effect of product availability, shipping time, and shipping cost on product satisfaction. In contrast, product quality and information quality were found to have a significant and positive effect on product satisfaction. From academic insights to logistical optimization, this research unlocks valuable knowledge for all stakeholders driving Pakistan’s e-commerce revolution. Buckle up for a journey into the heart of this rapidly evolving landscape.
Plain language summary
Consumer satisfaction in e-commerce directly depends on logistical services. There is a constant dilemma in which logistical service dimensions affect consumers’ product satisfaction. The aim is to determine how specific dimensions of logistics services affect product satisfaction in the e-commerce industry of Pakistan. For this research, a survey questionnaire with a deductive approach was utilized by collecting data from 197 respondents through a convenient sampling technique. Further, hypotheses were tested through a quantitative method using PLS-SEM with the help of SmartPLS to validate the measurement model. A measuring instrument was used with six dimensions, i.e. availability, delivery time, shipping costs, product quality and condition, information quality, and product satisfaction. This research revealed an insignificant effect of product availability, shipping time, and shipping cost on product satisfaction. In contrast, product quality and information quality were found to significantly and positively affect product satisfaction. Researchers, academicians, and logistical service providers will benefit from this research, which will also add to the current body of knowledge related to the e-commerce industry, a fast-growing sector in Pakistan.
Keywords
Introduction
In the dynamic business environment, customer demands are often changing, and firms must be comparative in their supply chain and logistic activities to fulfil their needs (S. Khan, Rashid, et al., 2022). For this purpose, logistics service providers are emphasizing more on logistics service quality. Logistic service quality includes availability, product quality and condition, delivery time, and shipping cost (D. Choi et al., 2019). High logistic service quality (LSQ) that meets the customers’ needs tends to enhance their satisfaction and loyalty regarding the product (Chow, 2015; Jain et al., 2021). The quality provided by the service provider satisfies the consumer’s needs through the lowest shipping cost and fast delivery time (Baloch & Rashid, 2022; Hafez et al., 2021; Revindran et al., 2020). A high level of LSQ enhances the competitiveness of business firms. Moreover, the level of information quality and availability of stock integration required for better correspondence, which can only be possible by integrated communication technology (ICT) system, has significantly transformed the re-organization way to integrate and communicate at highly prompt events for one spot better product quality and condition-oriented solutions (D. Choi et al., 2019; Rajendran et al., 2018). Good service quality, such as reliable and on-time delivery, return policy, and so on, enhances customer satisfaction and re-purchase intentions (Agha et al., 2021; Alrazehi et al., 2021; S. A. Khan, 2021).
On-time delivery is directly related to the stock availability in the warehouse before order booking via the respective store’s website (Vasić et al., 2021). This comprises several stock strategy applications to avoid under-stock and overstock situations, which are highly dissatisfied drivers for the customer (Rashid et al., 2020). Delivery time management and handling are critical drivers for customer satisfaction in the e-commerce industry (Grant & Tang, 2020). Therefore, effective supply chain management with a high level of mobility is required, as stated by Jain et al. (2021), that highly mobilized supply chain management unquestionably adds value to logistics service quality (LSQ). The subject has been highlighted through numerous research to test the logistics service quality and consumer satisfaction in e-retails. Many countries have accepted the tendency to enhance logistics service quality, and it is found that there are a few pieces of research in Pakistan where consumer satisfaction areas are the point of doubt in the context of shipping cost, product quality and condition, availability, and delivery time of e-retailer (S. A. Khan, 2021). A study in Lithuania suggests that consumer service plays a vital role in flourishing all operational logistics companies, especially delivering courier services and postal services need to take care of consumer needs to seek consumer satisfaction. For all logistical service companies, providing high-quality service to the consumer is the competitive advantage in the respective industry. Capturing more consumers through high logistics service quality leads to capturing the market, a milestone to becoming a logistics service market leader (Meidutė-Kavaliauskienė et al., 2014). Companies need to consistently assess their logistic service quality to satisfy the customers and the quality of the product and services (Kaswengi & Lambey-Checchin, 2019). It helps firms maintain good customer relationships and a sustainable competitive edge (Balci et al., 2019). As stated by Siyal et al. (2021), performance on quality delivery has a constructive influence on consumer satisfaction. Along with producing good quality products. It is also essential to address customers’ changing needs to enhance their satisfaction (M. C. Chen et al., 2019).
Despite extensive studies addressing these aspects in the international context, there is still a gap in the existing body of knowledge in terms of developing effective strategies for customer product satisfaction by logistic service quality in the context of Pakistan. Therefore, the current study examines the impact of shipping cost, product quality and condition, availability, and delivery time, which are the drivers of logistics service quality on customer product satisfaction in the vice industry. As in the e-retail logistics service industry consumer satisfaction is the spine, but unfortunately, the reality is far behind the perception, that is, logistic service quality is not efficient enough to attain product satisfaction which is a considerable research gap and point of concern. Consequently, customer dissatisfaction raises a question mark on the competitive advantage of e-retailers.
Therefore, the objective of this research is to enhance the conceptualization of what logistics quality drivers such as shipping cost, product quality and condition, availability, and delivery time comprise and how it is framed to deliver the best quality and responsive shopping solution in one go regarding e-commerce industry, domains like business to business (B2B) and business to consumer (B2C) quality of services drivers. Therefore, based on the research problem and research objectives, the research question is as below:
To what extent do the drivers of logistics service quality (shipping cost, product quality and condition, availability, and delivery time) affect product satisfaction in the e-commerce industry of Pakistan?
Literature Review
SERVQUAL Model and Expectancy Disconfirmation Theory
Product satisfaction could be measured by utilizing models. At the same time, these models clarify different theories. Among other models, the SERVQUAL model has widely been used to measure LSQ (Yoo & Park, 2007). SERVQUAL measures assurance, responsiveness, and reliability (Parasuraman et al., 1988). Various researchers used this model for measuring service quality with modified constructs in logistics. The SERVQUAL conceptualizes the expectancy disconfirmation theory for product-related customer satisfaction (Barsky, 1992). Oliver (1980) argued that our satisfaction hinges on whether reality meets our expectations. Exceeding them breeds happiness (positive disconfirmation), while falling short spells disappointment (negative disconfirmation). The SERVQUAL model guides in measuring the service quality by indicating the lapses between expectations to be rendered and the actual performance. This model establishes five dimensions; empathy, assurance, tangibility, responsiveness, and reliability (Mohsin & Ryan, 2005; Nadiri & Hussain, 2005).
Relevant Literature
Previous research highlighted that LSQ impacts customer satisfaction and re-purchase intentions across various industries including food, bank, health, education, hospitality, and so on (Kaswengi & Lambey-Checchin, 2019; Mentzer et al., 2004). Service quality is defined in various ways, Grönroos (1984) defined service quality as, “a perceived judgment resulting from an evaluation process where customers compare their expectations with the service they perceive to have received” (p. 37). While it is defined by Parasuraman et al., (1985) as, “the extent to which an organization meets customer expectations consistently” (p. 42). Parasuraman et al. (1988) stated about perceived quality is “the judgement of the consumer on the excellence or superiority of a product/service” (p. 3). Yet another author Bitner and Hubbert (1994) mentioned perceived quality as, the “global impression of the consumer on the relative superiority or inferiority of an organization and its services” (p. 7). The perceived service quality has a significant impact on customers’ purchase intention and it also enhances the firm’s image in the mind of its customers that enhance their satisfaction level (Hong et al., 2020; Roy et al., 2018). The relationship between customer satisfaction and service quality in logistics opened the door to expanding the perspective of product satisfaction. Researchers have measured the dimensions of quality and its relationship in various contexts (Meesala & Paul, 2018). These dimensions include product availability, product quality, product delivery time, shipping cost, information quality etc.
According to Xing et al. (2010), availability measures the product in stock. The availability also refers to full stock in the backhand and warehouse of e-retail stores (Lorenzo-Romero et al., 2021). It has been related to the stock availability in the warehouse before order booking via the website of the respective store (Vasić et al., 2021). This comprises several stock strategy applications to avoid under-stock and overstock situations, which are unacceptable to the customers (Hashmi, Amirah, Yusof, and Zaliha, 2021; Hashmi & Mohd, 2020). Product availability is an essential feature in trigging sales, as it influences the product purchase intention (Hausman & Siekpe, 2009; Kumar & Kashyap, 2018; Lee et al., 2008; Sowers et al., 2019). It also enhances the store’s utilitarian worth (Cottet et al., 2017). For e-consumes, effective management is required in the timely delivery of products (Esper et al., 2003), on-shelf availability of products (Ehrenthal & Stölzle, 2013), and efficient reverse logistics processes (Bernon et al., 2011). According to Ehrenthal and Stölzle (2013), the availability of products may be affected by a lack of replenishment and organization issues or timely fulfilment by direct suppliers and may dissatisfy the product satisfaction (Emmelhainz et al., 1991; Zinn & Liu, 2008). The availability shortfalls also occur due to information technology-related problems and promotional processes, and timescale (Ettouuzani et al., 2012). While the logistics literature has addressed these issues, the persistent evolution in retail e-commerce pretences new opportunities and challenges that offer a milieu for future research. Hence, the study proposes the following:
H1: There is a significant impact of availability on product satisfaction.
According to Xing et al. (2010), the condition measures the quality and accuracy of an order. Product quality and conditions also refer to the durability, right value dimension, exemplary performance, and correct specification equal to the customer’s product satisfaction (Saura et al., 2008). Firstly, durability is referring to life, resistance, and resilience related to the product execution, usage, and lasting time span. Secondly, the value of a product enclosed with value dimensions such as economic value relates to the benefit attached in terms of cost, aesthetic value infers as a benefit of structure, packaging, and features present in the respective product, enjoyment value infers as a benefit attached in terms of amusement attained after usage (Bhattacharjya et al., 2016). Thirdly, performance is referring to the capacity and efficiency of the respective product. Lastly, specification refers to the shape, size, variant, and colour of the product (Mentzer et al., 2004).
Previous literature dealt with the e-commerce service quality as reverse logistics (Towers & Xu, 2016), physical distribution service quality (Hüseyinoğlu et al., 2018), and website quality (Parasuraman et al., 2005). According to Mentzer et al. (1989), product condition, timely delivery, and availability are three dimensions of logistics service quality. Based on the previous literature, this study found the above dimension is critical in e-commerce for product satisfaction. Hence, the study proposes:
H2: There is a significant impact of product quality and condition on product satisfaction.
Delivery time refers to the shipping time attached to an order received from the customer (Farooq et al., 2019). In other words, delivery time is the time elapsed from requisition to delivery (Mentzer et al., 1989); and “Timeliness refers to whether products or services were delivered on time or not” (Koufteros et al., 2014, p. 10). Timeliness attached to managing, handling, and fulfilling each demand of customers in that time frame is no easy task for e-retailers (Anjum & Chai 2020). But side by side this delivery time management and handling is a pivotal drivers for customer satisfaction in the e-commerce industry (Grant & Tang, 2020). Delivery time is one of the significant determinants of customer satisfaction (Blut, 2016; Jain et al., 2015; Vakulenko et al., 2019). As delayed deliveries are considered harmful that affect product ratings (Gal & Rucker, 2018). According to Shang and Liu (2011), delivery delays negatively impact product demand which lessens customer demand. Therefore, it is essential to deliver fast with reduced delivery wait time on average. Hence, the study proposes:
H3: There is a significant impact of delivery time on product satisfaction.
Meanwhile, shipping costs refer to shipping charges attached with the order conveyance cost shipping to the customer. Charges involve; managing, handling, and fulfilling every charge related to road delivery, sea delivery, and air delivery. This cost can vary based on the required minimum order quantity (MOQ). But this shipping cost management and handling is a pivotal driver for customer satisfaction in the e-commerce industry (C. Chen & Ngwe, 2018; T. M. Choi, 2019). According to Kuo et al. (2009), there is a significant effect of shipping mode and cost on customer product satisfaction. Hence, the study proposes:
H4: There is a significant impact of shipping cost on product satisfaction.
Information quality refers to information technology infrastructure at the back end of website operations (Melović et al., 2021). D. Choi et al. (2019) defined information quality as, “the simplicity and accessibility of locating items and places.” This includes data privacy regarding customer ordering information, transaction security via credit and debit cards, and customer personal information data mining as a data bank for future usage of premium, regular, and occasional customer sale promotional campaigns, and so on. It is vital for the organization to improve information quality. Information quality is positively associated with customer satisfaction (Desalegn, 2016), as customer payment security and data privacy lead to high customer satisfaction. Finally, Kuo et al. (2009) conducted research using constructs; availability, reliability, and online consumer logistics service quality. This research found a significant effect of availability, reliability, and electronic-based consumer logistics service quality on online consumer satisfaction. Further, consumer satisfaction at electronic buying facilities, reliability, shipping mode and cost, information quality, and product quality and condition found a significant effect of endogenous variables on the exogenous variable. Hence, the study proposes the following Figure 1:
H5: There is a significant impact of information quality on product satisfaction.

Research model.
Research Methodology
This study employed a deductive methodology, following a quantitative approach to gather data from the specified target population (Hashmi, Amirah, Yusof, & Zaliha, 2020; Rasheed et al., 2023). The use of a quantitative-deductive approach is prevalent as it facilitates the utilization of numerical data and enables hypothesis testing to substantiate a theory (Rashid, Rasheed, Amirah, & Afthanorhan, 2022). By employing this approach, researchers can derive knowledge that is inherently true, given clear and accurate parameters (Rashid et al., 2021). Additionally, the research had an explanatory nature, aiming to elucidate theoretical concepts and empirical findings (Rasheed & Rashid, 2023). According to Glymour et al. (2008), a causal research design was implemented, allowing for hypothesis testing and the generation of numerical outcomes. Consequently, the causal design was employed to discern causal relationships between the variables.
Unit of Analysis and Target Population
This study employs distinct units of analysis, enabling the researcher to focus on customers and facilitating the derivation of a reasoned conclusion (Hopkins, 1982; Yurdusev, 1993). In order to assess product satisfaction, data was gathered from online consumers in Karachi, a major metropolitan city in Pakistan.
Sample Size and Sampling Technique
Due to absence of sampling frame, this study used a non-probability sampling technique. Since the study involves an individual unit of analysis related to e-consumers from Karachi, hence convenience sampling technique was applied. A convenience sampling technique is a method of data collection in which the data is freely accessible to get responses cost-effectively (Hair et al., 2011; Rashid & Rasheed, 2023). Hashmi, Amirah, and Yusof (2021) state that a sample size of 100 is adequate whereas 200 responses are robust to generalize the test results. As per Hair et al. (2019), as subsequently referenced by Rashid, Rasheed, and Ngah (2023), the study’s minimum sample size is contingent upon the complexity of the model. A more intricate model with an increased number of predictors necessitates a larger sample size. Following Gefen et al.’s (2011) suggestion of employing a power of 0.8, a medium effect size, and α = 0.05 in the model, a minimum of 180 samples was required to assess the research model. With 197 respondents in the study, it is affirmed that the sample size is adequate for testing the study’s hypotheses. The 208 questionnaires were distributed and 197 valid questionnaires were successfully received back for inclusion in analysis.
Measurement Scale
Various tools are available for data collection, but this research employs a questionnaire instrument for its ability to collect numerical data. The instrument utilizes closed-ended questions pertaining to the research variables, allowing for the collection of a comparatively large sample size, as suggested by Kothari (2004). The questionnaire incorporates a 5-point Likert scale, spanning from strongly disagree to strongly agree. This scale can help increase the response rate by providing different options for the respondents to answer their questions. In this study, a structured questionnaire was adapted from previous studies comprising 16 items (Rashid, 2016; Rashid et al., 2021). A construct “availability” used 2 items, “delivery time” 3 items, “shipping cost” 2 items, “product quality and condition” 2 items, “information quality” 3 items, and “product satisfaction” 4 items.
Data Analysis
Prior to the full scale study, a pilot test involving thirty participants was conducted to validate the questionnaire (Hashmi, Amirah, Yusof, and Zaliha, 2021; Rashid & Amirah, 2017; Rashid et al., 2019). Pilot testing serves to align the research process and enhance the reliability of study outcomes (Rshid, Rasheed, & Amirah, 2023). The pilot test results indicated that the items met the assumptions for confirming items’ reliability. Subsequently, the research employed the PLS-SEM, recommended for its ability to yield comprehensive variance and handle intricate models (Hair et al., 2019). Within the PLS-SEM framework, the measurement model assesses the reliability of the research instrument, while the structural model is employed for hypothesis testing (Hair et al., 2019). Consequently, PLS-SEM using SmartPLS version 3.2.9 was utilized to generate results.
Before the measurement model, the internal consistency of the instrument was assessed followed by detailed discussions on data screening and the demographic profile of the respondents (Hashmi, Amirah, & Yusof, 2020). Further, the measurement model comprising outer loadings, convergent validity, and discriminant validity using the PLS algorithm was assessed. The structural model using PLS-SEM encompassing path analysis and mediation analysis using PLS bootstrapping while predictive relevance using PLS blindfolding was used. Finally, the study validated the findings in light of previous studies. Hashmi, Amirah, Yusof, and Zaliha, (2021) suggested that an alpha coefficient higher than 60% should be considered substantially reliable for analysis. In this regard, all the constructs found higher than a 60% alpha coefficient.
Respondent Profile
The demographic profiles of the 197 respondents illustrated the participants’ age, education, gender, and marital status. Among 197 participants 27 participants (13.7%) belong to the age group of 20 to 25 years, 60 participants (30.5%) belong to the age group of 26 to 30 years, 63 participants (32.0%) belong to the age group of 31 to 35 years, 47 number of participants (23.9%) belong to the age group of above 35 years. While, 62 participants (31.5%) with bachelor’s degrees, 105 (53.3%) participants with Masters, and 30 (15.2%) with others. Whereas 115 (58.4%) were male and 82 (41.2%) were female participants. Besides, married participants were 126 (64.0%) and 71 (36%) were unmarried participants.
Measurement Model
Prior to employing SEM, the measurement model’s conformity was assessed through considerations of convergent validity and discriminant validity, in accordance with S. K. Khan et al. (2021). Convergent validity is deemed to be confirmed when the composite reliability (CR) exceeds 0.70, Average Variance Extracted (AVE) is greater than 0.50, and factor loadings surpass 0.50, as outlined by S. Khan, Rasheed., et al. (2022) and Hair et al. (2013). Table 1 shows that all the loadings (ranged from 0.763 to 0.899 > 0.70), Cronbach’s α value (ranged from .733 to .831 > .70), AVE values (ranged from 0.663 to 0.738 > 0.50), and CR values are more significant than the cutoff values (ranged 0.824 to 0.894 > 0.70); and fulfilling the test assumptions (Das et al., 2021; Haque et al., 2021; Rashid, Ali, et al., 2022).
Construct Reliability and Validity.

Source. Literature.
Discriminant validity is ensured by adhering to the Heterotrait-Monotrait (HTMT) criteria, where HTMT values are expected to be below 0.90, as recommended by Henseler et al. (2015). Nevertheless, some authors propose that HTMT values below 0.85 are more preferable, as suggested by Franke and Sarstedt (2019). Table 2 shows that the HTMT values of information quality, shipping cost, delivery time, condition, product quality, availability, and product satisfaction are <0.85 (S. Khan et al., 2023; S. Khan, Rashid, et al., 2022; Rashid, Ali, et al., 2022). Therefore, discriminant validity is said to be established.
Heterotrait-Monotrait Ratio (HTMT).
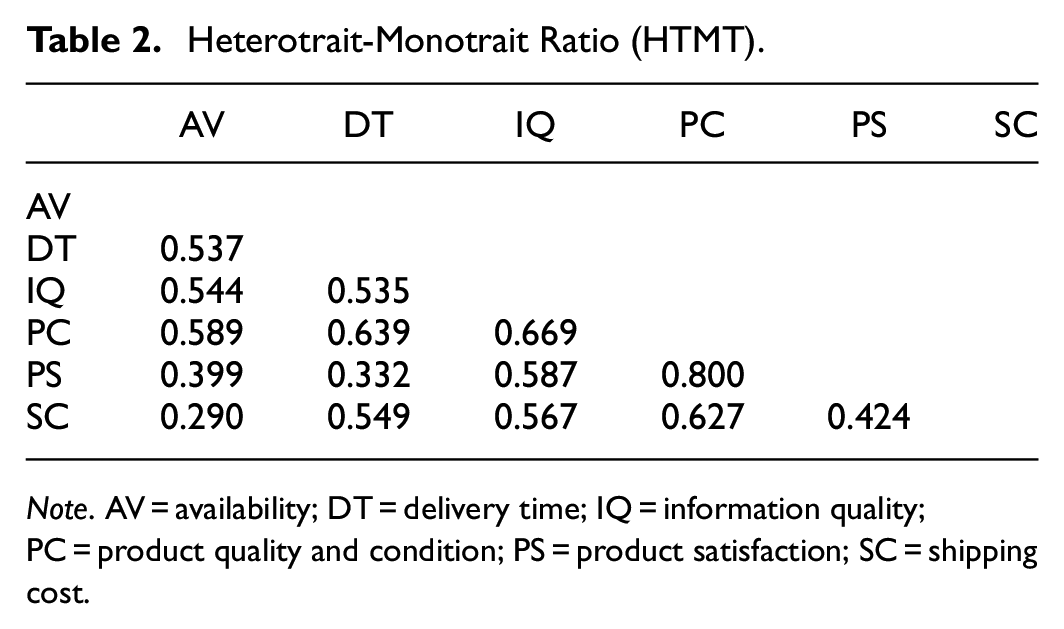
Note. AV = availability; DT = delivery time; IQ = information quality; PC = product quality and condition; PS = product satisfaction; SC = shipping cost.
Further, the results of discriminant validity using cross-loadings to check the statistical differences between latent constructs based on item-wise estimations were performed (Hair et al., 2014; Rashid, Rasheed, Amirah, & Afthanorhan, 2022). Hair et al. (2016) proposed that the indicator reliability should be better in their latent constructs than in other constructs. The outer loading criteria is >0.50 is suggested. Therefore, all indicators have higher construct reliability. Hence, the discriminant validity using cross-loadings has also been achieved and showing that the latent constructs are considerably different from each other. Consequently, an analysis of SEM can be executed.
Structural Equation Modeling (SEM)
Hypothesis-Testing Using PLS Path Modelling
Table 3 shows the SEM results for hypotheses H1, H2, H3, H4, and H5 using PLS bootstrapping at 5000 subsamples on constructs named Availability (AV), Product Quality and Condition (PC), Delivery Time (DT), Shipping Cost (SC), Information Quality (IQ), and Product Satisfaction (PS). Where, the effect of AV→PS (β = .042), DT→PS (β = −.065), and SC→PS (β = .050) (hypotheses: H1, H3, and H4, respectively) are insignificant. Further, the results illustrate that one unit change in AV, DT, and SC will insignificantly bring change in PS. Hence, hypotheses H1, H3, and H4 are not supported. While, the effect of IQ (information quality) and PC (product quality and condition) is positive and significant on PS (product satisfaction) (hypotheses: H2 and H5, respectively). Moreover, the results illustrate that one unit change in IQ and PC will positively and significantly bring change in PS by β = .269; β = .458, respectively. Hence, hypotheses H2 and H5 are supported
Path Coefficients.

Note. SRW = Standardized regression weight.
p < .10. **p < .05. ***p < .01.
Discussion
The study hypothesis H1 (there is a significant impact of availability on product satisfaction) is not supported; where, availability refers to full stock available in the backhand warehouse of an e-retail store (Lorenzo-Romero et al., 2021). It indicates that in e-retail stores the stock-out does not significantly influence customer satisfaction related to that stocked-out product. The findings are inconsistent with the findings of Vasić et al. (2021).
The reason for being insignificant is the virtual warehouse and availability of substitute products at the same e-commerce retailer. Further, this could be manageable by applying several stock strategies as the stocks are not visible to consumers in the e-retail business (Hashmi & Mohd, 2020). The availability of substitute products sometimes triggers purchase intention for substitutes (Sowers et al., 2019). Whereas availability shortfalls occur due to a lack of replenishments by direct suppliers and the e-retailer can overcome this issue by having multiple sourcing strategies.
Hypothesis H2 (there is a significant impact of product quality and condition on product satisfaction) is accepted. The findings are consistent with the findings of Saura et al. (2008). According to Saura et al. (2008), product quality and conditions refer to the right durability, right value dimension, right performance, and correct specification is equal to the right product quality and condition for proper customer satisfaction. Firstly, durability is referring to life, resistance, and resilience related to the product execution, usage, and lasting time span. Secondly, the value of the product enclosed with value dimensions such as economic value relates to the benefit attached in terms of cost, aesthetic value infers as a benefit of structure, packaging, and features present in the respective product, enjoyment value infers as a benefit attached in term of amusement attained after usage (Bhattacharjya et al., 2016). Thirdly, performance is referring to the capacity and efficiency of the respective product. Lastly, specification refers to the shape, size, variant, and colour of the product (Mentzer et al., 2004). Customers are scarred by low-quality and fake products (Chiejina & Olamide, 2014). However, customers perceive more control over the buying process if they are privileged in the case of Cash on Deliver (COD.
Hypothesis H3 (there is a significant impact of delivery time on product satisfaction) is insignificant with a negative effect. Hence the H3 has been rejected, the findings are inconsistent with the findings of Farooq et al. (2019). That means, the shipping time attached to orders received from customers and the timelines attached to managing, handling, and fulfilling each demand of customers in that time frame is not an easy task for the e-retailers (Anjum & Chai, 2020). But this delivery time management and handling is a pivotal driver for customer satisfaction in the e-commerce industry (Grant & Tang, 2020). Delivery time is one of the significant determinants of customer satisfaction (Vakulenko et al., 2019). Whereas, it is evident that the macro factors (economic, environmental, socio, and political) cause disruptions in the o delivery time of e-commerce businesses in developing countries like Pakistan. Moreover, Gal and Rucker (2018) urged that delayed deliveries negatively affect product ratings and eventually, lessen product demand.
Hypothesis H4 (there is a significant impact of shipping cost on product satisfaction) is not accepted. The findings are inconsistent with the findings of T. M. Choi (2019). That means the shipping costs refer to shipping charges attached to the order conveyance cost shipping to the customer. Charges are attached to managing, handling, and fulfilling every charge related to road delivery, sea delivery, and air delivery; this cost can be varied based on the required MOQ. But this shipping cost management and handling is a pivotal driver for customer satisfaction in the e-commerce industry (T. M. Choi, 2019; Miao et al., 2021). Meanwhile, the findings indicate that the shipping cost is not affecting product satisfaction because of cost association. The e-consumers want to pay less for their e-purchase and they do not care about the mode of shipping but they are more concerned about the cost. Therefore, the logistics service quality (LCQ) refers to keeping the shipping cost low.
Hypothesis H5 (there is a significant impact of information quality on product satisfaction) is accepted. The findings are supported by the findings of Melovic et al. (2021) explaining that information quality refers to information technology infrastructure setup programming at the backhand of website operations. This includes data privacy regarding customer ordering information, transaction security via credit and debit cards, and customer personal information data mining as a data bank for future usage of premium, regular and occasional customer sale promotional campaigns, and so on. Customer payment security and data privacy lead to high customer satisfaction. It is imperative for an organization to improve information quality as it is positively associated with product satisfaction (Desalegn, 2016).
Research Implications
This study developed and validated an innovative research model illustrating the influence of LSQ dimensions on product satisfaction. The understanding of the issue, model, and their interconnections was enhanced through the utilization of the SERVQUAL Model and Expectancy Disconfirmation Theory. By contributing to the existing body of knowledge on this subject, the research serves as a foundation for future in-depth and critical examinations. Notably, there has been no prior investigation in Karachi, Pakistan, into the role of LSQ in product satisfaction. Hence, the study’s primary contribution lies in exploring a unique issue, offering valuable insights for academics seeking to expand their understanding. The application of LSQ dimensions appears to positively impact product satisfaction.
The research centered on LSQ and aimed to assist managers in identifying potential applications that could significantly impact product satisfaction. Managers can leverage the insights from this study to gain a deeper understanding of LSQ, its dimensions, and how to effectively collect, assess, and communicate performance related to product satisfaction. The study offers a valuable resource for managers looking to enhance the consumer experience. Additionally, it equips managers with the tools to leverage LSQ for increased efficiency in areas such as product availability, delivery time, information quality, product quality and condition, and shipping costs. Our findings have important implications for administrators and decision-makers, advocating for a proactive approach and policies that encompass all logistics operations. This achievement aligns with the principles of the circular economy concept and associated policies.
Limitations and Recommendations
This research was confined to the metropolitan area of Karachi, Pakistan, in terms of its geographical scope. Additionally, a limited number of variables were chosen for the study. Moreover, LSQ was embraced as a comprehensive variable, and alongside this, the research employed the PLS-SEM approach, although other advanced second-generation statistical techniques could also be considered for future investigations. Our sample size was also limited therefore this study might not be generalized for other demographic variables. Future research can be done on the role of e-retailer logistics service quality drivers, that is, availability, delivery time, information quality, product quality and condition, and shipping cost on sustainable supply chain performance with mediating effect of product satisfaction. Secondly, research can be on the effect of intermediary’s logistics service quality factors, that is, speed, responsiveness, and timelines logistics service quality on product satisfaction. Lastly, research can be done on the influence of vendor-managed inventory, and logistics service quality on service user loyalty.
Footnotes
Declaration of Conflicting Interests
The author(s) declared no potential conflicts of interest with respect to the research, authorship, and/or publication of this article.
Funding
The author(s) received no financial support for the research, authorship, and/or publication of this article.
Data Availability Statement
Data sharing not applicable to this article as no datasets were generated or analyzed during the current study.