
Abstract
The goal of this research is to evaluate the social commerce. With this goal, this research aims to determine: (1) the longitudinal distribution of the articles and citations in social commerce (2) the most productive countries, journals, and affiliations in social commerce articles; (3) the most cited articles in social commerce research; and (4) the most recurrent keywords and Web of Science (WoS) categories are involved in the social commerce studies. The research conducted social commerce research papers published between 1995 and 2023 in the WoS database. We used the following search query: “social commerce*,” “social electronic commerce*,” “social e-commerce*,” “s-commerce*,” “Facebook commerce*,” “Instagram commerce*,” and “social media commerce*” The study examines 965 articles, were recorded on September 21, 2023. The data obtained were figured with the visual mapping technique. Various techniques, such as bibliographic coupling of countries, journals, and institutions of authors, co-authorship of countries, co-citation of journals, and co-occurrence of author keywords, were used in bibliometric analysis. Most of the research was in 2022, and the greatest number of citations were in 2022. The most efficient country was China. Swansea University was the most productive affiliation, with publications, citations and total links. It is found that the articles were primarily written in the field of Business, with 363 papers. There has been a substantial surge in the volume of studies on social commerce since 2013, indicating a significant growth in research interest in this field. Finally, researchers working on social commerce can understand the literature based on this current study.
Plain Language Summary
This study aims to identify the longitudinal distribution of articles and citations in the field of social commerce, the most productive countries and journals related to social commerce, the most cited articles in social commerce research, the most recurrent keywords in social commerce research and the Web of Science (WoS) categories. The search covered research articles on social commerce published in the WoS database between 1995 and 2023. The 965 articles examined in the study. The data obtained were analysed using the visual mapping technique. Most research was conducted in 2022 and most citations occurred in 2022. The most productive country was China. Swansea University was the most prolific organisation in terms of publications, citations and total links. Articles were found to be mainly in the field of business studies. The number of studies on social commerce has increased significantly since 2013, indicating a clear increase in research interest in this area. Researchers working on social commerce can gain insight into the literature based on this current study.
Introduction
Since the internet is used extensively in human life today, it has also significantly affected commercial life. Ali, Naseem et al. (2022, p. 5) claimed that the connections forged during someone’s academic years can serve as valuable resources for problem-solving. Especially in the context of the ultimate consumer, online shopping has started to replace purchasing in a store or market. The Covid-19 pandemic process in 2020 has further accelerated the establishment of this understanding for consumers. The meeting of this type of shopping, also called e-commerce, with social media has created the concept of social commerce. Social commerce is when social media enables consumers to be more actively involved in the marketing and selling of goods and services in online marketplaces and other social networking sites. Social shopping connects customers and social commerce vendors. Consumers can take on different roles, such as content creation, being a seller in the store, or even owning the store (Stephen & Toubia, 2010, p. 215). Social commerce refers to the alteration of e-commerce by adopting Web 2.0 features to enable greater consumer engagement and increase economic value (Huang & Benyoucef, 2013, p. 246).
Social commerce is a business model combining e-commerce experience with social media. The intensive use of social media sites has led to the emergence of social commerce as a new electronic commerce area. Social commerce users share their knowledge and experiences about the products they buy online through social media sites (Kim & Park, 2013, p. 319). It refers to using Web 2.0 technology to enable users of e-commerce platforms to communicate and interact with each other. By using these technologies through social networking platforms, consumers benefit from each other’s experiences with the products they intend to purchase. E-commerce focuses on one-to-one interaction with consumers, while social commerce relies on consumer interaction (N. Hajli et al., 2017, . 133). Social commerce combines social and commercial activities (Lu et al., 2016, p. 226). Y. Chen et al. (2019, p. 236) tried to reveal with a model how product recommendations on social media affect the impulsive buying behavior of someone using this platform. In the model they examined in the context of signal theory, they found that impulsive buying behavior was influenced by the signals related to the recommender and the product, and trust was a determining factor. Although social commerce is generally defined as combining social media and electronic commerce, J. Chen and Shen (2015) argue that there are two essential differences. These are social media-supported business activities based on WeChat, Facebook, Whatsapp, and Twitter. At the same time, e-commerce includes features such as user-friendly products, shopping carts, search engines and preference-based systems. Ali, Jiang et al. (2022, p. 3683) also indicated that commerce positively affected the environment.
Yahoo proposed “social commerce” in 2005 while promoting collaborative online shopping tools. To date, its content and scope, as well as its definition, have changed as internet use has evolved (KPMG, 2018, p. 3). Previously, Amazon’s establishment of the review and rating system in the late 1990s was considered as their first application (Lu et al., 2016, p. 226). With the growing popularity of social technologies, social commerce has emerged as a sub-sector of e-commerce. It has provided new opportunities for marketing activities (Featherman & Hajli, 2016, p. 251). Social commerce, which combines social interactions, offers marketers different market opportunities. As a result of social interactions such as a consumer voting for a product, reviewing other reviews, posting, commenting and recommending on forum sites, they create value with the company and influence the purchasing behavior of other consumers (N. Hajli, 2015, pp. 183–184). Content or sharing created by a consumer in social commerce is essential in decision-making while shopping online (N. Hajli & Sims, 2015, p. 350).
According to the new Digital Global Overview Report 2022, published in partnership with We Are Social and Hootsuite, as of January 2022, the world’s population is 7.91 billion, and 57% live in cities. Cell phone users have reached 5.31 billion, and internet users have reached 4.95 billion. 67.1% of the world’s population uses cell phones, and 62.5% has the internet. Approximately 4.62 billion individuals, which accounts for 58.4% of the global population, are active users of social media platforms. The rate of those accessing the internet via mobile phones is 92.1% (Kemp, 2022). These developments led to an increase in social commerce from day to day.
Many channels are being used in the spread of social commerce. These include social media, online forums, sites that allow users to review and evaluate a product (e.g., Amazon.com), social platforms that enable users to share information and experiences worldwide quickly (e.g., Wikipedia) and virtual worlds. Virtual worlds are also a crucial channel for knowledge production and sharing. Consumers can learn and do in a hands-on way through learning by doing in virtual worlds (M. N. Hajli, 2014a, p. 391). Online ratings and reviews are the most common form of social interaction. An unknown consumer, an expert or a familiar friend can make these reviews and ratings. A customer can get information from reliable sources for a product he/she has not yet purchased and experienced. This is the most beneficial and effective method. Amazon.com is a leader in this area and constantly improves (Amblee & Bui, 2011, pp. 91–92). As social networking sites become more commercialized, social networking features are added to e-commerce sites. On the other hand, companies selling in-store have increased their use of social media to promote their products, brand communication, customer relationship management, etc. (Zhang et al., 2014, p. 1017).
There are many studies indicating that social commerce has a close relationship with concepts such as social relationships, social support, social media and social interaction (Bai et al., 2015; J. Chen & Shen, 2015; M. N. Hajli, 2014b; Hu et al., 2019; C.-Y. Li, 2019; Liang et al., 2011; Sheikh et al., 2019; Tajvidi et al., 2021; Yahia et al., 2018; Yang, 2021; Zhu et al., 2016). These concepts significantly impact social commerce and consumers’ online purchasing behavior. Liang et al. (2011) investigated the effects of online social support on social commerce. Emotional and informational support elements were the most important social support mechanisms. M. N. Hajli (2014b) investigated the impact of social factors on social commerce intention and relationship quality. As a result, it was found that social support significantly influences relationship quality and relationship quality measured by involvement, trust, and satisfaction improves social commerce intention. In their study, Bai et al. (2015) examined how social and commercial characteristics impact consumers’ purchasing behavior in social commerce, exploring the elements that influence their buying decisions. As a result, social support directly affects consumer purchase intentions, and user-generated content plays an important role. J. Chen and Shen (2015) found that informational and emotional support significantly influenced consumers’ trust, influencing shopping and sharing in social commerce. Tajvidi et al. (2021) concluded that social support affects the quality of social relationships on brands’ websites. In social commerce, it is stated that informational and emotional support improve consumers’ perceptions. The link between social support and relationship marketing in social commerce is theoretically strong. Yang (2021) found that individuals who have previously received social support in social commerce tend to support others as well. Thus, supported people can also share their experiences with others by constantly participating in social commerce channels.
There are previous studies on bibliometric analysis and visual mapping of the concept of social commerce. Details about the studies are shown in Table 1.
Past Studies.

According to the table, there has not been so much bibliometric analysis on social commerce. Most of the studies generally investigated “social commerce,” “social e-commerce,” “social electronic commerce” as a keyword. “Instagram commerce” and “social media commerce” is also integrated this study. On the other hand, the authors used Citebase, HistCite, SATI, and UCINET analysis programs. In this study, we preferred Vosviewer. The past studies were begun after 2000, but this study was started in 1995, the date of the first article written in the field of social commerce.
Thus, this study aims to understand how social commerce is used in academic research. Although there has been a lot of reflection on the various uses of social commerce concept, there is currently a lack of an in-depth overview of the studies that have been done. Therefore, that research fills this gap by performing a bibliometric analysis of publications on social commerce research articles published in the Web of Science (WoS) database between 1995 and 2023. Through these objectives, this study is expected to provide detailed information on the subject to the researchers who will work on this subject by making a bibliometric analysis of the studies on social commerce. Various techniques are used, such as bibliographic coupling of countries, journals, and affiliations of authors, co-authorship of countries, co-citation of journals, and co-occurrence of author keywords. The articles are visualized in this direction with the VOS viewer mapping method.
This study consists of three parts. In the introduction, social commerce is expressed. After giving information about the data collection and method of the study, bibliometric analysis and visual mapping results are displayed. In the conclusion part of the study, there are suggestions for the following studies.
Method
Data Collection
This study covers studies which are published between 1995 and 2023. Figure 1 shows a systematic shortlisting of articles. It was done using PRISMA (Preferred Reporting Items for Systematic Reviews and Meta-Analyses). PRISMA statement, a 2009 publication, was designed to assist authors of systematic reviews in providing transparent reporting by effectively communicating the purpose of the study, detailing the authors’ methodologies, and accurately conveying their findings. The 2020 update of the PRISMA statement substitutes the previous 2009 version. It offers refreshed reporting guidelines to incorporate the latest advancements in identifying, selecting, assessing, and summarizing studies. These revised guidelines reflect the evolution of practices and methodologies in systematic reviews, ensuring more accurate and comprehensive reporting of research findings (Page et al., 2021, p. 1).

PRISMA flow diagram for social commerce records.
This study seeks to answer research question (RQ)s: RQ1: What is the current situation of social commerce research and the longitudinal distribution of the articles and citations? RQ2: Regarding countries, journals, and affiliations, which are the most productive contributors to social commerce studies? RQ3: What are the most often cited documents in social commerce research? RQ4: What are social commerce studies’ most recurrent keywords and WoS categories? With these RQs, this research aims to determine: (1) the longitudinal distribution of the articles and citations in social commerce (2) the most productive authors, journals, and affiliations in social commerce articles; (3) the most cited articles in social commerce area; and (4) the most recurrent keywords and WoS categories involved in the social commerce studies.
The social commerce research publications were found using the WoS database. In this database, we used the following search query: “social commerce*” OR “social e-commerce*” OR “s-commerce*” OR “social electronic commerce*” OR “Facebook commerce*” OR “Instagram commerce*” OR “social media commerce*” (Topic). In Web of Science database, with these keywords, there are 1,302 papers. As document types, we included articles and excluded proceeding papers, early access, review articles, book chapters, editorial material, book reviews, letters, biographical-items, corrections, data papers. The research query topic contains a search author keywords, keywords plus, title and abstract -a totally of 453 papers excluded from the analysis. Bibliometric analysis was carried out with the bibliometric data of 965 articles. The data were recorded on 21.09.2023 as of 12.24.
Analysis
Bibliometric analysis summarizes large amounts of bibliometric data to demonstrate a study topic or field’s intellectual structure and emerging patterns (Donthu et al., 2021, p. 287). Some of the methods of bibliometric analysis are co-citation, bibliographic coupling, co-authorship, and co-occurrence. Bibliographic coupling determines the similarities between documents by identifying articles that share the same references (Veloutsou & Ruiz Mafe, 2020, p. 4). In a study of co-citation, the relationship between researchers is determined by the degree of citation in the same publications (Perianes-Rodriguez et al., 2016, p. 1186). Bibliographic coupling and co-citation analysis are the most critical bibliographic techniques for quantitatively assessing the relationship between the subjects of two documents (Belussi et al., 2019, pp. 2–3). The author keywords co-occurrence determines the number of times two keywords appear most frequently in the same articles, thus indicating their proximity (Gao et al., 2021, p. 1669; Veloutsou & Ruiz Mafe, 2020, p. 4). Co-authorship analysis enables one to know the volume of publications of a country and its main collaborations with other countries (Gao et al., 2021, p. 1671). Numerous bibliometric techniques, as mentioned above, are employed in this research, including the bibliographic coupling of countries, bibliographic coupling of journals, bibliographic coupling of institutions of authors, co-authorship of countries, co-citation of journals, and co-occurrence of author keywords. Different approaches can be taken to build a bibliometric network. These approaches are complete counting and fractional counting methods. According to Perianes-Rodriguez et al. (2016, p. 1192), the fractional counting method has the appealing feature of weighting each activity equally, such as co-authoring or mentioning a publication. When using the full counting system, some steps may have significantly more weight than others, which is undesirable. So, as a method, fractional counting is used in this research.
Tools
VOS viewer program was used for bibliometric analysis. VOS viewer, which van Eck and Waltman designed, is a Java application for evaluating and visualizing citation networks in scientific resources. VOS viewer is concerned with the graphical depiction of bibliometric maps and is particularly effective for displaying huge bibliometric maps in an understandable format (Aria & Cuccurullo, 2017, p. 962). The program offers a viewer with which the bibliometric maps can be viewed in detail. The visualization capabilities of VOS viewers are beneficial for maps containing at least a moderate number of items (van Eck & Waltman, 2010, p. 524). The VOS viewer has three visualizations. There are three of them: network, overlay, and density visualization. In network visualization, the size of the label and circle is determined by the item’s weight. The label and circle will grow more prominent as an item’s weight grows. The distance between two visual elements indicates the relationship between aspects regarding methods. The closer the two items are, the stronger their relationship. In the item density visualization, items are represented by their label, similar to the network visualization (van Eck & Waltman, 2022, pp. 9,11). For this research, network visualization and density visualization are used. Additionally, longitudinal trends of publications and citations about social commerce articles are studied. For descriptive analysis, Microsoft Excel was chosen for this study.
Results and Discussion
A considerably upward publication growth has been observed in the last 10 years. As mentioned above, the most important reason is the increase in the use of mobile phones and social media and the interest of more researchers and academics in the subject.
Longitudinal Distribution of the Articles and Citations
This part will answer RQ1: What is the current situation of social commerce research and the longitudinal distribution of the articles and citations? 965 articles were published and indexed in the WOS from 1995 to April 2023. A total of 30,223 citations were made from 1995 to April 2023. As of 2010, there has been a significant increase in the number of citations. Table 2 displays the number of articles and citations about social commerce in relation to years starting from 1995. In this table, the number of articles on social commerce has increased over time, from 2 in 1995 to 965 by 2023 as of the date of this study. Most of the articles conducted were written in 2021. Table 2 also shows that these studies had 30,223 citations. The most cited year is 2022 for now.
Articles and Citations per Year.
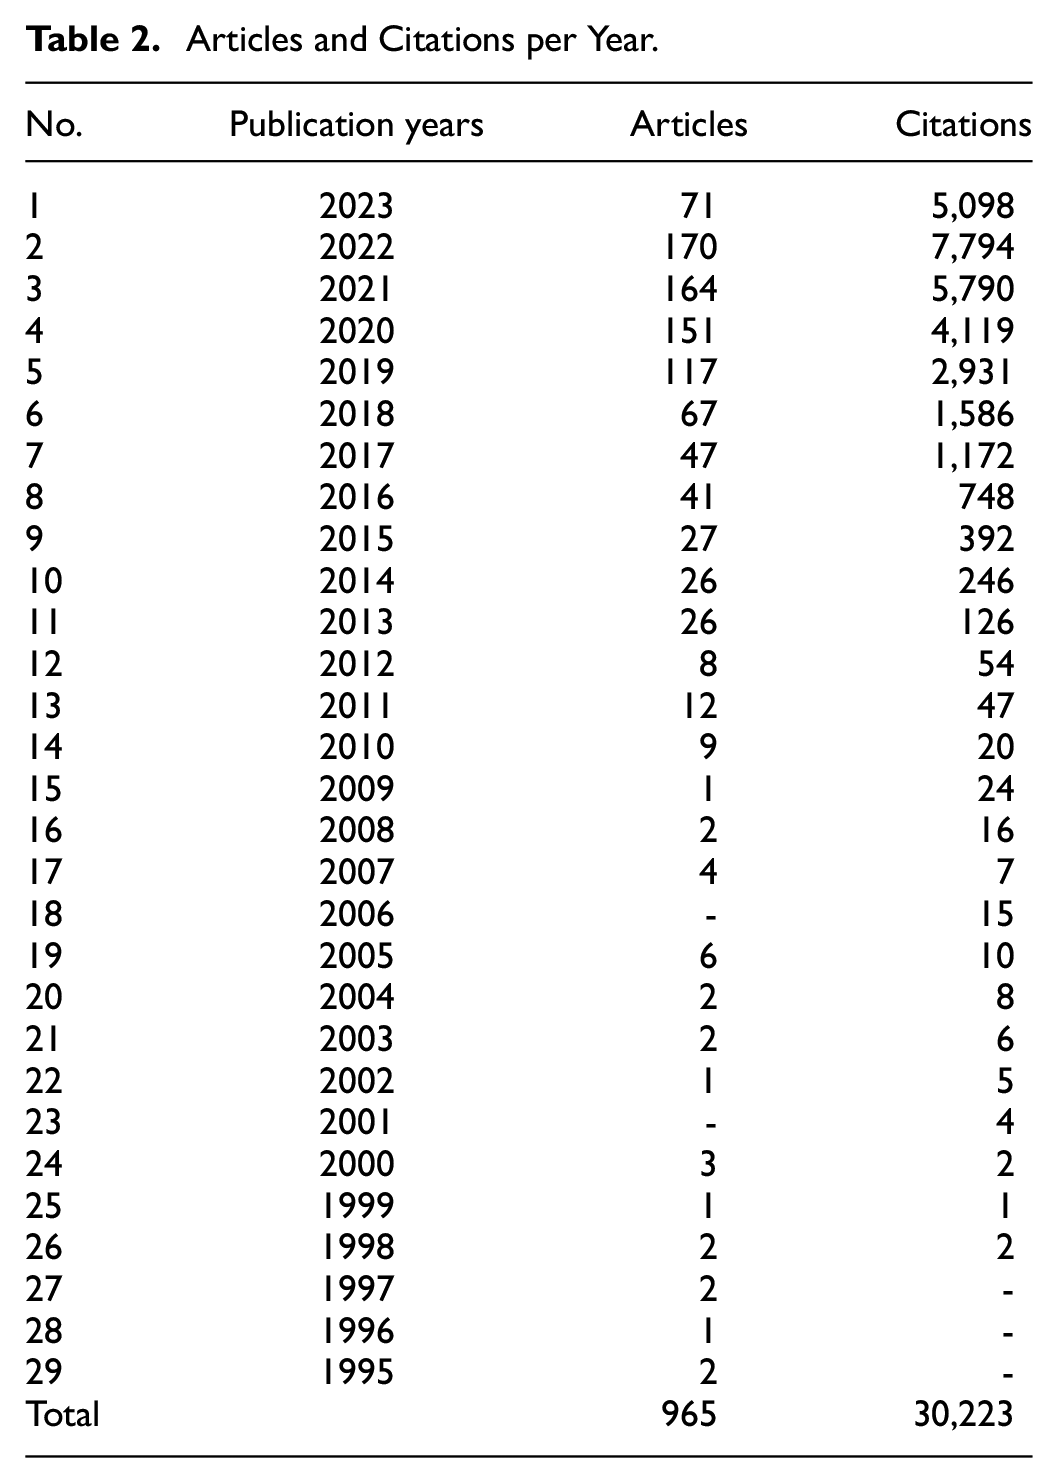
Figure 2 shows the trend of studies about social commerce since 1995. Number of articles and citations started to rise by 2013. The figure shows that articles on social commerce and their citations have been an increasing trend toward the present day. Since the 2023 publication and citation process is ongoing, the number of articles and citations will likely be higher at the end of the year.

Longitudinal distribution of the articles and citations.
Bibliographic Coupling Analysis
Bibliographic coupling is a term introduced by Kessler (1963) of the Massachusetts Institute of Technology (Weinberg, 1974, p. 189). The examination of related bibliographies in papers is known as bibliographic coupling (Belussi et al., 2019, p. 2). In bibliographic coupling analysis, documents, journals, authors, affiliations, and countries are used as a unit of analysis. This research uses affiliations, countries and journals as a unit of bibliographic coupling analysis. This section will reply RQ2: Regarding countries, journals and affiliations, which are the most productive contributors to social commerce studies?
The total strength of the bibliographic coupling linkages with other organizations is determined for each -1,076 affiliations. The affiliations with the most significant overall connection strength are chosen. Table 3 indicates the most efficient universities on social commerce articles. The statistics demonstrate only the 10 most productive ones regarding the total link strength. According to the table, the most efficient university is Swansea University. Then, Newcastle University UK is the second and USCI University is third. The following universities are University of Science Technology of China CAS, Xi An Jiaotong University, Universiti Tunku Abdul Rahman (UTAR), City University of Hong Kong, Huazhong University of Science Technology, Universiti Sains Malaysia, and Hefei University of Technology.
Top 10 Affiliations.

Figure 3 also shows the 10 most efficient universities for social commerce articles. According to the bibliographic coupling analysis, there are three clusters of affiliations. The first cluster consists of five organizations: City University of Hong Kong, Hefei University of Technology, Huazhong University of Science Technology, the University of Science Technology of China CAS, and Xi An Jiaotong University. The second cluster consists of three organizations: UCSI University, Universiti Sains Malaysia, and Universiti Tunku Abdul Rahman (UTAR). The third cluster consists of two organizations: Newcastle University UK and Swansea University. These clusters are also shown in Figure 3.

Bibliographic coupling of affiliations of authors network visualization.
The total strength of bibliographic coupling linkages with other nations is computed for each of the 79 countries. The countries with the greatest total link strength are chosen. Table 4 shows the top 10 countries/regions on social commerce articles. China is the most efficient country with 351 articles, 10,576 citations and 16,236.63 total link strength. According to the table, the USA is the second with 197 articles, 9,221 citations and 8,725.94 total link strength, followed by England with 62 articles, 3,535 citations and 4,725.34 total link strength.
Top 10 countries/regions by bibliographic coupling analysis.

Figure 4 also shows the 10 most efficient countries on social commerce articles. There are three clusters of countries, according to the bibliographic coupling analysis. The first cluster comprises five countries: China, South Korea, Spain, Taiwan, and the USA. The second cluster consists of four countries: England, India, Malaysia, and Saudi Arabia. The third cluster consists of only one country, which is Australia. These clusters are also shown in Figure 4.

Bibliographic coupling countries/regions network visualization.
The total strength of the bibliographic coupling linkages with other journals is determined for each of the 340 journals. The journals with the greatest total link strength are chosen. Table 5 indicates the top 10 journals on social commerce articles. The statistics demonstrate only the 10 most productive ones. According to the table, the most efficient journal is the Journal of Retailing and Consumer Services, with 39 articles, 1,191 citations and 2,246.98 total link strength. Then, the Sustainability is the second with 40 articles, 320 citations, and 1,875.54 total link strength, and International Journal of Information Management is third with 35 articles, 3,366 citations and 1,874.89 total link strength. The following journals are Electronic Commerce Research and Applications, Information & Management, Internet Research, Computers in Human Behavior, Frontiers in Psychology, Journal of Business Research, and Information Technology & People.
Top 10 Journals by bibliographic coupling analysis.

Figure 5 also shows the 10 most efficient journals on social commerce articles. According to the bibliographic coupling analysis, there is only one cluster of about 10 journals.
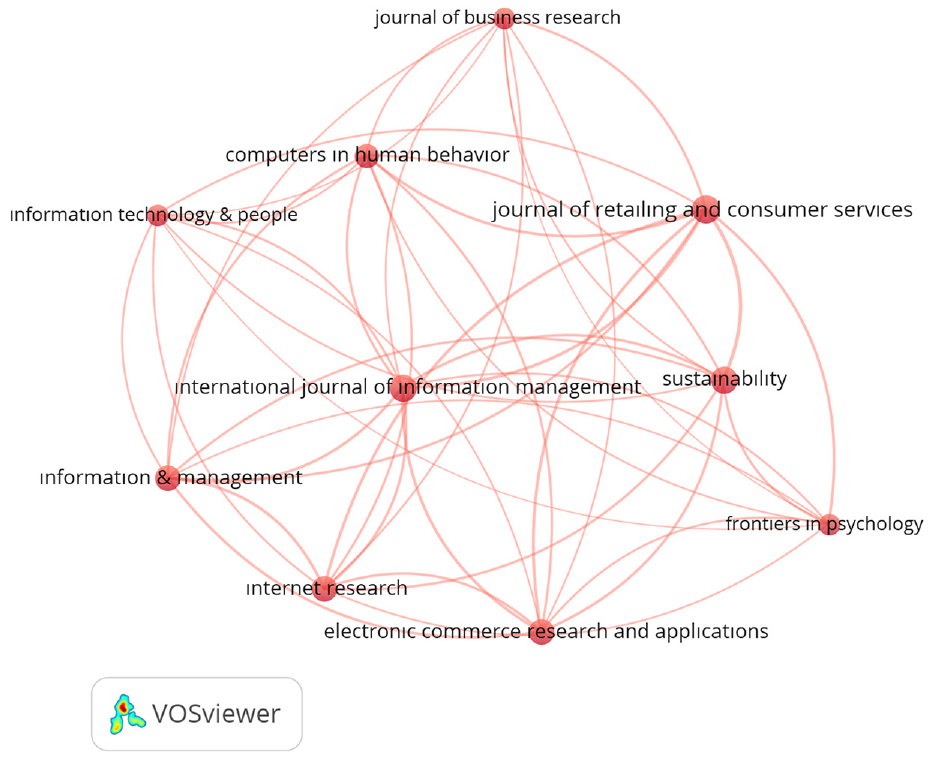
Bibliographic coupling journals network visualization.
Co-Authorship Analysis
Co-authorship analysis shows the number of publications of a country and its leading cooperations with other countries. In co-authorship analysis, authors, organizations and countries are used as a unit of analysis. This research uses only country/region as a unit of co-authorship analysis. This section will also reply RQ2.
For each of the 79 countries, the total strength of the co-authorship links with other countries is calculated. The countries with the greatest total link strength are chosen. According to co-authorship analysis, Table 6 shows the 10 most efficient countries on social commerce articles. China is the most efficient country with 351 articles, 10,576 citations and 144.00 total link strength. According to the table, the USA is the second with 197 articles,9,221 citations and 97.00 total link strength, followed by England with 62 articles, 3,535 citations and 49.00 total link strength.
Top 10 countries/regions by co-authorship analysis.
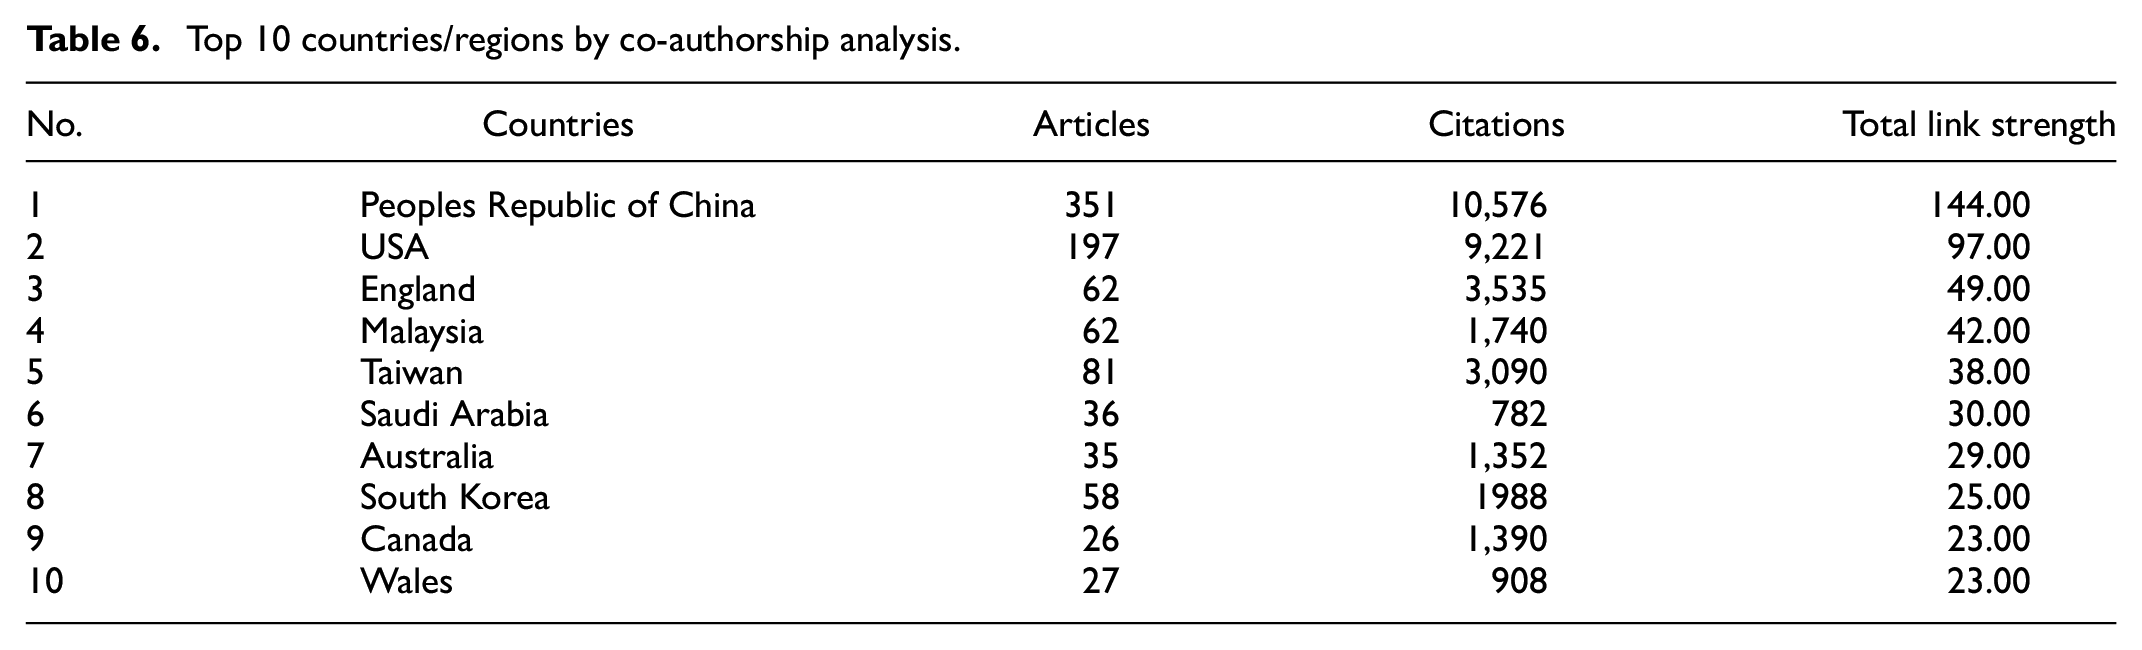
Figure 6 also shows the 10 most efficient countries on social commerce articles. There are three clusters of countries according to the co-authorship analysis. The first cluster consists of five countries: Australia, England, Malaysia, Saudi Arabia, and Wales. The second cluster consists of three countries: China, Taiwan, and USA The third cluster consists of two countries: Canada and South Korea. These clusters are also shown in Figure 6.

Co-authorship countries network visualization.
Co-Citation Analysis
The more two scholars are referenced in the same articles, the more closely related they are, according to co-citation analysis (Perianes-Rodriguez et al., 2016, p. 1186). In co-citation analysis, cited references, cited journals and cited authors are used as a unit of analysis. This research uses cited journals as a unit of co-citation analysis. This section will also reply RQ2.
For each of the 14,146 sources, the total strength of the co-citation links with other sources is calculated. The journals with the greatest total link strength are chosen. Table 7 indicates the top 10 journals on social commerce articles according to the co-citation analysis. The statistics demonstrate only the 10 most productive ones. According to the table, the most efficient journal is the Computers in Human Behavior, with 2,254 citations and 2,141.42 total link strength. Then, International Journal of Information Management is the second with 2,266 citations and 2,139.54 total link strength, and Journal of Business Research is third with 1,954 citations and 1,874.98 total link strength. The following journals are MIS Quarterly, Information & Management, Electronic Commerce Research and Applications, International Journal of Electronic Commerce, Journal of Retailing and Consumer Services, Decision Support Systems, and Journal of Marketing.
Top 10 Journals by co-citation analysis.

Figure 7 also shows the 10 most efficient journals on co-citations of journals network visualization. According to the co-citation analysis, there is only one cluster of about 10 journals.

Co-citations journals network visualization.
Keywords Co-occurrence and WoS Categories
This analysis will answer RQ4: What are social commerce studies’ most recurrent keywords and WoS categories? The keywords contain essential information that reflects the main content of the articles (Yan & Zhiping, 2023, p. 5). In the keyword co-occurrence analysis, the total strength of the co-occurrence links with other terms is determined for each of the 2,645 keywords. The top 20 keywords based on total link strength are chosen. According to the co-occurrence analysis, Table 8 indicates the top 20 keywords on social commerce articles.
Author Keywords.

The statistics in Table 8 demonstrate only 20-ones with occurrences and total link strength. According to the table, the most recurrent keyword is social commerce, with 395 occurrences and 395 total link strength. Then, trust is second with 102 occurrences and 102 total link strength, and social media is third with 99 occurrences and 99 total link strength. The following keywords are e-commerce, purchase intention, social support, customer engagement, electronic commerce, social presence, social e-commerce, Facebook, social networks, perceived value, s-commerce, perceived risk, social capital, social shopping, ewom, satisfaction, and live streaming.
Figure 8 shows the 20 most recurrent author keywords on social commerce articles. There are five clusters of keywords according to the co-occurrence analysis. The first cluster consists of six keywords: e-commerce, Facebook, s-commerce, social commerce, social media, and social networks. The second cluster consists of six keywords: electronic commerce, perceived value, social capital, social e-commerce, social presence and social support. The third cluster consists of four keywords: customer engagement, ewom, live streaming, and purchase intention. The fourth cluster consists of three keywords: perceived risk, satisfaction, and trust. The fifth cluster consists of only one keyword which is social shopping. These clusters are also shown in Figure 8.

Co-occurrences of author keywords network visualization.
The total strength of the co-occurrence links with other keywords is calculated for each of the 20 keywords of the 2,645 author keywords. The keywords that have the greatest total link strength are chosen. Figure 9 shows co-occurrences of author keywords density visualization. The red region shows the most repeated author keywords in social commerce articles. As the number of repetitions of keywords decreases, the color changes from red to blue.

Co-occurrences of author keywords density visualization.
The distribution of studies in the field of social commerce according to WoS categories is shown in Table 9. According to the table, the studies on social commerce are primarily conducted in the field of Business, with 363 articles, Computer Science Information Systems, with 184 articles in the second place and Information Science Library Science, with 136 articles in the third place. The following WoS categories are Management, Computer Science Interdisciplinary Applications, Psychology Multidisciplinary, Environmental Sciences, Environmental Studies, Green Sustainable Science Technology, and Telecommunications.
Web of Science Categories.

The Most Cited Articles
This section will reply RQ3: What are the most often cited documents in social commerce research? Table 10 shows the most cited articles on social commerce. The most cited article is prepared by Hamari et al. (2016). This article received 1,569 citations. Second article is written by Liang et al. (2011) which has 686 citations
The Most Cited Articles.

Conclusion
This study is critical because it covers all years in the Web of Science (WoS) database. Analyzing bibliometric literature related to social commerce is the aim of this study. The keywords “social commerce,” “social e-commerce,” “s-commerce,” “social electronic commerce,” “Facebook commerce,” “Instagram commerce” and “social media commerce” were exercised to get the data, which is based on a topic. The filtered data gathered 965 related articles on social commerce containing 340 journals, 79 countries, and 1,076 affiliations. We used the VOS viewer software to create the mapping data and PRISMA. The data obtained are presented through network visualization and density visualization through bibliometric analysis.
The bibliographic analysis provides valuable insights into the research of social commerce. Research on the subject began in 1995. Since 2013, the number of articles published on various channels indicated a sharp and continuous increase. The most important results obtained after the analysis are summarized (1) It is seen that the most publications and citations by year were made in 2022. (2) The most used keyword is “social commerce,” used 395 times. Cui et al. (2018) obtained it as “group buying” and Hai et al. (2020) detected as “mobile commerce.” “Trust” is the second, and “social media” is the third. (3) The country with the most significant number of publications on social commerce is the Peoples Republic of China, with 351 publications. The USA is second with 197 publications, and Taiwan is third with 81 publications. Besides, the most cited country is the Peoples Republic of China, with 10,576 citations. The USA follows the Peoples Republic of China with 9,221 citations and England with 3,535 citations. Cui et al. (2018) found the most productive countries were China, USA and then Taiwan, respectively. (4) The most cited publication is Hamari et al. (2016), with 1,569 citations in the Journal of the Association for Information Science and Technology. (5) The most cited journal is Computers in Human Behavior, with 2254 citations. While C. X. Li et al. (2018) have taken the number of publications, we considered the number of citations. Even so, Computers in Human Behavior was found to be the most active journal. (6) The most published articles are in the Business category, with 363 articles. (7) The most cited affiliation is Swansea University, with 25 articles. But, the most cited affiliation is the City University of Hong Kong, with 1,665 citations. As C. X. Li et al. (2018), we found that the most efficient affiliations were in the Peoples Republic of China and the same cluster.
This study is expected to provide various contributions and guides to researchers and related literature. Researchers who will work on social commerce can have an idea about the current literature based on this study and can design their studies within this framework. In addition, researchers can direct their studies by obtaining information about the methods used in published articles on social commerce.
Limitations
The study has some limitations. The most important limitation is the review of articles indexed by SSCI, SCI-Expanded, ESCI, and A&HCI and accessed through the Web of Science database. The analysis is based on the keywords “social commerce,” “social e-commerce,” “s-commerce,” “social electronic commerce,” “Facebook commerce,” “Instagram commerce” and “social media commerce.”
Future Research Directions
It is expected that the number of studies on social commerce will increase. This means that the ranking of countries, affiliations, authors and journals in this study may change after a few years. In future studies, in addition to the articles with these indexes, other accessible articles, books, chapters in books or papers presented in scientific meetings can be included in the scope of the review. Social commerce can be subjected to bibliometric analysis with different keywords that may correlate. Bibliometric analysis can be applied to SCOPUS, EBSCOHost, and JSTOR. The authors suggest that future studies can be visualized with different software programs such as Rstudio, Vivo, Gephi, CitNetExplorer, Bibeexcel, Ucinet, Pajek, Vantage Point, Scimat.
Footnotes
Declaration of Conflicting Interests
The author(s) declared no potential conflicts of interest with respect to the research, authorship, and/or publication of this article.
Funding
The author(s) received no financial support for the research, authorship, and/or publication of this article.
Ethics Statement
We testify that our article submitted to Sage Open has not published in whole or part in elsewhere and all authors have been personally and actively involved in substantive work leading to the manuscript and will hold themselves jointly and individually responsible for its content.
Data Availability Statement
The dataset generated during and/or analyzed during the current study are available from the corresponding author on reasonable request.