
Abstract
The main aims of the present research were to: (1) describe the scientific outputs indexed in the Scopus and Web of Science databases, from now on WoS, regarding the use of comic books as didactic resources in the teaching-learning of the sciences, and; (2) establish the conceptual structure of scientific output regarding the use of comic books as didactic resources in the teaching-learning of science. A quantitative-bibliometric methodology was followed on a sample of 60 scientific documents recovered using the Preferred Reporting Items for Systematic Reviews and Meta-Analyses strategy, from now on PRISMA. Findings suggest that the topic is still emerging given the novelty of the discipline and that published studies tend to be low impact in terms of the number of citations they receive. With regards to the conceptual structure, the most relevant themes and trends to emerge pertained to medical education, comic books and illustrations, and the use of mobile devices. Finally, analysis of the keywords used by the top 20 most relevant authors, it was possible to infer a degree of correspondence between sources, keywords and the continents responsible for the greatest scientific output on the topic.
Plain language summary
The main objective of the present work has been to review the scientific production on science teaching-learning during a decade (2011-2020). The methodology used is based on a bibliometric study. Findings suggest that the topic is still emerging given the novelty of the discipline and that published studies tend to be low impact in terms of the number of citations they receive. The most relevant themes and trends to emerge pertained to medical education, comic books and illustrations, and the use of mobile devices. Finally, analysis of the keywords used by the top 20 most relevant authors, it was possible to infer a degree of correspondence between sources, keywords and the continents responsible for the greatest scientific output on the topic. One of the main obstacles or limitations of the present research is inherent to bibliometric studies based on scientific papers gathered from different research databases and pertains to the lack of uniformity of databases when indexing keywords and, mainly, when distinguishing between author keywords and keywords plus.
Introduction
In general, learning processes in science subjects such as Mathematics, Physics and Chemistry require a greater degree of concentration, attention and engagement on behalf of students (Bain et al., 2019; Fishman et al., 2021; Flores-Garcia et al., 2015; Tsaparlis, 2016; Utha et al., 2023), leading to them being perceived as “difficult” and “hard” subjects. In this respect, Avraamidou and Osborne (2009) argue that rejection toward science subjects can largely be attributed to the nature of the highly specific language (scientific jargon) inherent to science itself. In fact, this can be seen in the case of other disciplines that comprise Mathematics, such as Statistics, with Dillon (1982) coining the term “statisticophobia” to describe the fear felt by students undertaking disciplines, for example, Psychology, with a high statistical content.
In this context, as highlighted by Halliday and Martin (1993), grammar used in science has historically evolved to provide more effective and efficient communication within the scientific community, however, such communication has not evolved to assist wider dissemination, further isolating it from the rest of society. It is, therefore, not unusual that acquiring this specific language requires a long and arduous learning process. This appears a little known aspect and, yet, as early as the 17th century Galileo Galilei was already bringing science to a non-expert audience. Galileo did this through the publication of “Dialogue Concerning the Two Chiefs World Systems.” This volume, in contrast to the others being written in Latin at the time, was written in the common Italian language. Moreover, it took the form of a dialogue, in which questions were posed and responded to. This demonstrates a clear intention of informing a non-expert public.
However, despite the difficulty that learning in science subjects entails, in recent decades, many countries, including emerging countries, have improved their economic settings with the support of the Science, Technology, Engineering, Arts and Mathematics pedagogical approach (Mejias et al., 2021; Miralimovna, 2023; Perales & Aróstegui, 2021), from now on STEAM. This is evidenced by the fact that a large amount of research related to the STEAM approach has been conducted over recent years. Some such studies (e.g., Baek & Yoon, 2016; Bahri et al., 2017; Bati et al., 2018) have focused on the design and implementation of steam projects. In contrast, research conducted by Fulton and Simpson-Steele (2016) and Samarakoon and Smith (2016) focused on describing STEAM educational experiences, whilst other research (Kim & Kim, 2016; Ortega-Rodríguez, 2022; Park et al., 2016) has focused on student and teacher perceptions of STEAM.
As a result of these successful outcomes, many countries are striving to achieve greater involvement of the general population in scientific matters and are working to create a quality scientific culture throughout the education system at both primary and secondary levels. This approach has a clear educational focus that is technical-scientific and artistic in nature. Against this backdrop, new competences have been proposed for students that involve problem solving, critical thinking, creativity, judgement and the ability to make decisions (Davies et al., 2011) within an integrative and transversal context. In short, the STEAM model proposes a type of project-based learning, which is fundamentally practical in nature and in which collaborative work is conducted in appropriate physical settings (makerspaces) (Oliver, 2016). All of these aspects (related to the STEAM integrated approach) must be considered, especially if traditional science teaching and learning methods are to be replaced. Moreover, in recent years, student interest in science in Europe seems to have declined significantly (Crăciun et al., 2016). According to Crăciun and Bunoiu (2019), this is due to the fact that many students consider science to be abstract and lacking a basis in reality, especially, when teachers employ “boring” traditional teaching methods.
In this sense, according to several authors, including Bennett and Maton (2010), today’s learners do indeed use different learning methods to those used by older generations. Moreover, they acquire digital skills through various tools, including virtual, image-rich settings. For this reason, it is necessary to adapt to changes in society and accept the fact that the ability to convey information through images, for example, through visual thinking strategies (Albert et al.,2022; Aspden et al., 2022; Kelly-Hedrick et al., 2022), has become fundamental in recent years (Duncan et al., 2015). In this context, a number of researchers support the use of scientific comic books as a teaching-learning aid in the form of sequential and narrative art capable of conveying scientific messages to students through images in a more enjoyable and effective manner (Collver & Weitkamp, 2018; Tatalovic, 2009).
Literature Review
According to some studies, for example that of Kivunja (2014), digital natives are passionate about stories that can be shared on social networks and are, therefore, short. In fact, many children brought up in the digital era have serious difficulties in dealing with long texts. Recent studies show that, from a learning perspective, there are no major differences between textbooks and comic books but comic books have the potential to develop interest and enjoyment in science learning (Grande-de-Prado, 2022; Hudoshnyk & Krupskyi, 2022; Lin et al., 2015). Trnova et al. (2018) have summarized a number of other advantages to using comic books in science teaching-learning, namely, enhanced motivation, concise texts, meaningful context, visualization of the issue, identification and elimination of mystifications, and a multidisciplinary approach.
Comics are considered a popular art form and, therefore, provide a potential medium for educational and scientific communication. Some evidence suggests that comics can be used efficiently to promote scientific literacy through education and the effective and simple communication of complex scientific topics. This has led to inception of the so-called genre of “science comics” (Srivastava, 2019; Tatalovic, 2009). Out of this, Scientoons was conceived, creating cartoons based on science that provide data and information about new trends in research, topics of interest and concepts in a simple, understandable and more interesting way, as a means to promoting thinking and reflection in a fun way (Ray & Dutta, 2009; Srivastava, 2011, 2018, 2019). Based on this, Scientoonics has emerged as a new branch of science that deals with effective scientific communication through the use of a new kind of scientific cartoons to learn about and enjoy science (Srivastava, 2019). Such cartoons are mainly based on scientific ideas and concepts, new discoveries, and scientific findings and their applications. An array of research from different scientific areas attest to the potential of this tool, such as in nanotechnology (Nath, 2018), bionics in the area of natural sciences (Srivastava, 2016), chemistry teaching (Balasubramanian, 2005) and educational sciences (Trnova et al., 2013).
From the conclusions derived from various survey studies conducted at educational institutions, it can be stated that teachers perceive comic books to add a creative and emotional dimension to lessons, whilst also helping to humanize science, making it more accessible to students, regardless of ability and predisposition towards science (Farinella, 2018; Khalid et al., 2010). As early as 1994, Scott Mc Cloud published the bestseller “Understanding Comics,” in which he suggested that the ensemble of images and storytelling together had a communicative effect that was greater than the sum of its parts… Indeed, numerous studies in secondary and higher education contexts confirm that comic books represent an excellent medium for classroom learning
A similar thread through the majority of previously conducted research on the topic is that, whilst comic books and textbooks have similar outcomes from a knowledge acquisition perspective, this is not the case from the point of view of motivation. It has also been revealed that comic books have an excellent ability to capture attention, especially that of casual readers or students with lower prerequisites. Additionally, comic books have several other advantages, among which the emotional attachment instilled in the reader in relation to the protagonist stands out as easing the consolidation of imparted information (Farinella, 2018; Symons & Johnson, 1997).
According to Kats (2003), storytelling has a bad reputation in the scientific field. Existing literature on the topic was examined in an effort to shed light on the reasons behind this assertion. Dahlstrom (2014) justifies the poor image of storytelling through the fact that scientific information is mainly the result of deductive reasoning, whilst storytelling largely relies on inductive discourse. Further, Klein (2006) highlights the big gap between everyday narrative dialogue and scientific arguments. However, they suggest that the door is open to the possibility of also using narrative techniques in the field of science.
In fact, it seems that activities that combine words and writing provide the best and most appropriate means through which science teaching-learning processes can be implemented. Growing openness to the use of storytelling in science also comes from studies carried out in the field of formal education. In this vein, data from such studies show that stimulating teaching materials, such as comic books, are capable of teaching concepts and promoting critical thinking, consequently, increasing interest in science at different levels, regardless of the level of depth (Amaral et al., 2015). In a similar sense, Avraamidou and Osborne (2009) have also argued in favor of the use of storytelling didactic techniques, claiming that this type of competence allows teachers to combine elements of the curriculum with narrative, adapting content to the context of the classroom and its didactic objectives. Thus, several studies are found to demonstrate the effectiveness of comic book use in didactics, especially in the teaching-learning of science. Despite this, it seems that not all that glitters is gold.
A number of problematic aspects of less “formal” science popularization must also be considered. An example of one such issue is the fact that, whilst comic books may provide an effective means to popularizing science, research conducted by Crăciun and Bunoiu (2019) shows that interest in them, at least among children, wanes with increasing age and education level. In a similar vein, Farinella (2018), who has conducted several experiments in schools on science popularization through comic books, argues that, despite plenty of evidence of good outcomes, the quality of comic books and the type of sample on which studies have been carried out are too variable to draw valid general conclusions.
Another aspect that should not be underestimated is that the outcomes of studies conducted by some authors in student classrooms up until now are not statistically reliable. This is because most existing research refers to stories made by the same teachers conducting the research making it impossible to guarantee objectivity
Research Objectives
The objectives guiding the present research are as follows:
Describe the scientific outputs published between 2011 and 2020 and indexed in the SCOPUS and WoS databases regarding the use of comic books as didactic resources in the teaching-learning of science. Output will be characterized according to the following bibliometric fields: published source, author affiliations, author prolificacy and country of origin.
Establish the conceptual structure of scientific outputs on the use of comic books as didactic resources in the teaching-learning of science through co-occurrence analysis, thematic maps and multiple correspondence analysis pertaining to the bibliometric fields considered by the most prolific authors.
Materials and Methods
For the analysis of the data, the sources of information, the scientific documents retrieved, the countries of production of the manuscripts and the keywords of the scientific articles have been considered. In this sense, it can be stated that, methodologically, this is a longitudinal study of trends. It addresses the evolution and development of topics of great interest related to the use of comics as a didactic resource in the teaching-learning of science during the decade from 2011 to 2020.
Variables
Considered study variables pertain to typically bibliometric fields or parameters that constitute the way in which scientific outputs are structured in the examined databases, namely, author name/s, source, affiliation/s, countries and keywords (keywords plus and author keywords).
Data Collection
Articles under examination in the present research were gathered from WoS and SCOPUS databases. Articles described different types of research work: articles, conference proceedings, etc. All included materials were similar in the sense that that they addressed scientific dissemination (excluding Arts and Humanities, Social Sciences, Psychology and Economics) through the use of comic books. The literature search was set to examine “titles” for inclusion of the search terms “comics*” and “science” together with the Boolean operator “and.” In terms of the time interval chosen for examination, articles published between 2011 and 2020 were considered for inclusion. The first search resulted in the identification of 320 articles in WoS and 522 in SCOPUS. On further examination it emerged that the majority of selected articles were not very closely related to the topic chosen as the object of study. For this reason, it was proceeded to search for categories related to the fields of science under study, with 17/99 categories being selected in WoS and 15/25 being selected in SCOPUS. The search yielded 120 results for WoS and 400 for SCOPUS. Finally, the abstracts of all of the identified papers were analyzed in order to confirm that the subject matter was closely linked to the popularization of science through comic books. Finally, 60 papers in WoS and 65 in SCOPUS were selected, which, following the elimination of duplicates, resulted in a final sample of 60 papers. The overall article selection and refinement process is depicted in the flowchart presented below. Although the present research cannot be classified as a systematic review or meta-analysis, it was deemed appropriate to follow the PRISMA approach (Anguera, 2023) (Figure 1).
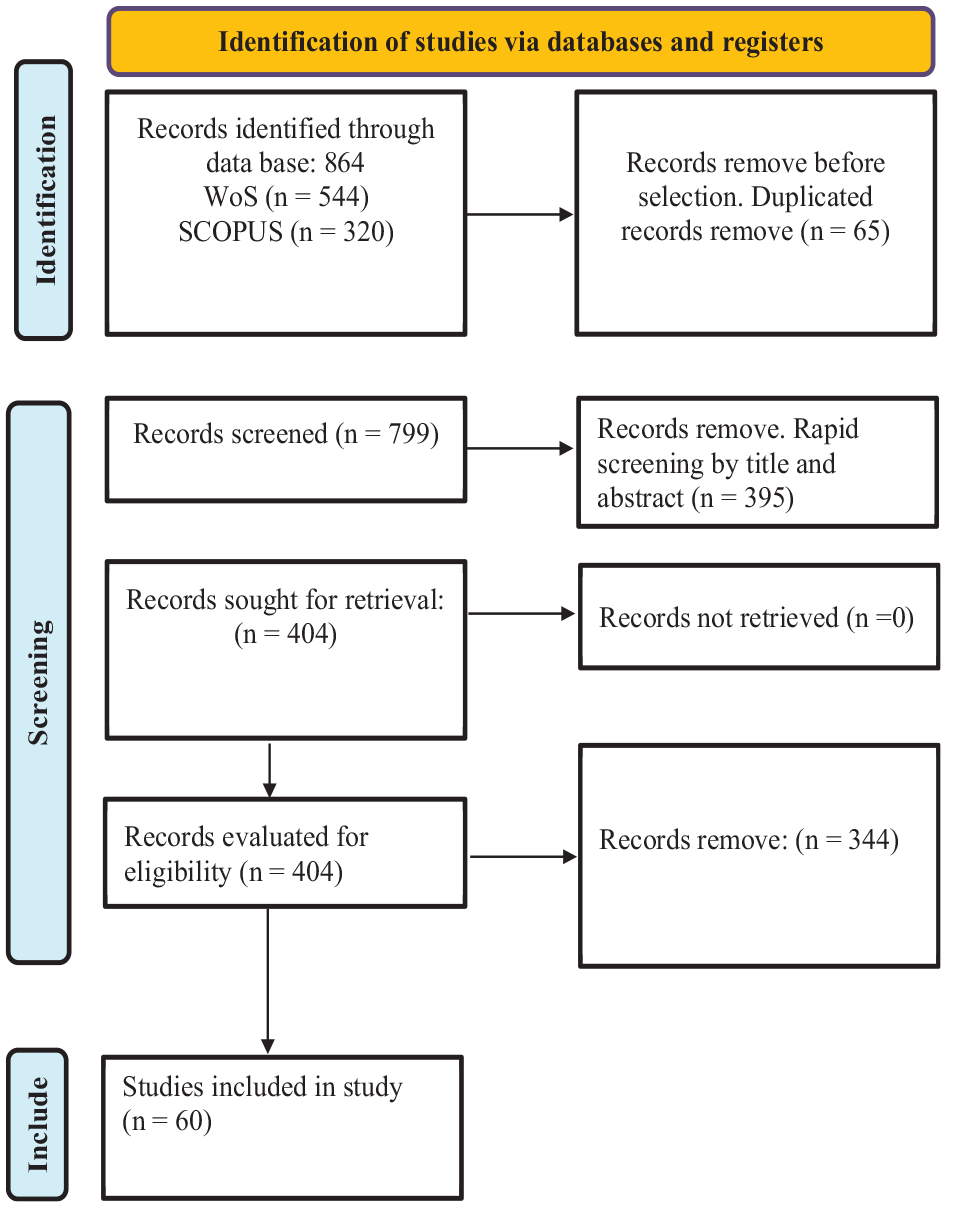
PRISMA flow diagram of bibliometric study.
Data Analysis
The Biblioshiny interface of RStudio v.4.0.4 (Aria & Cuccurullo, 2017) and VOSviewer v.1.6.16 (Van Eck and Waltman, 2010), alongside the data visualization tool Flourish (2022), were used for the construction and visualization of graphs, network maps and thematic maps. Finally, multiple correspondence analysis was performed using SPSS v.28 (IBM Corporation, 2021). The main results obtained are presented below.
Description of Main Data
The following figure (Figure 2) details the main descriptive data relating to the sample of 60 scientific documents recovered for examination. This information is made up of the year of publication, sources of origin, author names, etc.

Description of main data.
Characterization of Selected Scientific Outputs
Scientific Production
The following figure (Figure 3) shows a graph of annual scientific growth covering the timespan from 2011 to 2020.
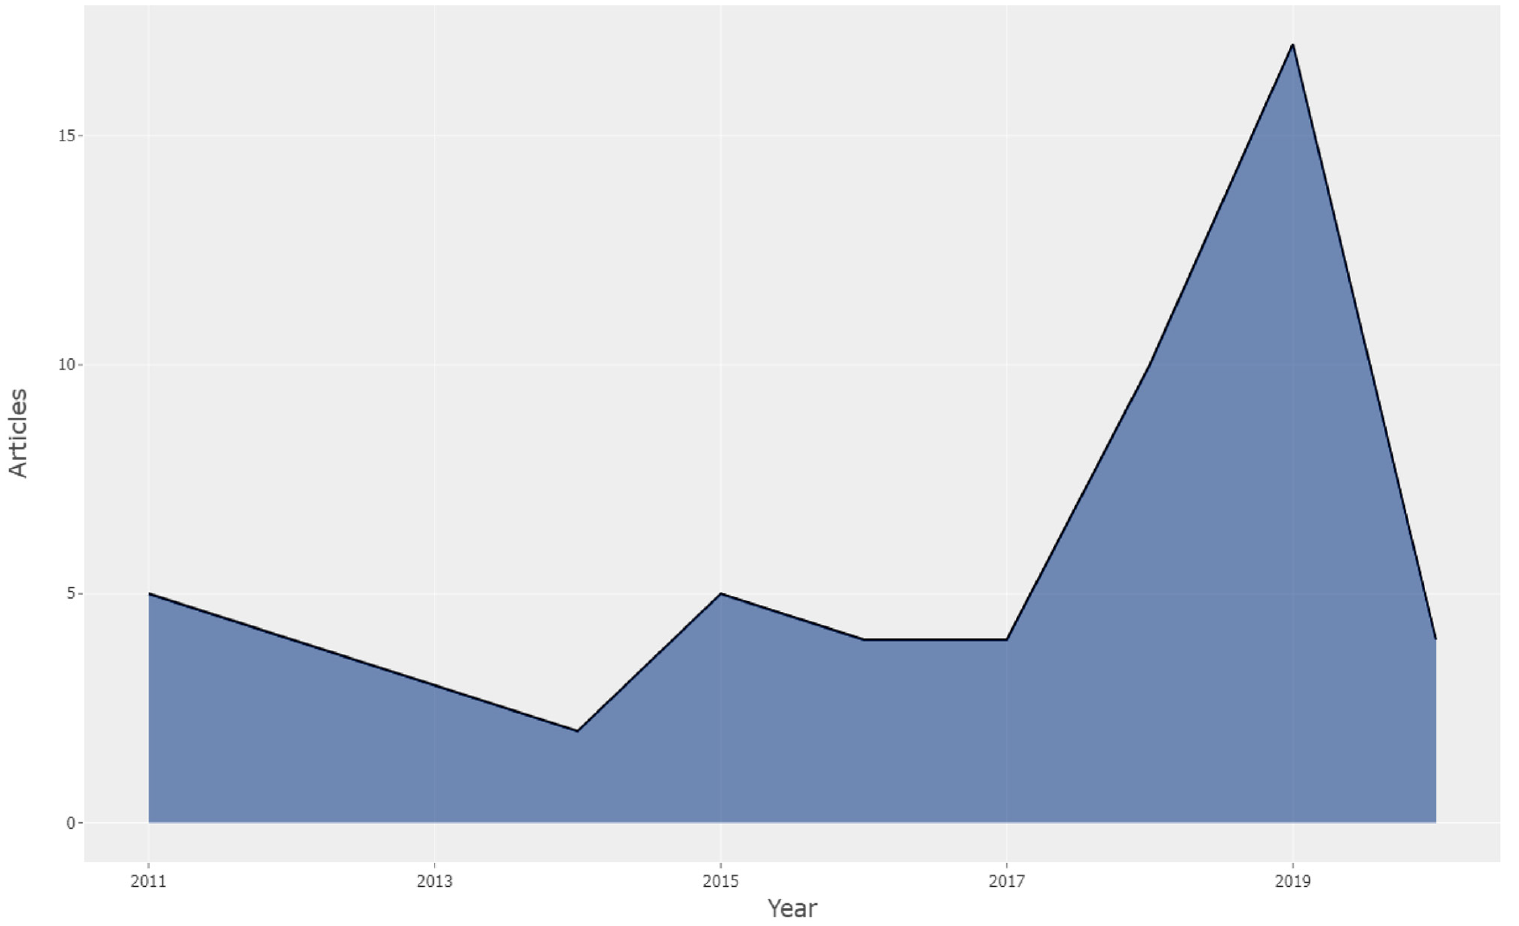
Annual scientific output.
As can be seen in the above figure and in line with Price’s (1973) Logistic Model of Scientific Growth, a constant level of scientific output on the popularization of science through comic books was maintained between 2011 and 2017, with no major peaks or troughs in production. However, the year 2018 shows a marked increase in production with 10 manuscripts being published, with this being followed by a level of production, in 2019, that could be considered more exponential when comparing the 17 manuscripts published that year with the lower outputs of all other examined years. Output then decreased back to pre-2018 levels in 2020, with four scientific documents being published, in line with the trend seen for the majority of the years examined (Table 1).
Number of Outputs Per Year.

Source Clustering
The present section identifies the main sources of scientific publications. In order to synthesize the gathered information, Bradford’s Law of the Dispersion of Scientific Literature (Huang & Ho, 2011; Pulgarín & Gil-Leiva, 2004; Tortosa & Civera, 2002) was considered. This explains the way in which scientific outputs tend to be unevenly distributed, with a small percentage of documents being distributed over a large number of journals meaning that the majority of documents were retrieved from just a small sample of journals or other information sources (Desai et al., 2018; Urbizagástegui Alvarado, 1996, 2016). Bradford’s Law contemplates up to three different zones of literature distribution. Nonetheless, in the present case, data will only be presented that corresponds to zone 1 and deals with the main information sources.
In view of the data presented in Figure 4 and Table 2, it can be seen that an important part of scientific production, specifically 20 documents that represent 33.33% of the sample, is distributed among 10 different sources. Of these, five are academic journals and another five are international conference proceedings. All of these sources of information are distributed in Bradford’s zone 1. This means that, during the time interval studied, these sources were the most commonly chosen by authors when publishing scientific work on the topic of the popularization of science through comic books. Potentially the most striking finding is that, after scientific journals, the second main source used to disseminate and publish work on this topic are international conferences, with a total of up to 14 different outputs (Figure 1).

Bradford’s Law applied to the dispersion of articles gathered in the present study between main information sources.
Scattered Sources in Bradford Zone 1 and Total Citations.

Another important aspect to consider is the impact of publications, that is, the number of citations received for work published in the chosen information sources. In this sense, works pertaining to four of the five journals identified had at least one citation, whilst work from only one of the five international conferences identified had received a citation. This work had four citations and belonged to the 13th International Educational Technology Conference. Here, the relevance and repercussions of academic journals on the scientific community can be seen both in terms of being the main source of publication of scientific work overall, in addition to leading the way when it comes to publishing and disseminating documents that are of special interest. Of the most important journals to emerge, Anatomical Sciences Education and JCOM-Journal of Science Communication stand out with 48 and 23 citations, respectively. However, two other academic journals also stand out which lead the way in terms of citations. Namely, the journal CBE-Life Sciences Education produced the most citations with 53, followed by the journal Research in Science Education with 38 citations. Despite this, the latter journal is not found in Bradford’s zone 1 due to its overall output.
Production and Collaboration Between Countries
In terms of countries, the most productive countries in terms of their scientific output on this topic were examined (Table 3), alongside outputs arising from collaborations between the most productive countries (Figure 5 and Tables 3 and 4).

Country collaboration map.
Output According to Country.

Number of Collaborations Between Countries.
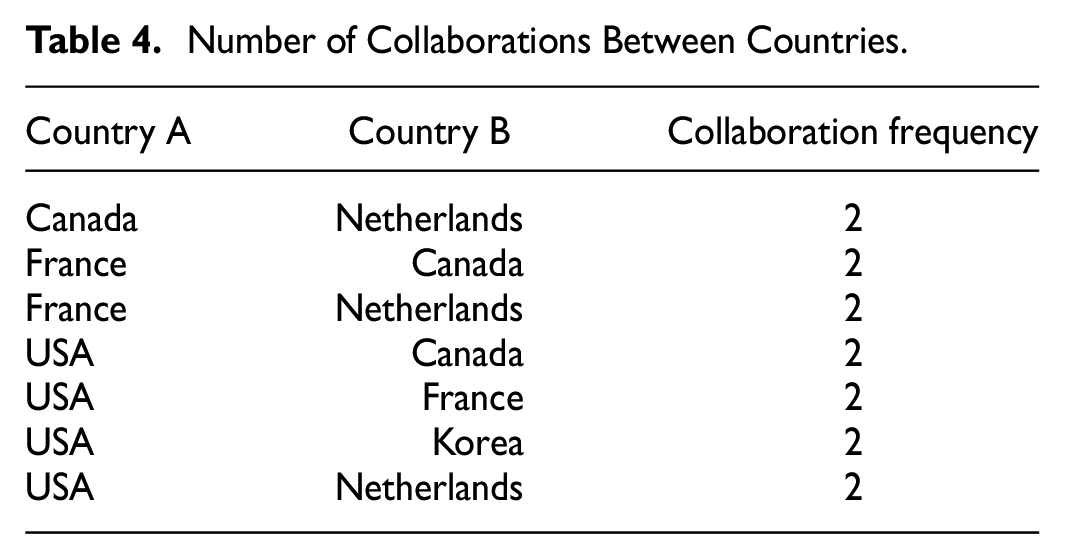
The USA is the most productive country, being involved in 25 of the 60 documents studied. In addition, the USA was the country found to most collaborate with other countries from different continents. Generally speaking, the level of collaboration was not found to be particularly high, as the maximum number of collaborations found between countries was just 2. Indeed, 40 of the 47 collaborations identified were found to be only occasional collaborations, with partners only collaborating on a single occasion.
Conceptual Structure
Examination of conceptual structure was based on the concept of the co-occurrence of the key terms used to describe the content of documents in a dataset (Belfiore et al., 2022; Callon et al., 1991). Conceptual structure is a term that is increasingly being explored in current bibliometric works (Author et al., 2020; Naeini et al., 2022; Nasir et al., 2020; Rodríguez-Sabiote, 2020; Wang et al., 2022), as it is capable of defining the main themes that may be considered trends in scientific production (Rodríguez-Sabiote et al., 2022).
Analysis of Co-occurrence Pertaining to the Conceptual Structure
In order to generate a co-occurrence map, a minimum threshold of two occurrences per keyword was established. Out of a total of 239 keywords (176 author keywords and 63 keywords plus), 35 keywords reach this threshold. For each of the 35 keywords, the overall strength of co-occurrence with other keywords was calculated using the association method. Outcomes were interpreted based on graph theory. This is a mathematical discipline that studies the relationships between pairs of objects by generating a graph. The network map shown below (Figure 6) is based on a multigraph made up of edges that link two vertices symmetrically. Table 5 presents all of the keywords used to make up the network map presented in Figure 4. From this, occurrence values, overall link strength and the cluster to which keywords belong within the network map can be seen.

Network map of co-occurrence of all keywords.
Occurrence Between the Most Relevant Keywords and Overall Link Strength.
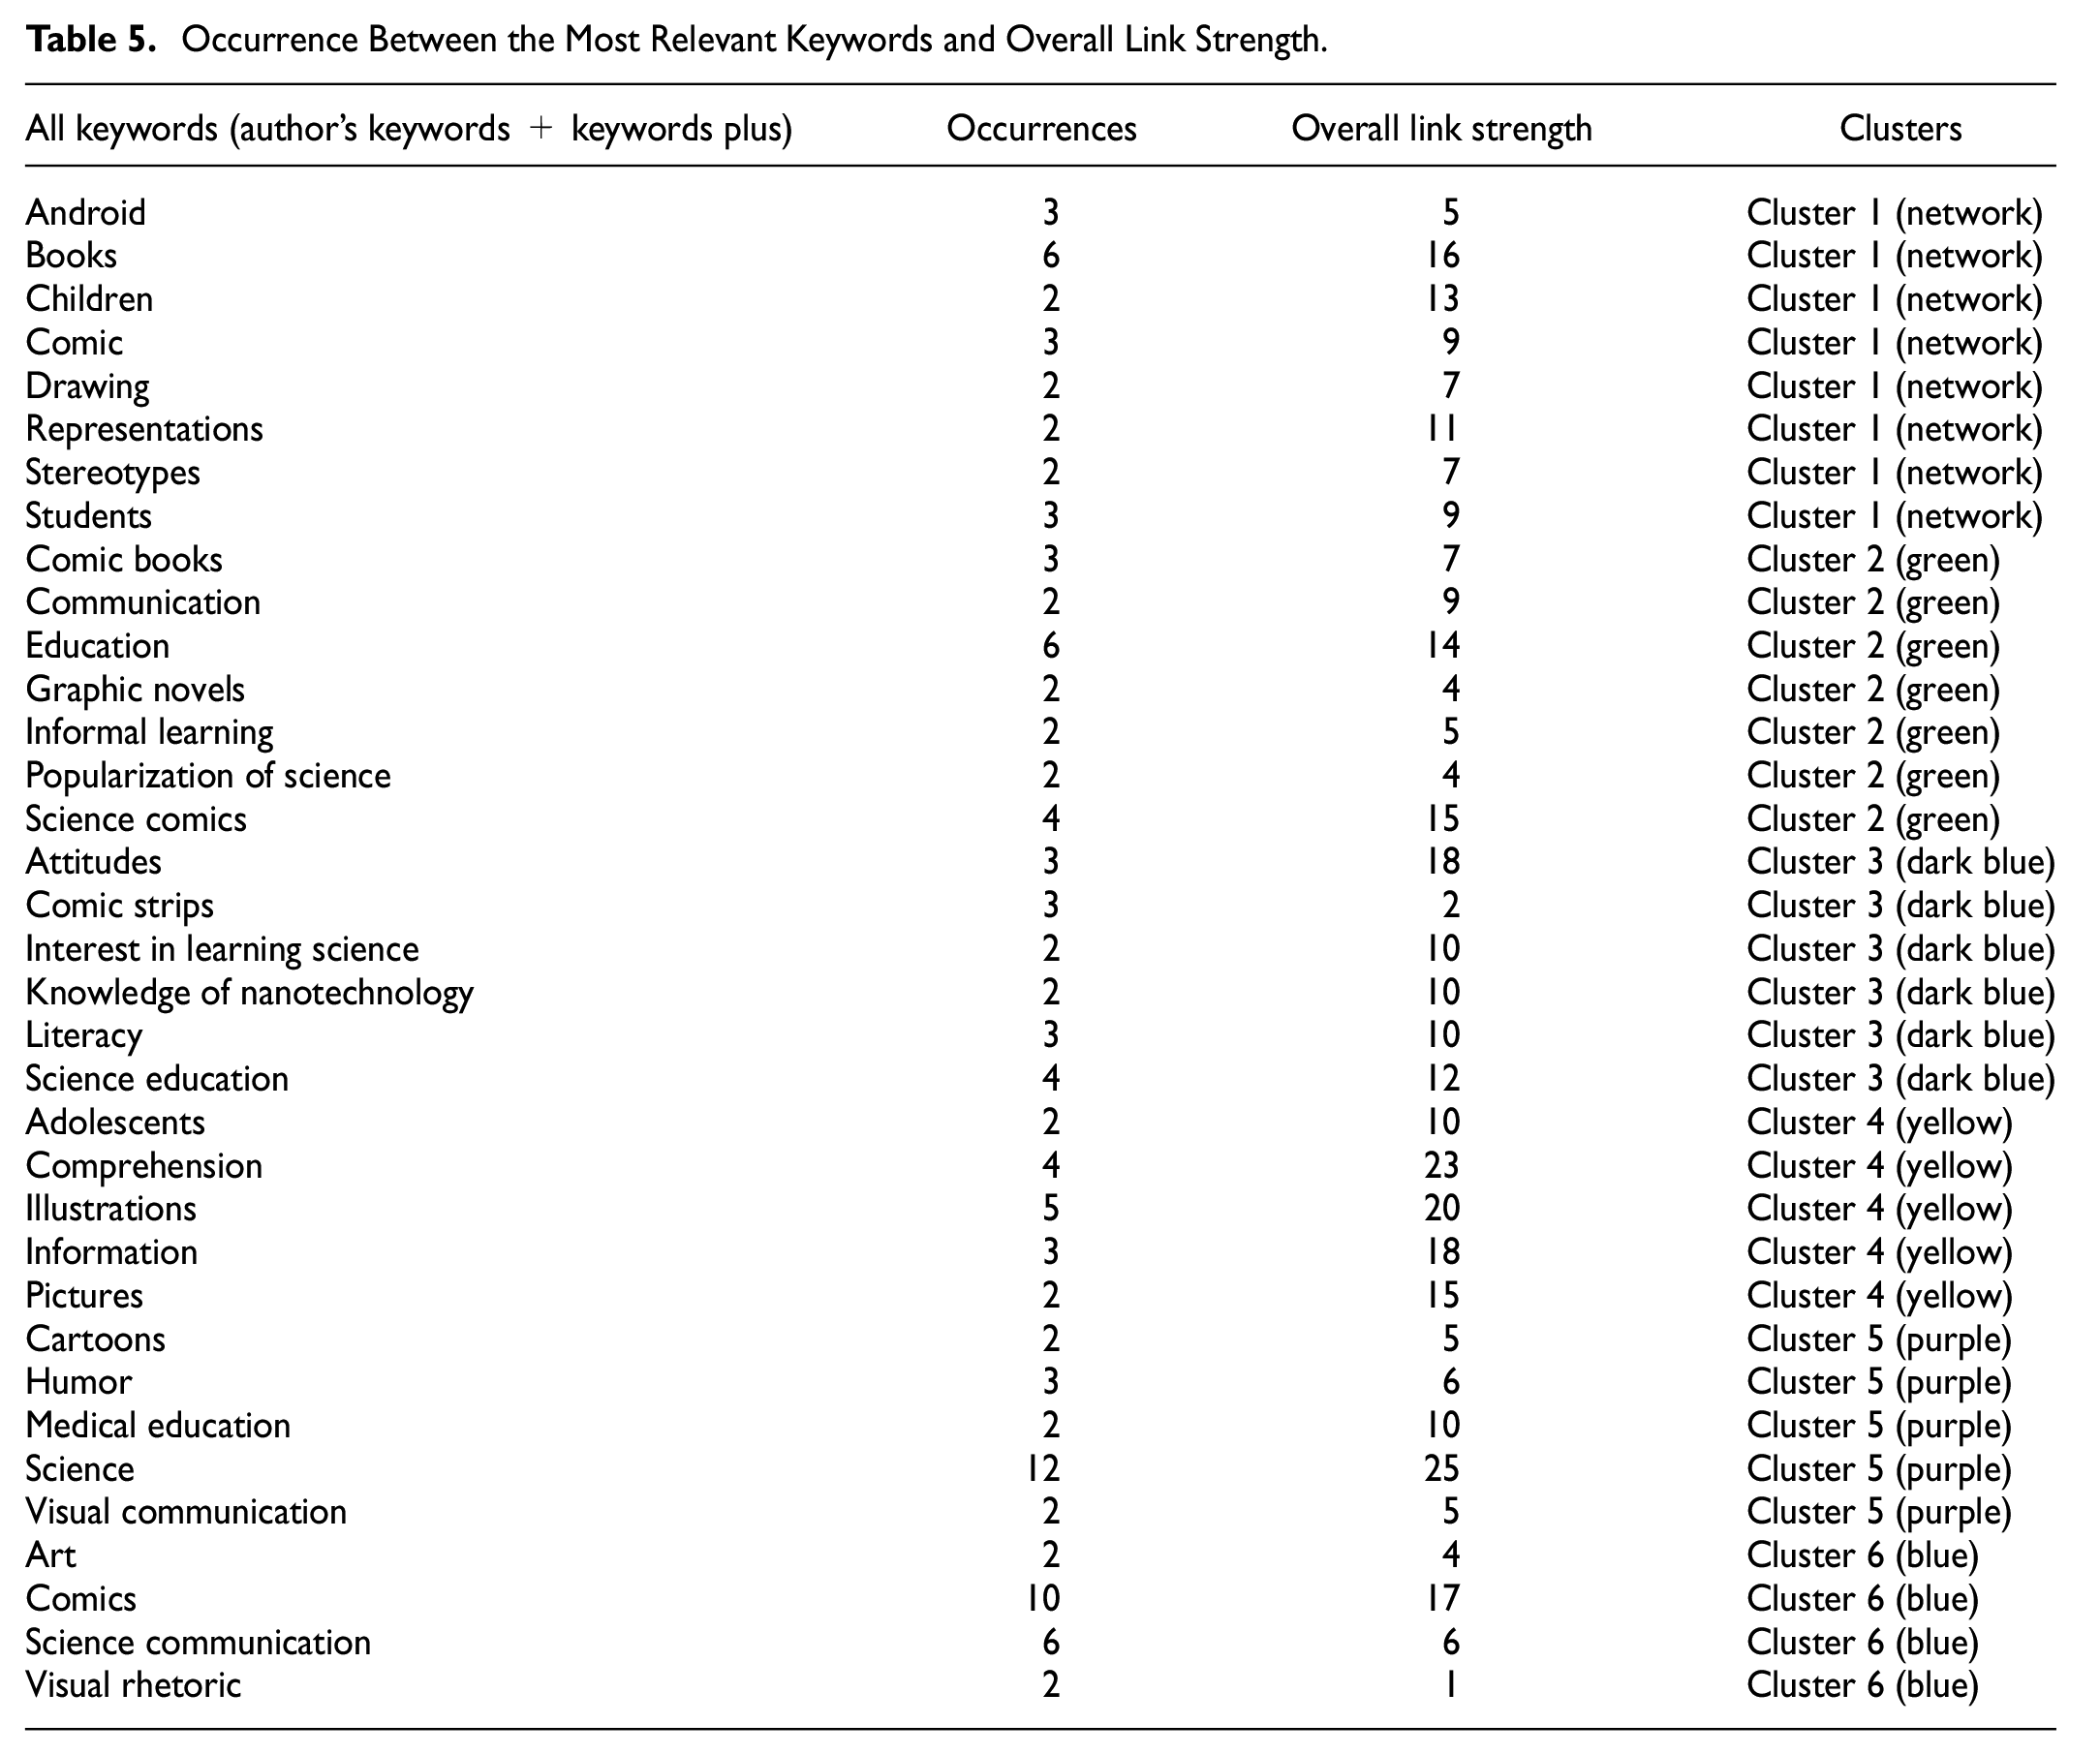
As can be seen in the table and figure above, the 35 keywords found to reach the minimum threshold of two occurrences, form a network map with up to six different clusters. In the map, the size of both nodes and labels corresponds proportionally to the number of occurrences of identified keywords. In a similar sense, the thickness of lines used to depict links between two or more keywords indicates the overall strength of links, with thicker lines indicating a stronger link. In this way, each node represents a keyword and, in turn, this is interpreted as an important topic within the general theme of science popularization through comic books. Thus, the topics science, comics, science communication, books, education, and illustration stand out due to the greater occurrence values they produced, specifically, 12, 10, 6, 6, 6, 6, 6, and 5, respectively. No high occurrence values emerged in relation to any keywords from any other topic. However, it is interesting to note that high occurrence values for some keywords did not always correspond to high link strength values. Whilst the topic science produced both the highest occurrence value (12) and the greatest link strength (25), the same was not seen in the case of the topic comics, which, despite having the second highest occurrence value (10) had a link strength that was weaker (17) that that found for a number of other topics, such as attitudes, information, illustration, comprehension, and science itself. In fact, the topic comprehension presents the second highest score for overall link strength (23) despite being one of the topics with the lowest occurrence values (4).
Following examination of the strongest links, it was possible to identify relationships between topics that marked thematic trends or the main lines of research to stoke greater scientific interest. In this sense, main topics were established in order to mark central tendencies, with the topics of education and science emerging as central axes from which other focuses of interest or specific issues were addressed. This was also the case with the topics of science, medical education and humor, which, together with education, highlighted a research interest in science and, more specifically, in aspects related to medical education. Further, the term humor emerged as a means of approaching certain medical studies or actions targeted towards patients, in which one of the tools used was comic books or cartoons. Indeed, these tools belonged to the same cluster (purple cluster). Another focus of interest pertained to the topics of comic books and science communication (blue cluster) as an alternative to scientific communication or the dissemination of data and information using comic books as a source of information. In a similar sense, the yellow cluster highlights other targets of research focus in this area, comprising the topics of information, illustration, pictures, adolescents, and comprehension. The nature of these terms and all of those belonging to the yellow cluster point to a more general research frontier focused on the dissemination of information using drawings and illustrations, which are aimed mainly at a younger audience (adolescents) seeking a more in-depth understanding of everything related to the scientific world. Finally, the topics of books, android, and comic books were grouped together within the red cluster. In this case, outputs emerge that pertain to research that was partly focused on the study of scientific topics with student groups via comic books and books accessed through mobile devices (android) as a more attractive and motivating alternative to presenting this type of content.
Thematic Map
Next, the main themes to emerge in the present study will be examined by generating thematic maps based on author keywords and keywords plus. Two thematic maps were produced using the same starting parameters but with one map being based on author keywords and the other being based on keywords plus. Maps were produced from a total of three parameters. The first corresponded to the number of keywords considered for analysis, which, in the present case, corresponded to the total number of keywords identified, specifically, 239. The second parameter described the minimum cluster frequency considered per thousand documents, which was 5. The third and final parameter pertained to the number of labels identified per cluster or bubble, with this being set at 1, that is, labels corresponded to the keyword found to occur most often within the cluster.
Bubbles are used within each of the maps to represent a network cluster with labels corresponding to the keyword with the highest occurrence count. The size of each bubble was determined proportionally in line with the number of times keywords making up the cluster were repeated. In addition, cluster locations on the map were determined according to density and centrality measures and the internal or external relationships established with other bubbles or neighboring nodes. Cluster location indicates the level of importance of a specific topic within a given research area (Giannakos et al., 2016), as well as the degree of development of a specific topic (Cobo et al., 2011).
Suggestions made by Cobo et al. (2011; Radu et al., 2021; Zanjirchi et al., 2019) were followed to interpret the thematic maps. This approach requires the four quadrants of the Cartesian axis to be divided into the upper left quadrant, presenting niche themes (quadrant 3), the lower left quadrant, presenting emerging or declining themes (quadrant 4), the upper right quadrant, presenting motor themes (quadrant 1) and the lower right quadrant, presenting basic themes (quadrant 2).
Turning attention towards Figure 7, firstly, it can be observed that no bubbles exist to indicate the presence of a theme that could considered to be niche, that is, themes that are often highly developed or, on the contrary, highly isolated themes. Art is found as a driving theme. This is characterized by zero density as it is made up of a single term that lends its name to the label itself. Another driving theme is science education which also has little density, although it exhibits a meaningful extent of centrality given its greater external connectivity with other bubbles or neighboring nodes. Visual communication emerges as a driving theme characterized by very little centrality and the total absence of density. Nevertheless, it is situated as an emerging theme that is still highly underdeveloped but may indicate future trends and lend itself more to the visual communication of scientific content, in which a main dissemination tool could be comic books, illustrations, drawings, or books. Finally, the bubble with the greatest density pertains to science comic books, highlighting basic or transversal and universal themes in this field of study. This is made up of seven terms and demonstrates meaningful centrality with regards to the other two bubbles. This being said, occurrence values are found to be low and there is a lack of distance between nodes or independent keywords, as all occurrence values range between 2 and 10.

Thematic map of author keywords retrieved from examined documents.
Lastly, Figure 8, which presents outcomes drawn from keywords plus, does not contain any bubbles in quadrants 3 and 4, that is, there is an absence of niche themes or emerging or declining themes. Data obtained from keywords plus is highly concentrated within the science bubble, which demonstrates high centrality and, therefore, high external connectivity, as well as high density due to the greater internal connectivity between included terms. This node contains terms related to the handling of scientific data and information (science, information, communication) and media (books, illustrations, pictures, humor) aimed at young students (adolescents) in an attempt to be more approachable, practical and comprehensive (comprehension). The other two bubbles included on the map refer to the cornerstone of educational research as focusing on improving quality and changing attitudes with clear repercussions for students. Both bubbles have low density, though the student bubble has greater centrality. Here, the topic of literacy can be highlighted as another important element, with literacy in relevant content being crucial for enabling new means of dissemination within the scientific community.
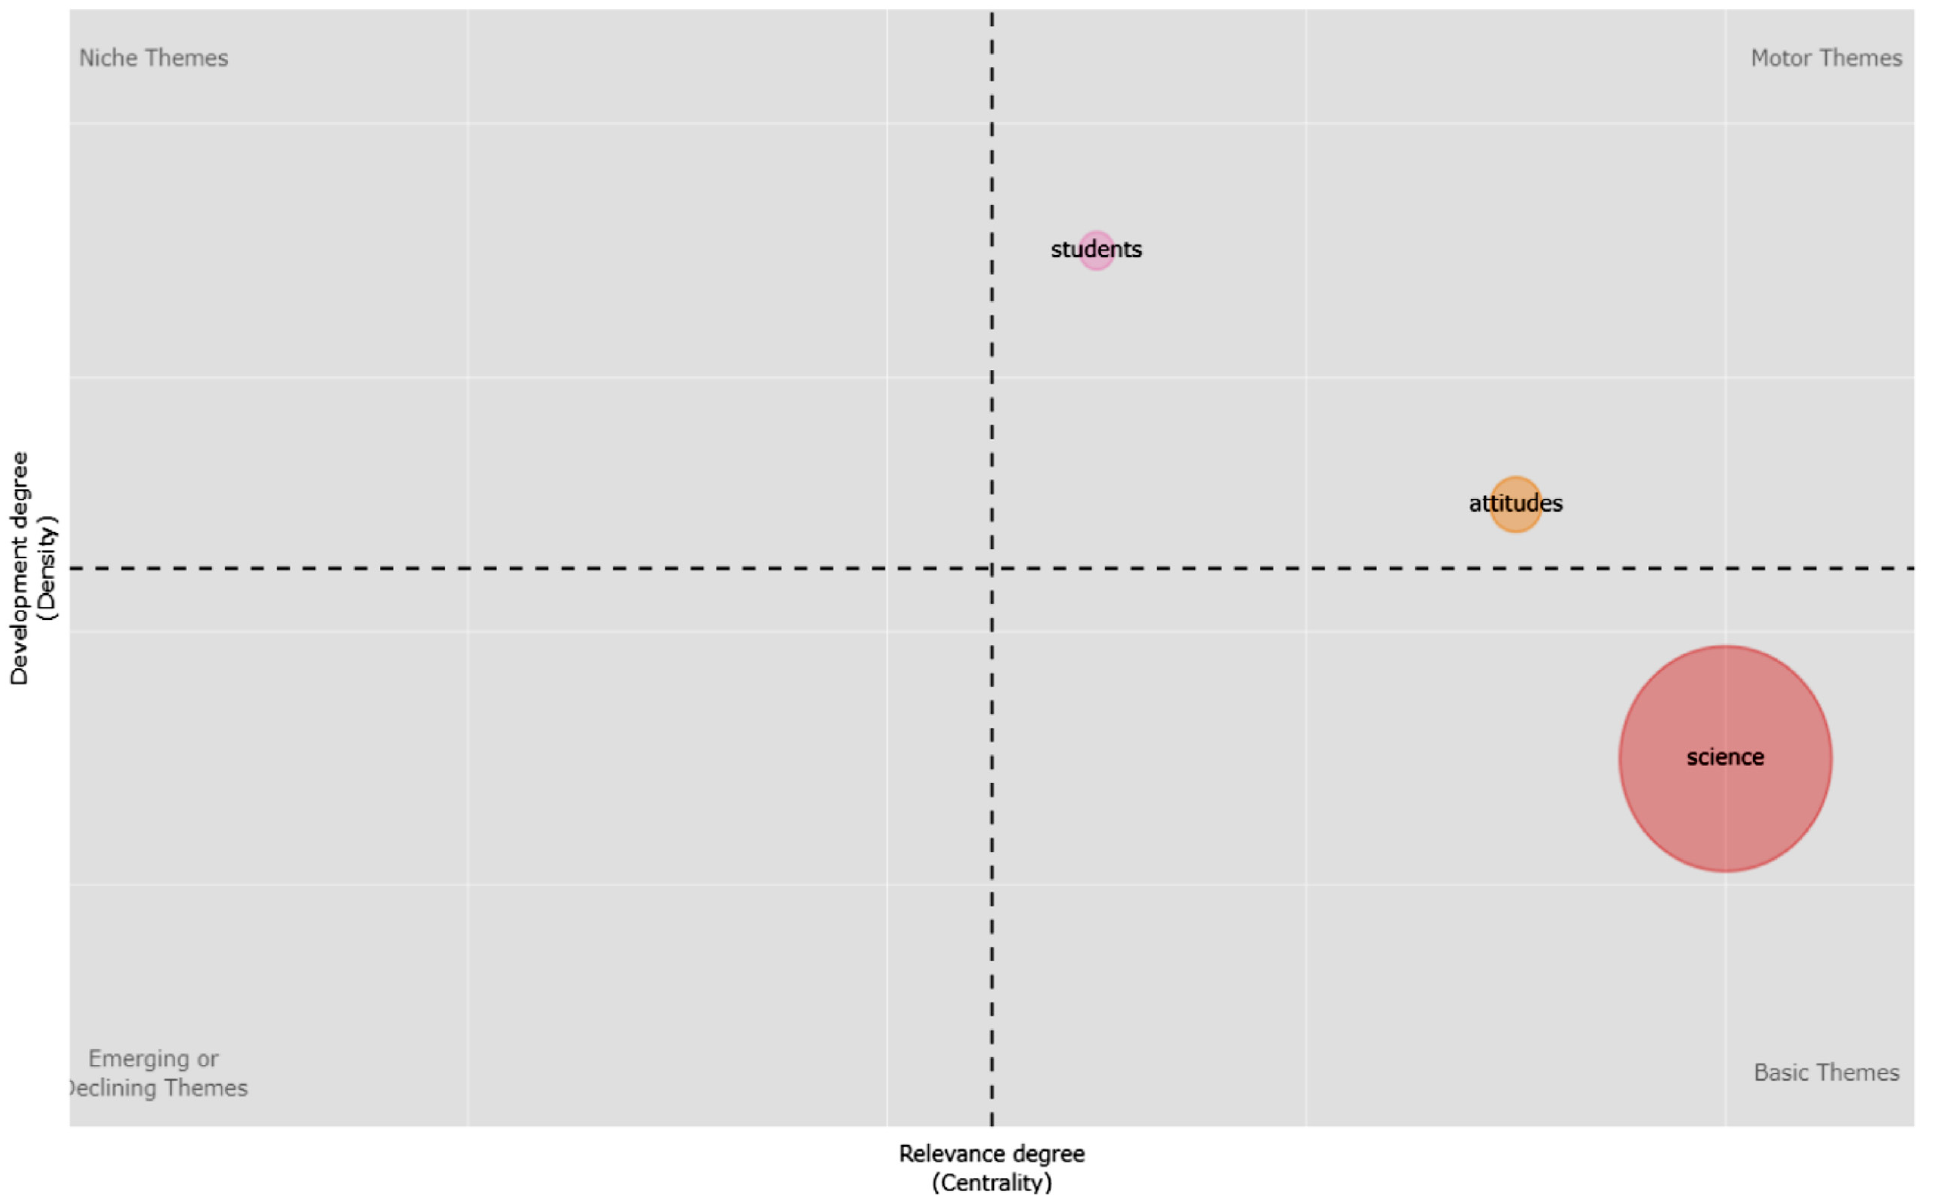
Thematic map of keywords plus retrieved from examined documents.
Multiple Correspondence Analysis
Multiple correspondence analysis was performed using the program Biblioshiny of RStudio v.4.0.4 (Aria & Cuccurullo, 2017). For this, the 20 most prolific authors were selected from the 185 identified to have published on the topic. Publication sources were then determined (distinguishing between journals or scientific events), in addition to the countries in which studies were conducted and the first author’s name. Outcomes pertaining to these parameters are summarized in the figure presented below (Figure 9).

Top 20 authors and corresponding keywords, country of publication and publication source.
From this data, three-field-plots were produced to determine the extent of correspondence between examined fields. Results are presented below (Figure 10).
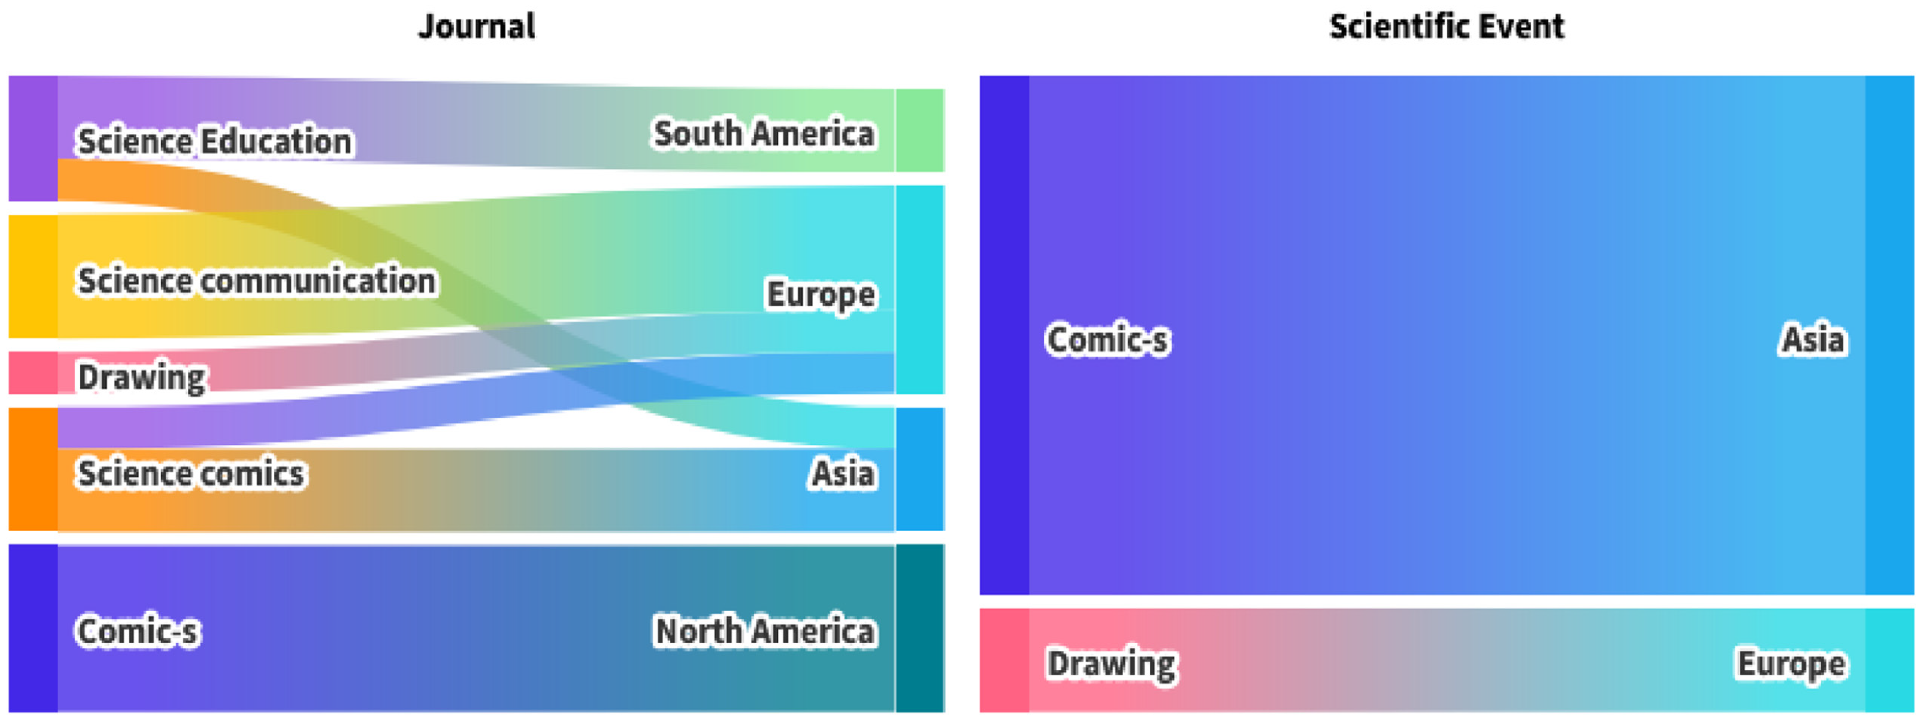
Three field plots (source + keywords + continent).
As can be seen in the figure, a number of well-defined correspondences emerge from the data. Concretely, with regards to authors who have published work on comic books as a resource for the dissemination of science in journals, a clear correspondence emerges between the keywords “Science” and “Science Comics” and work coming from South America and Asia, and just Asia, respectively. On the other hand, the keywords “Science Communication” and “Drawing” are associated with Europe. With regards to information source, two clear correspondences emerged in papers published in scientific events. The first is between the keyword “Comic-s” and Asia, whilst the second is between “Drawing” and Europe. However, in an attempt to empirically confirm the aforementioned correspondences, a multiple correspondence analysis was performed. The main results of this analysis are presented below (Table 6).
Model Summary of the Multiple Correspondence Analysis.

Mean Cronbach’s alpha is based on the mean eigenvalue.
The summary table pertaining to the model is useful for characterizing the weight or importance of the two inferred dimensions. For this purpose, attention is given to the eigenvalues obtained, inertia values and the percentage of explained variance. Thus, it can be seen that dimension 1 contributes most to the model (λ1 = 2.114, inertia = .705, explained variance = 70.47%). Next, dimension 2 obtained a λ2 of 1.884 associated with an inertia of .628 and an explained variance of 62.79%. Cronbach’s α values are used to determine the magnitude of correlations between the empirical variables (sources, countries, and authors) that make up the latent variables (dimensions 1 and 2). In the present case study, values pertaining to the two dimensions were α1 = .791 and α2 = .704. In both cases, these outcomes indicate moderately strong correlations between the observed variables making up dimensions 1 and 2.
With regards to the discrimination measures performed for the variables included in the analysis, significant outcomes were produced. These outcomes are presented in Table and Figure 2, which are presented below (Figure 11 and Table 7).

Discrimination measures. Variable principal normalization.
Discrimination Measures.

As can be seen, firstly, the variable describing information sources is plotted parallel to dimension 1 (x = .519; y = .034) making it a good discriminant element of this dimension, that is, leftward and rightward correspondences within this dimension can be discriminated based on the source of publications (journals vs. scientific events). Variables describing author keywords (x = .830; y = .931) and continents (x = .765; y = .918) are plotted an equal distance from the origin pertaining to both dimension 1 and dimension 2. This finding highlights that both of these variables have discriminatory power regarding both examined dimensions. Further, the fact that these variables are also found to be located further away from the origin than the information sources variable indicates that they have greater explanatory power.
Finally, the union of the plots drawn for the different categories describing information sources, keywords and continents is illustrated below. From this, correspondence between the categories can be appreciated (Figure 12).

Plot of the union between the categories of keywords, information sources and continents.
Outcomes produced from the multiple correspondence analysis confirms that shown by the three-field-plots and, in addition, establishes three clear correspondences between dimension 1 (x-axis) and dimension 2 (y-axis). Firstly, journals emerge as a main information source in the European continent, with many publications referring to science communication, drawing and science comic books. Secondly, and to a lesser extent, journals also emerge as a main information source in South America, with a trend for publications to consider science education. Thirdly, scientific events emerge as a major information source in North America and Asia, with the keyword “Comic-s” appearing in many publications.
Main Study Findings
The present study analyzed the state of the issue of science popularization within the scientific community through comic books and examined a number of bibliometric variables. For the interpretation of outcomes, the major information sources from which scientific documents were retrieved were identified and data was gathered from a sample of 60 relevant documents. In addition, the most productive countries with regards to scientific outputs on the topic were identified, with collaborations between countries also being examined as an indicator of the social structure pertaining to the topic of interest. Finally, the two types of keywords found in the scientific documents were analyzed with the aim of identifying their conceptual structure in order to make inferences about main thematic trends, the focus of scientific interest and specific issues.
Conclusions and Discussion
A number of general conclusions were supported by findings from the first analysis. Firstly, a total sample of 60 scientific articles was retrieved from a targeted search applying relevant filters and parameters, with all types of documents published by the scientific community being valid for inclusion. Given that a time-period of 10 years was considered, this is a relatively small number of documents. In addition to this, it can also be seen that a large amount of the dissemination and divulgation of academic work developed in this area is achieved using scientific meetings or conferences, with outputs being subsequently published in corresponding proceedings papers. It is true that the impact of these information sources is lower in terms of citations than works published as full articles in scientific journals. All of this indicates that the topic of study is yet to gain recognition in the area and still lacks relevance within the area of educational research. However, it is promising that the topic at least has a place in the scientific community and boasts defined lines of research. Furthermore, within the time-period studied, significant growth was seen between 2018 and 2019, breaking with the trend toward steady linear growth up to that date. However, whilst this could have signaled a new trend in growth of the topic, which could have led to its consolidation as a leading issue or, at least, its expansion within the field of educational research, the subsequent drop in production in 2020 saw this possibility stifled. This may be explained by the emergence of the COVID-19 pandemic during that same year. This directly altered the world and scientific landscape, with particular repercussions in the educational scientific community (Author et al., 2022), which may have led to a setback in the growth of this field of study.
Despite that discussed above, present outcomes were, to some extent, predictable. After all, the number of science-themed graphic novels available in bookshops and the number of websites dealing with the popularization of science through comics or cartoons has seen very rapid growth but only over the last few years. Given the infancy of such trends, little research has been conducted by academic institutions. However, the fact that the popularization of science through comics is proving to be an economic phenomenon (registering substantial sales in bookshops or via web views), there is a very good chance that this topic will continue to grow in interest. For this reason the lack of studies up until the present day is not of concern. Instead, the present analysis provides an excellent starting point for further research.
With regards to the countries producing scientific papers on this topic and the collaborations formed between these countries, no country was found to be a major producer in the area and collaboration between countries was found to be low, with joint enterprises tending to be occasional or sporadic. This aspect seems normal in view of the data obtained. The USA emerged as the leading country in terms of production and was also involved in the greatest number of collaborations with countries from different continents, particularly with Europe and Asia. Outcomes from the multiple correspondence analysis conducted to examine the top 20 most prolific authors provided more detailed information on emerging trends.
With regards to the examination of conceptual structure through co-occurrence analysis and thematic maps, main findings will now be discussed. The topics of science, comics, science communication, books, education, and illustration were found to emerge most often (as seen through their high occurrence values) in the gathered literature. Despite this finding, it was found that high association values were not always produced between these topics and other keywords. In this case, topics found to produce high association values were science, comprehension, illustration, attitudes, information, comics, books, science comics, and pictures. From this, it was possible to identify the different trends and issues to have been studied, with a specific focus emerging on medical education, comic books and illustrations as alternative means of scientific dissemination. Further, the use of mobile devices emerged as an essential element of the new technologies used to present this type of content and information in order to reach the younger population.
As far as the thematic maps are concerned, generally speaking, most identified topics fall within the category of motor themes and basic themes. Data obtained from thematic maps followed the same trend seen in the network map corresponding to Figure 4. The most noteworthy aspect of these maps was the appearance of the topic visual communication as an emerging theme. Findings point to this topic as being highly innovative and capable of guiding future lines of work and research in the area.
Finally, multiple correspondence analysis of the top 20 most prolific authors revealed a series of correspondences that should also be considered. In this sense, it was concluded that authors working out of South America and Asia tended to publish in journals and include the keyword Science Education as the first listed keyword, with the keyword Science Comics also being related with Asia. On the other hand, Science Communication and Drawing tended to be listed as the first keyword on outputs coming out of Europe. Outputs pertaining to scientific events were also found to show two clear correspondences. The first was that papers whose first listed keyword was Comic-s tended to come out of Asia, whilst the keyword Drawing was more often included on outputs coming out of Europe.
Study Limitations and Future Perspectives
One of the obstacles or limitations of the present research is inherent to bibliometric studies based on scientific papers gathered from different research databases and pertains to the lack of uniformity of databases when indexing keywords and, mainly, when distinguishing between author keywords and keywords plus. Despite refining the search as much as possible using different truncation techniques, a drawback of examining all keywords is that errors appear due to discrepancies in spelling (such as hyphens between terms) or inconsistencies in the use of singular or plural words. This can lead to the recognition of keywords as distinct and independent terms when they in fact deal with the same term. Examples of this found in the present study include word pairs such as science education and science-education, cultural heritage and cultural-heritage, and comics and comic.
Finally, future research should strive to extend or complement the present research by replicating the study but extending the period of time under examination and analyzing potential growth or stagnation pertaining to scientific output on the topic and the main information sources found for the publication of relevant work. Future work could also seek to identify new trends or lines of research in relation to the general theme, thus broadening the current landscape and roadmap of scientific development in line with the main interests or needs of researchers and/or the target audience.
Footnotes
Acknowledgements
Not applicable.
Authors’ Note
This research was conducted while (Emanuela Gemelli) was at (University of Granada). They are now at (Secondary School Teacher, Lev Tolstoj Secondary School, Milan) and may be contacted at (
Declaration of Conflicting Interests
The author(s) declared no potential conflicts of interest with respect to the research, authorship, and/or publication of this article.
Funding
The author(s) received no financial support for the research, authorship, and/or publication of this article.
Ethics Statement
Not applicable.
Data Availability Statement
The raw data supporting the conclusions of this article will be made available by the authors, without undue reservation.