
Abstract
In the new era of high-quality economic development, the digital economy offers fresh perspectives and momentum for China to achieve a harmonious balance between innovation-driven growth and environmental protection. We develop a systematic dynamic model to examine the effects of the digital economy on China’s environmental quality. The findings indicate the following: (1) the digital economy initially suppresses but later promotes environmental quality; (2) by empowering primary, secondary, and tertiary industries, the digital economy advances industrial structure optimization and upgrading, leading to improved environmental quality; (3) the digital economy encourages the growth of R&D personnel and the accumulation of R&D capital stock, which fosters technological innovation and enhances environmental quality; (4) the synergistic development of the digital economy, industrial structure upgrading, and technological innovation offset the increase in energy consumption and pollution emissions caused by the digital economy’s scale effect, representing the most favorable scenario for enhancing environmental quality.
Plain Language Summary
In the new era of high-quality economic development, the digital economy offers fresh perspectives and momentum for China to achieve a harmonious balance between innovation-driven growth and environmental protection. We develop a systematic dynamic model to examine the effects of the digital economy on China’s environmental quality. The findings indicate the following: (1) the digital economy initially suppresses but later promotes environmental quality; (2) by empowering primary, secondary, and tertiary industries, the digital economy advances industrial structure optimization and upgrading, leading to improved environmental quality; (3) the digital economy encourages the growth of R&D personnel and the accumulation of R&D capital stock, which in turn fosters technological innovation and enhances environmental quality; (4) the synergistic development of the digital economy, industrial structure upgrading, and technological innovation offset the increase in energy consumption and pollution emissions caused by the digital economy’s scale effect, representing the most favorable scenario for enhancing environmental quality. This study focuses on the overall development of China’s digital economy and improving environmental quality without considering the significant regional disparities in economic development and environmental quality across different areas of China. Future research can conduct more detailed analyses on specific regions to provide more accurate policy guidance.
Introduction
After the reform and opening up, China’s economy has rapidly developed, but it has also brought about serious environmental problems. According to the Global Environmental Ranking Performance Index, China ranked 120th out of 180 countries and regions in 2020 (EPI, 2020). China’s low ranking in the EPI suggests that China has ignored environmental issues to some extent.
Environmental pollution poses a significant threat to individuals’ physical and mental health. Policymakers in China are highly concerned with alleviating air pollution, enhancing the ecological environment, and promoting strategies for coordinated development between the economy and the environment (Jahanger, Zubair Chishti, Chukwuma Onwe, & Awan, 2022). As a developing country with large-scale economic output and population, improving the ecological environment’s quality and promoting sustainable development has become essential conditions for China’s future (S. Yang et al., 2023b). With the emergence and development of the Fourth Industrial Revolution, the deep integration of new-generation information technology and traditional industries has driven social development toward digitalization and intelligence. The digital economy, based on the Internet and with digital knowledge and information as crucial production factors, is gradually taking shape and becoming a more advanced stage of the economy, following agricultural and industrial economies (Group of Twenty, 2016). Currently, China’s digital economy is booming; according to CAICT (2021), the scale of China’s digital economy reached 39.2 trillion yuan in 2020, with a growth rate of 9.7%, serving as a critical driver of China’s stable economic growth.
As an emerging paradigm, the digital economy consistently generates new opportunities and revitalizes economic development, giving rise to novel technologies, industries, models, and frameworks that contribute to China’s economic growth. It epitomizes the trajectory of China’s economic advancement. As a crucial factor in fostering high economic growth, does the digital economy influence environmental quality? What are its impact mechanisms and transmission pathways? What is the optimal development model for the digital economy to enhance environmental quality? These questions necessitate comprehensive research and discussion, providing theoretical support for China to improve environmental quality effectively. This inquiry holds significant policy implications for promoting the development of the digital economy and environmental governance.
Previous studies widely acknowledge that economic factors are closely related to environmental quality (Jahanger, Usman, & Balsalobre-Lorente, 2022; Makhdum et al., 2022; Usman & Balsalobre-Lorente, 2022). The Environmental Kuznets Curve (EKC) demonstrates a U-shaped relationship between the level of economic development and environmental quality (H. Yang & Ma, 2021). The EKC suggests that environmental pollution increases with low economic development but decreases when economic development reaches a certain threshold. Numerous studies focusing on specific countries and regions have provided evidence supporting the existence of the Environmental Kuznets Curve (EKC) hypothesis. For instance, Jahanger, Yu, Hossain, et al. (2022) validated the inverted U-shaped relationship between economic growth and environmental sustainability in countries under the North American Free Trade Agreement.
Similarly, Ayad et al. (2023) conducted an empirical study and found evidence supporting the EKC hypothesis in countries such as Algeria, Egypt, Iran, Morocco, and others. In South Asian countries, Murshed (2021) demonstrated that the EKC hypothesis exists in India, Bhutan, Bangladesh, and Sri Lanka. Al-Mulali and Ozturk (2016) confirmed the EKC hypothesis by considering cases in 27 developed countries. Recent studies have extended the commonly assessed U-shaped EKC curve to an N-shaped EKC curve (Fakher et al., 2023). However, some scholars hold opposing opinions. Pata and Samour (2022) researched and found that the EKC hypothesis is invalid in France. Similarly, Aslan et al. (2022) studied micro-industries in the United States and could not confirm the validity of the EKC hypothesis.
Researchers maintain divergent perspectives on the influence of the digital economy on environmental quality. One perspective posits that it can mitigate pollution (Asongu, 2018). Vidas-Bubanja (2014) suggested that digital technology offers robust support for addressing climate change and environmental issues, fosters eco-friendly social production, encourages green and low-carbon circular development, and advances sustainable socio-economic growth. Oláh et al. (2018) argued that e-commerce could streamline production processes, enhance efficiency, prevent unnecessary waste from production, lower environmental protection costs, and improve air quality. Ulucak and Khan (2020) analyzed panel data from BRICS countries, revealing that information technology effectively curtails carbon emissions and environmental pollution. Z. Li et al. (2021) examined 217 cities in China and empirically demonstrated that digital economy development substantially contributes to reducing PM2.5. Y. Li et al. (2021) highlighted the critical role of the digital economy’s cross-border integration with the energy sector in achieving energy conservation, emissions reduction, and decreased energy consumption, providing technological support for transforming energy consumption structures and patterns and promoting sustainable development.
The opposing view is that China’s relatively underdeveloped digital technology, coupled with its defective hardware and software environments, constrains the expansion of the digital industry. Consequently, it becomes challenging to enhance energy efficiency and decrease pollution emissions in the production domain (X. H. Li, 2019). The inherent nature of the ICT industry dictates that future production, processing, and application will inevitably result in substantial energy consumption, persisting as a lengthy process (Wang & Li, 2016). Andrae and Edler (2015) predicted greenhouse gas emissions generated by the CT industry, indicating that without considering renewable energy, energy consumption from the CT industry will contribute to 23% of greenhouse gas emissions by 2030. L. Zhang et al. (2022) conducted a study using panel data from various provinces in China, and they found that the development of the digital economy hinders improvements in energy efficiency, which is detrimental to carbon reduction efforts and leads to environmental degradation. K. Li et al. (2020) explored this issue from the perspective of enterprises. They argued that although the technological advancements brought by the digital economy drive the optimization and upgrading of production equipment, companies may increase resource extraction and energy consumption to boost output, potentially leading to higher levels of harmful emissions.
The third perspective posits a nonlinear relationship between the digital economy and environmental pollution. X. Li et al. (2021) identified a nonlinear association between CO2 emissions and the digital economy in their global data analysis from 190 countries, supporting the EKC hypothesis. Zhou et al. (2021) empirically demonstrated that the digital economy can alleviate smog pollution by optimizing and upgrading the industrial structure, exhibiting a nonlinear characteristic.
Moreover, industrial structure, energy consumption patterns, and environmental governance are regarded as crucial factors influencing air quality in China (Cui et al., 2021; Jahanger, Hossain, Onwe, Ogwu, Awan, & Balsalobre-Lorente, 2023; S. Jiang et al., 2022; B. Yang et al., 2021). Abundant natural resources and renewable energy can significantly alleviate environmental pollution (Ibrahim et al., 2022). Changes in energy consumption structure and improvements in energy efficiency are effective pathways to reduce carbon emissions (Ahmad et al., 2021; Rehman et al., 2021), which are beneficial for China to achieve green and low-carbon development (Wu et al., 2021). Among all industries, the energy sector is one of the areas with the most significant emission reduction potential after applying digital technologies (Y. Li et al., 2021). Digital technology ensures energy systems’ safe and efficient operation (Y. Chen, 2020) while diminishing environmental harm (De Rademaeker et al., 2014; Soares & Tolmasquim, 2000). Human capital, as a critical production factor, encourages improvements in energy efficiency, which helps mitigate pollutants and restore environmental sustainability (Ahmad et al., 2022; Saqib et al., 2023; L. Yang et al., 2017). Human capital development can create new trajectories by fostering technologies adopting energy-saving appliances, and avoiding energy poverty traps. Human capital enhances people’s comprehension of environmental interactions, thereby minimizing the adverse impact of these interactions (Jahanger, Hossain, Usman, & Chukwuma Onwe, 2023).
Human capital is a crucial production factor that drives us to improve energy efficiency, helps curb pollutants, and restores environmental sustainability (L. Yang et al., 2017). Apart from human capital, there are no other means to sustainably and systematically utilize existing natural resources (Zafar et al., 2019). Developing human capital through education and training is a vital strategy for reducing CO2 emissions and elevating productivity in the industrial and transportation sectors (Jahanger, Usman, & Ahmad, 2023).
Multiple studies have demonstrated that technological innovation can mitigate environmental pollution (Awan et al., 2022; Feng et al., 2021; Jahanger, Ozturk, Chukwuma Onwe, Joseph, & Razib Hossain, 2023; Wen et al., 2021), encompassing clean technology, energy efficiency, production technology, and other action channels (Ren et al., 2021). The primary role of technological progress is to optimize input allocation and enhance energy efficiency (S. Yang et al., 2023a). Furthermore, the interaction between technological innovation, natural resources, and renewable energy consumption can contribute to reducing CO2 emissions and improving environmental quality (Adebayo et al., 2023). The growth of the digital economy has facilitated the application of digital technology, which effectively integrates innovative resources, strengthens technological innovation, and promotes environmental quality (Huang et al., 2023).
Upgrading the industrial structure is integral to enhancing ecological environment quality (Xi & Zhai, 2023). Upgrading industrial structure requires shifting the economic growth mode and drivers from resource-intensive and labor-intensive to knowledge and technology-intensive, gradually becoming the driving force behind economic growth. This shift reduces the reliance of social production on resources, thereby improving environmental quality (Huang et al., 2023). Godil et al. (2021) examined the relationship between renewable energy utilization, technological innovation, and CO2 emissions, finding that, in the long term, both renewable energy consumption and technological innovation contribute to CO2 emission reduction and improved environmental performance. May et al. (2017) argued that digital economy development could reduce pollution by fostering technological innovation in the industrial sector, enhancing energy efficiency, and altering the energy structure. Usman et al. (2023) highlighted the significance of technological innovation, human capital, and their roles in the relationship between GDP growth and greenhouse gas emissions.
In summary, numerous studies have investigated the relationship between the digital economy and environmental quality; however, several research gaps remain. Firstly, the conclusions concerning the relationship between digital economic development and environmental quality remain contradictory and necessitate consensus. This inconsistency may stem from a limited selection of indicators for measuring digital economic growth and environmental quality and an inadequate comprehension of the underlying mechanisms. Secondly, environmental quality issues involve multiple factors, including energy consumption, economic development, technological innovation, and human resources. Therefore, current research needs to examine the changes in environmental quality from a systemic perspective regarding the digital economy. Thirdly, the majority of the literature establishes an analytical framework for the impact of the digital economy on environmental quality from a static perspective, with limited research on dynamic processes and evolutionary trends. Fourth, while some scholars have employed econometric methods to explore the relationship between energy consumption, economic development, technological innovation, human resources, and environmental quality, these studies lack predictions and assessments of future trends in these factors. Fifth, Current research analysis primarily relies on past data, and no study confirms the validity of the Environmental Kuznets Curve (EKC) hypothesis in the future.
Given the existing gaps in the literature, this article presents a system dynamics model of the digital economy’s impact on environmental quality, taking into account the complex interactions between various factors. This study offers several contributions. Firstly, in terms of indicator selection, it is recommended to use the scale of the digital economy as a measure of its development level in order to reduce potential biases that may arise from using an indicator system. Environmental pollution is assessed from multiple angles by considering pollutants such as CO2, SO2, and COD emissions. Secondly, from the perspective of the research process, this research approaches changes in the economy, population, technology, energy, and environment as dynamic system behaviors, constructing a system dynamics model to explore the development of different dimensions and their interconnections. By utilizing simulation techniques, researchers can predict the future development trajectory of the digital economy and environmental quality, determine optimal strategies for improving the environment, and provide feasible solutions to address the complex issues arising from the interaction between the digital economy and environmental quality. Lastly, based on the research findings, the impact of the digital economy on environmental quality is not simply suppressive or promotive but rather a complex effect characterized by initial suppression followed by promotion. The digital economy empowers agriculture, industry, and manufacturing, facilitating the optimization and upgrading of industrial structures, thereby driving improvements in environmental quality. Moreover, the digital economy fosters the accumulation of human and research capital, enhances technological innovation, and consequently improves environmental quality. The collaborative development of the digital economy, industrial structure upgrading, and technological innovation help offset increased energy consumption and pollution emissions caused by the digital economy’s scale effect, representing the optimal scenario for promoting environmental quality improvement.
The article organizes the remaining sections: Section 2 presents the methodology for constructing the model and calculating parameters. Section 3 conducts model tests to validate its accuracy. Section 4 includes scenario simulations that examine the impact of the digital economy on environmental quality and analyze potential mitigation strategies. Section 5 discusses the empirical results derived from the simulations. Finally, Section 6 presents policy recommendations and outlines the study’s limitations.
Construction of a System Dynamics Model
Recent research in system science suggests that the nature-society-economy system within a region constitutes an open complex system (Jian et al., 2015). System dynamics, a well-established method grounded in cybernetics, system theory, and information theory, allows for simulating and predicting system development trends through by constructing systematic dynamic model (Forrester, 2007; Xing et al., 2019). Therefore, we use system dynamics to capture the internal causal dynamics linking digital economy development and environmental quality.
Under the principle of system simplicity, certain assumptions are made to ensure the system’s smooth operation. The primary assumptions are as follows. (1) our social environment remains in a highly stable state; (2) China’s socio-economic development is considered an independent entity, excluding other external development factors; (3) China’s population growth rate maintains its current level throughout the simulation period; (4) the system boundary in this study is describable, meaning it has a defined scope.
System Boundary and Element Analysis
The Determination of System Boundary
The STIRPAT model is extensively employed in environmental impact assessments (York et al., 2003). Consequently, we utilize the STIRPAT model to categorize the system elements of the digital economy affecting environmental quality into five subsystems: economy, energy, population, technology, and environment. Figure 1 depicts the relationships between each subsystem.

The flow diagram for subsystem.
Analysis of System Elements
Based on the previously defined system boundaries, the elements of each subsystem within the system dynamics model of the digital economy’s impact on environmental quality are as follows:
Economy subsystem. Besides core variables such as GDP and the digital economy, the system also incorporates economic factors like fixed assets and an output value of primary, secondary, and tertiary industries and considers industrial structure upgrading using the proportions of these industries. The output value of each industry serves as a vital variable connecting the economic subsystem with the energy and environmental subsystem. The economic subsystem has four primary effects on other subsystems: ① Economic development increases per capita consumption, leading to a substantial rise in demand for material goods, resulting in continuous growth in energy consumption and pollutant emissions from daily life. ② The Expansion of the industrial scale results in greater energy consumption and pollution emissions. ③ The tertiary industry has a lower negative environmental impact compared to other industries. Increasing fixed asset investment in tertiary industry, enhancing its value-added, and promoting optimization and upgrading the industrial structure can effectively reduce various pollutant emissions. ④ The economic subsystem also influences other subsystems through intermediate variables. For instance, society is more inclined to invest in technological innovation under digital economy development, consequently affecting the technology subsystem.
Population subsystem. The population subsystem consists of factors such as employees in primary, secondary, and tertiary industries and the natural population growth rate. The population subsystem primarily investigates the effects of population growth or decline on economic development, energy consumption, and environmental quality, focusing on three aspects: First, the expansion of the population subsystem provides human capital for socio-economic development and adequate social labor for industrial progress (Xing et al., 2019). Second, the population subsystem contributes to environmental pollution and energy consumption. As the population expands, the overall social material demand increases, resulting in a heightened environmental burden. Third, population growth also drives an increase in R&D personnel, promoting the development of the technology subsystem.
Energy subsystem. The system’s energy consumption comprises the primary, secondary, and tertiary industries, as well as daily life consumption. It also includes energy input components, intensity, and structure, crucial factors influencing energy pollution reduction (T. Jiang et al., 2022; Usman & Radulescu, 2022). The energy subsystem impacts other subsystems. First, controlling energy consumption and optimizing energy use structure play a vital role in reducing CO2 emissions. Second, the increase in energy consumption results in continuous damage to the environment and ecology, deepening the environmental load and eventually constraining economic development.
Technology subsystem. The technology subsystem primarily examines the impact of technological advancements on other systems, given specific economic levels and energy consumption. Incorporating technological elements into energy-saving and emission-reduction systems aims to enhance energy efficiency, decrease industrial energy consumption intensity, and support energy conservation, emission reduction, and clean production. The technological innovation system focuses on core variables such as research and development personnel, R&D capital stock, and technological innovation. J. Chen (2021) suggests that research and development personnel and R&D capital stock influence technological innovation.
Environment subsystem. The ultimate destination of the interaction and interconnection between the economic, population, energy, and technology subsystems is the development of the environment subsystem. The relationship between the environmental subsystem and other systems is primarily evident in two aspects. On the one hand, the rapid development of the economy consumes a large number of resources and energy, emitting more waste gas, wastewater, and solid waste, thereby reducing the level of resources and energy-carrying capacity and damaging the stability of the ecosystem. On the other hand, environmental pollution negatively impacts the economy and society, resulting in considerable economic losses. Thus, society must invest more in addressing environmental issues. Air, water, and soil pollution are the primary outcomes of pollution emissions (Guan et al., 2011). Considering data availability, common pollutants such as CO2, COD, SO2, and others are selected as indicators to measure the environment. An environmental quality factor variable is introduced to represent environmental quality comprehensively. Table 1 describes the main variables of each subsystem.
Main System Variables.

Cause Loop Diagram
To analyze the impact of the digital economy on environmental quality and the relationships among the main variables in the systems, we constructed a causal loop diagram (CLD) depicting the interplay between the digital economy and environmental quality. Figure 2 illustrates the reciprocal influences and interactive relationships among various system variables. Positive connections are indicated by a “+,” while negative connections are represented by a “-.” A positive connection signifies that two variables change in the same direction, whereas a negative connection indicates that the two variables change in opposite directions. For instance, digital economy scale→+ R&D capital stock →+ technological innovation → - industrial energy consumption intensity →+ industrial energy consumption →+ industrial SO2 emissions →+ SO2 emissions →+ environmental pollution →+ economic loss of environmental pollution → - GDP (positive feedback loop). Population →+ domestic COD emissions →+ COD emissions →+ environmental pollution → - environmental quality (negative feedback loop).

The causal loop diagram of digital economy and environmental quality.
Flow Diagram
Although the CLD can depict the basic structure of feedback relationships, it cannot differentiate between distinct variables. Consequently, we construct a flow diagram (Figure 3) to clarify the cumulative responses of different variables. In Figure 3, the level variables, denoted by “ ”, describe the system’s cumulative effect, which can respond to the accumulation of materials, energy and information over time. The rate variables, symbolized by “
 ”, represent the speed of the system’s cumulative effect and reflect the level variable’s change over time. They indicate the system’s change speed or the amplitude of a decision. Auxiliary variables serve as intermediate variables throughout the entire decision-making process. This paper primarily includes four level variables, five rate variables, 79 auxiliary variables, and 10 constants.

The flow diagram of the digital economy’s impact on environmental quality.
Data Sources, Variable Calculation, and Equation Determination
The data in this paper primarily derive from the China Statistical Yearbook, China Environmental Statistical Yearbook, and the China National Bureau of Statistics database. We use exponential smoothing method and linear interpolation to address the missing data. Digital economy data are sourced from the “White Paper on the Development of China’s Information Economy” and the “White Paper on the Development of China’s Digital Economy,” published by the China Academy of Information and Communication Research.
We select the period from 2005 to 2019 as the timeframe for model construction and validation while setting the period from 2020 to 2030 as the simulation and prediction timeframe of the model. The simulation time step interval was set to 1 year. The main objective was to forecast the trends in digital economy development, energy consumption, and environmental pollution for the next decade, providing insights into the future. To enhance the validity and reasonableness of the interrelationships among variables in the simulation model, we concentrate on debugging and testing variables with actual data at each stage of the simulation model construction, aligning with China’s digital economy development and environmental quality improvement realities. Due to the content length, we will introduce only some parameters and equations.
Calculation of Main Parameters
Measurement of R&D Capital Stock
Following Bitzer and Stephan (2007), we use the perpetual inventory method to measure R&D capital stock:

Where

Therefore,

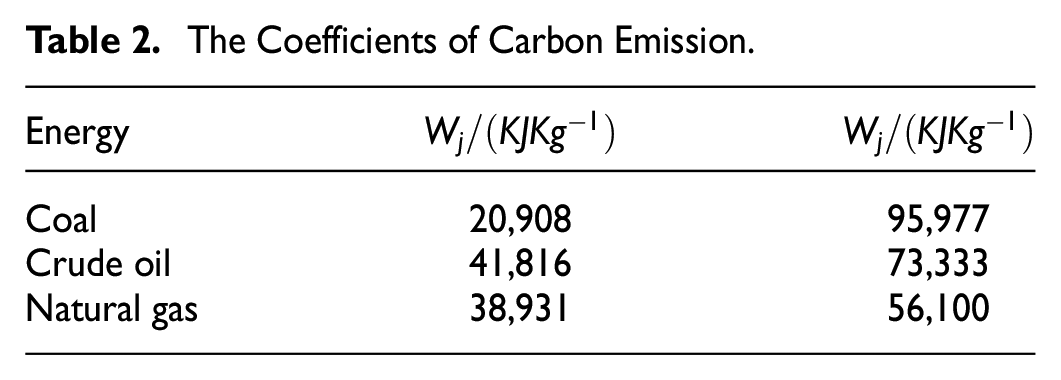
Carbon Emission Measurement in Energy Field
We calculate carbon emissions from fossil energy combustion using the methodology recommended in the “IPCC 2006 Guidelines for National Greenhouse Gas Emissions Inventories,” as detailed below.

C refers to CO2 emissions; j refers to various types of energy, specifically coal, crude oil, and natural gas;
The Coefficients of Carbon Emission.
Determination of the Main Equations
Level Variables
Level variables, a category of state variables, primarily denote the accumulated magnitude of pertinent quantities and are generally employed to illustrate the continuous accumulation of certain phenomena over time. The simulation model establishes population size, digital economy scale, and R&D capital stock level variables. The base year for the simulation is set as 2005, and the level variable model equations conforming to this study are constructed as follows:


Auxiliary Variables
The quantitative equations for auxiliary variables are determined by regression equations and lookup functions, representing different expressions in the model.
Regression Equation
A regression equation is employed to establish the relationship between the scale of the digital economy and the increment in R&D capital. The digital economy holds the potential to boost social innovation participation and innovation vitality, consequently leading to a rise in R&D capital investment (Dai et al., 2022; Yan & Wu, 2021). The relationship between these variables can be articulated as follows:

With Lookup Function
A lookup function is utilized to represent specific nonlinear relationships between two variables or to describe dynamic constants. These functions are typically presented in tabular form and are adjusted based on subjective experience and reference to planning achievements. For instance, the proportion of natural gas consumption can be explained as follows:
According to the “Energy Production and Consumption Revolution Strategy (2016-2030)” published by the National Development and Reform Commission and the National Energy Administration of China, the proportion of natural gas is anticipated to reach approximately 15% by 2030. Consequently, the proportion of natural gas consumption is established as follows:

Constants
Constants typically represent specific numerical values of indicators and serve as the most stable variables in computational processes. The model incorporates several constants, including coal carbon emission coefficients, crude oil carbon emission coefficients, and average lower heating values of coal, natural gas, and crude oil.
Model Tests
Operational Inspection
We conduct simulation tests using three different annual time intervals, D = 1, D = 0.5, and D = 0.25, corresponding to 1 year, half a year, and one quarter, respectively, to evaluate the simulation results of critical indicators. The model lacks the corresponding stability if there is a significant difference in the simulation results corresponding to the indicators at different time stages. Considering the abundance of indicators, we select the number of employees, COD emissions, the share of primary production, and the energy intensity of secondary production from each subsystem as representative variables for observation. Figure 4 illustrates the results, showing that the main indicators remained stable and did not exhibit significant fluctuations. Therefore, the system demonstrates stability.

The results of operation test.
Historicity Test
The primary objective of the historicity test is to compare the disparity between simulation outcomes and historical data to ascertain the validity of the simulation model. For this purpose, we selected fixed asset investment, total energy consumption, R&D capital stock, and COD emissions as test variables. Historical testing was conducted using data from 2005 to 2019, and the relative errors between simulated data and historical data are shown in Tables 3 and 4. The results demonstrate that the relative error is predominantly within 10%, signifying that the system dynamics model of the digital economy affecting environmental quality is consistent, accurate, and effective in reflecting the development trend of the existing system. This alignment adheres to the principles and requirements for model construction (Liu et al., 2015).
Historical Test Results 1.

Historical Test Results 2.

Scenario Simulation of the Impact of Digital Economy on Environmental Quality and Analysis of Mitigation Paths
Scenario Solutions
Adjustment Parameter Selection
The development of the digital economy serves as the basis for determining parameters. Consequently, we choose representative parameters, including digital economy growth rate, R&D capital increment, full-time equivalent of R&D personnel, fixed assets investment in tertiary industry, and employees in tertiary industry. As the current state is immutable, we adjust the parameters of critical factors, using 2020 as the starting point.
Scenario Setting
Baseline scenario. The baseline scenario (D1) is developed based on current trends without implementing intervention measures. The relevant parameters are established using a linear regression model derived from historical data (2005–2019). The baseline scenario serves as the fundamental benchmark for adjusting other scenario parameters.
Core scenario. Taking the digital economy as the core scenario, we examine the impact of expanding the scale of the digital economy on future system changes. Based on the research content of “China’s Digitalization Road Report” released by the China Development Institute (Shenzhen) and the “White Paper on China’s Digital Economy Development” released by the China Academy of Information and Communications Technology, the medium plan of the core scenario sets the digital economy growth rate at 13.2%, denoted as D2. The high plan of the core scenario sets the digital economy growth rate at 15%, denoted as D3. Other parameters remain unchanged.
Auxiliary scenarios. Auxiliary scenarios can be categorized into two types. The first type is the technological innovation scenario, which serves as a primary means of reducing total energy consumption and pollution emissions. Technological innovation is directly influenced by R&D personnel and R&D capital. Therefore, the medium plan of the technological innovation scenario is set with a 5% increase in R&D capital increment and full-time equivalent of R&D personnel, denoted as T2. The high plan of the technological innovation scenario is set with a 7.5% increase in R&D capital increment and full-time equivalent of R&D personnel, denoted as T3. Other parameters remain unchanged.
The second type is the industrial structure upgrading scenario, which emphasizes promoting industrial structure upgrading as a development approach. The upgrading of the industrial structure is directly influenced by the output value of the tertiary industry, which in turn is affected by fixed asset investment and the number of employees. Therefore, the medium plan of the industrial structure upgrading scenario increases fixed asset investment in tertiary industry and employees in tertiary industry by 5%, denoted as I2. The high plan of the industrial structure upgrading scenario increases fixed asset investment in tertiary industry and employees in tertiary industry by 7.5%, denoted as I3. Other parameters remain unchanged.
Integrated scenario. The integrated scenario focuses on the collaborative development of the digital economy, industrial structure upgrading, and technological innovation. In the medium plan of the integrated scenario, the growth rate of the digital economy is set at 13.2%, the incremental of R&D capital and full-time equivalent of R&D personnel is increased by 5%, fixed assets investment in tertiary industry and employees in tertiary industry are increased by 5%, referred to as E2. In the high plan of the integrated scenario, the growth rate of the digital economy is set at 15%, the incremental of R&D capital and full-time equivalent of R&D personnel is increased by 7.5%, fixed assets investment in tertiary industry and employees in tertiary industry are increased by 7.5%, referred to as E3, while all other parameters remain unchanged.
System Simulation Analysis Under Different Scenarios
System Simulation Analysis Under Core Scenarios
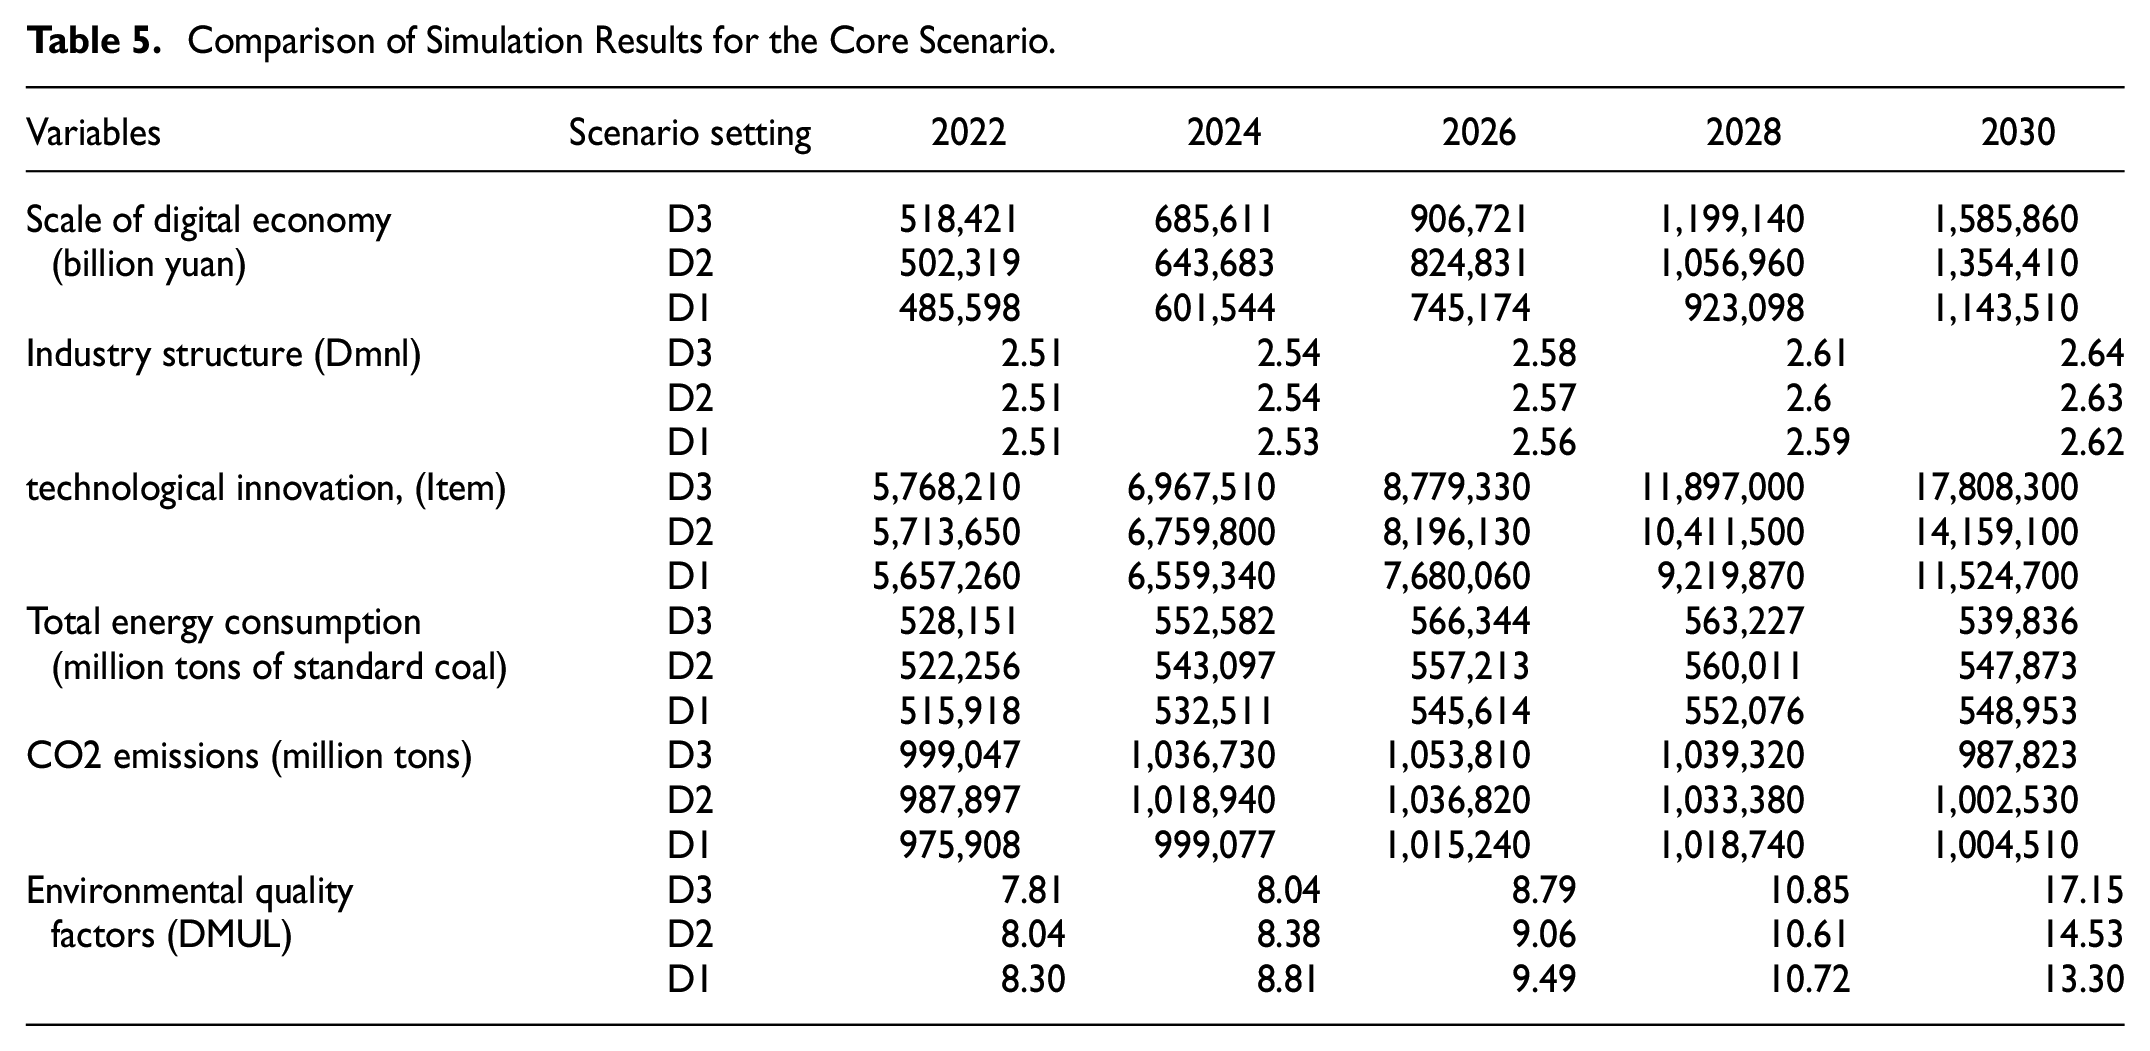
Digital Economy Development: As depicted in Table 5 and Figure 5, China’s digital economy demonstrates exponential growth patterns. According to D1, the digital economy is forecasted to surpass 601,544 billion yuan in 2024 and is anticipated to exceed 1,143,510 billion yuan by 2030. According to D2, the digital economy’s magnitude is projected to surpass 643,683 billion yuan in 2024 and reach 1,354,410 billion yuan by 2030. According to D3, the digital economy is expected to surpass 685,611 billion yuan in 2024 and escalate to 1,585,860 billion yuan by 2030.
Comparison of Simulation Results for the Core Scenario.

Core scenario simulation diagram.
Digital Economy and Industrial Structure: According to D1, with the development of the digital economy, the industrial structure index has increased from 2.48 in 2020 to 2.62 in 2030. According to D2, the industrial structure index 2030 is 0.01 higher than the baseline scenario. According to D3, the industrial structure index 2030 is 0.02 higher than the baseline scenario. The results indicate that the digital economy empowers the first, second, and third industries, promoting industrial structure upgrading.
Digital Economy and Technological Innovation: According to D1, with the development of the digital economy, the number of technological innovations is projected to increase from 4,845,470 in 2020 to 11,524,700 in 2030. According to D2, the level of technological innovation in 2030 is 2,634,400, higher than the baseline scenario. According to D3, the level of technological innovation in 2030 is 6,283,600, higher than the baseline scenario. The results indicate that the digital economy promotes an increase in R&D personnel and the accumulation of R&D capital stock, driving technological innovation.
Digital Economy and Energy Consumption: According to D1, energy consumption peaks in 2028 at 552,076 million tons of standard coal, decreasing to 548,953 million tons of standard coal by 2030. According to D2, energy consumption is projected to peak in 2027, reaching 560,300 million tons of standard coal, and is expected to decrease to 547,873 million tons of standard coal by 2030. According to D3, energy consumption peaked in 2027 at 567,224 million tons of standard coal, decreasing to 539,836 million tons of standard coal by 2030. The results demonstrate that the digital economy initially leads to increased energy consumption but drives energy consumption to peak sooner. After reaching the peak, the digital economy facilitates a more rapid decline in energy consumption.
Digital Economy and CO2 Emissions: According to D1, CO2 emissions peak at 1,018,920 million tons in 2027 and are reduced to 1,004,510 million tons by 2030. According to D2, CO2 emissions will peak at 1,038,240 million tons in 2027 and decrease to 1,002,530 million tons by 2030. According to D3, CO2 emissions peak in 2026 at 1,053,810 million tons and will be reduced to 987,823 million tons by 2030. The results indicate that in the early stages of development, the digital economy increases carbon dioxide emissions and accelerates the attainment of peak emissions. However, after reaching the peak, the digital economy facilitates a faster decline in carbon dioxide emissions.
Digital Economy and Environmental Quality: Before 2027, the growth curves of environmental quality in D2 and D3 are lower than the growth curve in D1, indicating that expanding the digital economy reduces the rate of improvement in environmental quality. In other words, the initial development of the digital economy hinders improving environmental quality. After 2027, the growth curves of environmental quality in D2 and D3 exceed the growth curve in D1, indicating that increasing the scale of the digital economy improves environmental quality. By 2030, the environmental quality in D2 and D3 is respectively 3.8492 and 1.225 higher than in D1. The results suggest that the digital economy initially inhibits environmental quality, followed by a promoting effect.
System Simulation Analysis Under Auxiliary Scenarios
As shown in Table 6 and Figure 6, promoting technological innovation and industrial structure upgrading can reduce energy consumption, decrease carbon dioxide emissions, and improve environmental quality. In the technological innovation scenario, by 2030, the total energy consumption in T2 and T3 is respectively 19,063 million tons of standard coal and 27,944 million tons of standard coal lower than in D1. Similarly, the carbon dioxide emissions in T2 and T3 are respectively 34,890 million tons and 51,1410 million tons lower than in D1. Additionally, the environmental quality in T2 and T3 is respectively 3.34 and 5.5 higher than in D1. In the industrial structure upgrading scenario, by 2030, the total energy consumption in I2 and I3 is respectively 13,072 million tons of standard coal and 22,518 million tons of standard coal lower than in D1. Correspondingly, the carbon dioxide emissions in I2 and I3 are respectively 32,980 million tons and 52,550 million tons lower than in D1. Furthermore, the environmental quality in I2 and I3 is respectively 2.74 and 4.94 higher than in D1.
Comparison of Simulation Results Under the Auxiliary Scenario and the Integrated Scenario.


Auxiliary scenarios simulation diagram.
System Simulation Analysis Under Integrated Scenarios
According to Table 6 and Figure 7, by 2030, the total energy consumption in E2 and E3 is respectively 32,519 million tons of standard coal and 56,984 million tons of standard coal lower than in D1. Similarly, the carbon dioxide emissions in E2 and E3 are respectively 59,508 million tons and 104,277 million tons lower than in D1. Additionally, the environmental quality in E2 and E3 is respectively 10.03 and 33.43 higher than in D1. It can be observed that the integrated scenario of coordinated development of the digital economy, industrial structure upgrading, and technological innovation is the optimal solution for improving environmental quality.
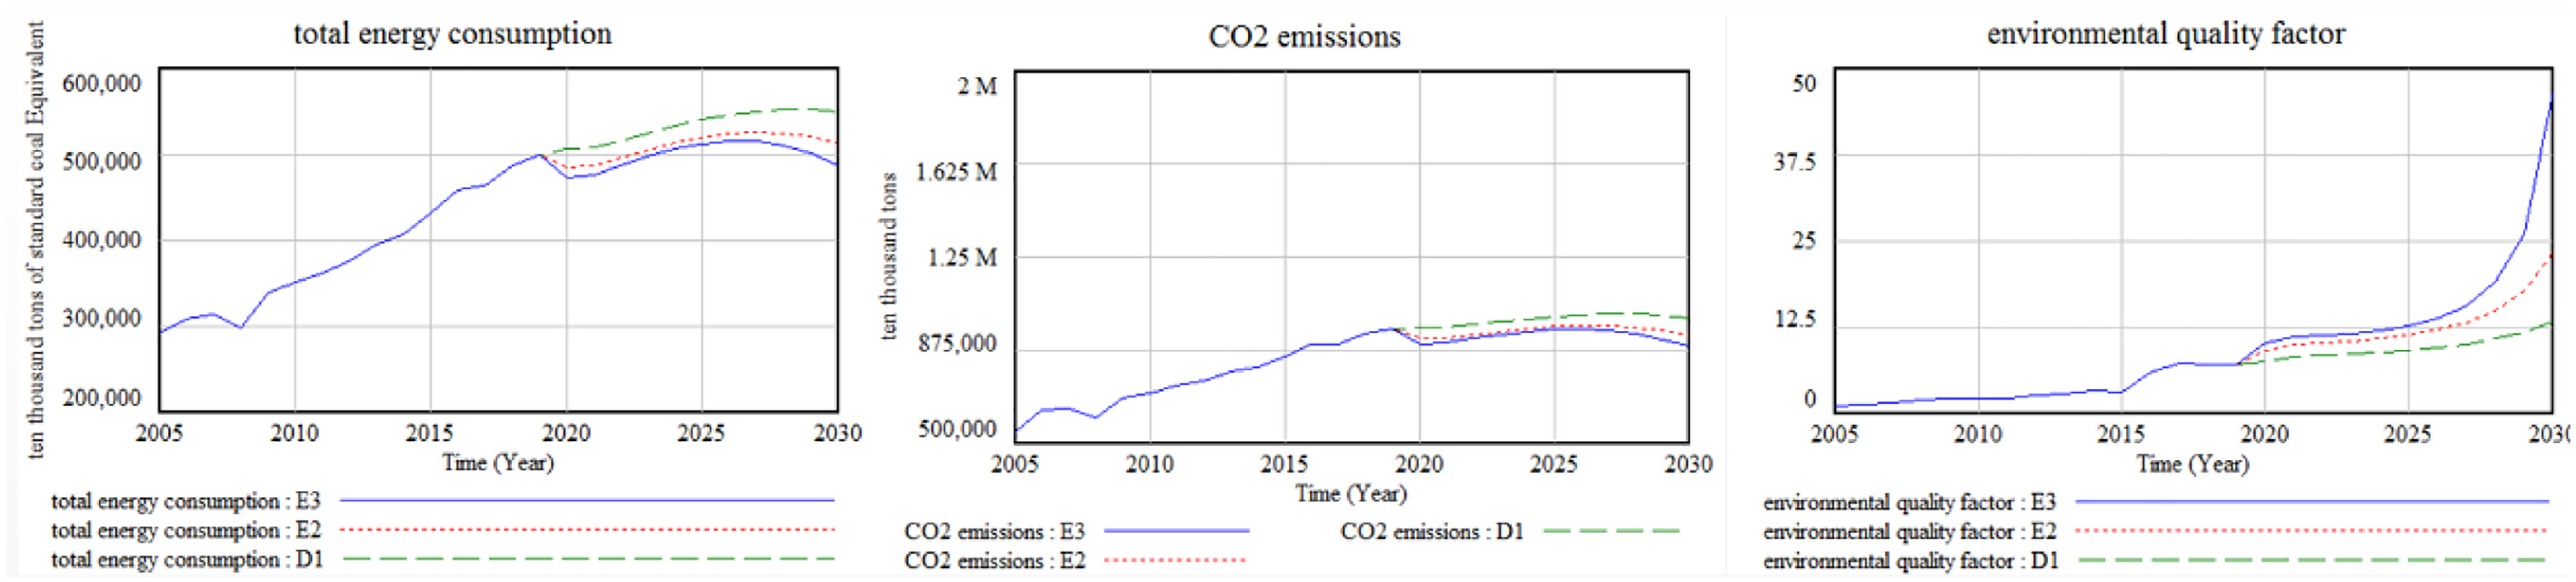
Integrated scenario simulation diagram.
Simulation results from system dynamics reveal that the optimal scenario for enhancing environmental quality combines digital economic development, industrial structure upgrading, and technological innovation. These results also highlight existing issues and potential future improvements. Currently, the driving force of the digital economy on industrial structure upgrading and technology innovation is insufficient. The digital economy exhibits limited influence on improving environmental quality, and the potential for energy saving and emission reduction has yet to be fully realized. Consequently, future efforts should focus on accelerating digital economy development while emphasizing its driving force on industrial structure and scientific and technological innovation.
Discussion and Conclusions
This paper investigates the relationship between the digital economy and environmental quality using a system dynamics approach. A dynamic system encompassing population, economy, energy, technology, and ecology is established, and the impact of the digital economy on environmental quality in China is assessed through simulation experiments under varying scenarios. The study reaches the following conclusions:
(1) The findings reveal that the digital economy has a dual impact on environmental quality—initially suppressing it before promoting it. In the short term, the digital economy raises energy consumption and CO2 emissions, hindering environmental quality improvement. However, in the long term, the digital economy reduces energy consumption and CO2 emissions, fostering environmental quality enhancement. Overall, the digital economy’s promoting effect on environmental quality outweighs its inhibitory effect, a conclusion supported by X. Li et al. (2021). In the short term, the digital economy’s inhibitory effect on the environment is predominantly due to the scale effect. First, the production, usage, and recycling of digital industry-related products involve extensive extraction and utilization of rare metals, inevitably causing substantial energy consumption and environmental issues (Z. Li et al., 2021). Second, the development of the digital economy encourages the improvement of production capacity and the expansion of production scale, which increases the input of production factors such as natural resources, leading to excessive exploitation and utilization of natural resources, resulting in a decline in environmental quality (S. Xu et al., 2022).
In the long term, the vigorous development of the digital economy and its extensive integration with the physical economy has increasingly profound impacts on the economic and social aspects. The digital industrialization and digitization of industries such as intelligent manufacturing, e-commerce, electronic devices, and digital services are also playing an increasingly significant role in shaping the economy and society. The digital economy can effectively decrease operating costs, considerably enhance resource utilization efficiency, encourage technological innovation, environmental governance, and industrial transformation, and promote energy conservation, emission reduction, and consumption reduction, ultimately playing a vital role in improving environmental quality (Z. Zhang et al., 2023). Moreover, the digital economy can optimize resource utilization efficiency by sharing information for effective resource utilization, thereby reducing energy consumption and carbon emissions. Some studies have demonstrated that digital technologies empowering energy, manufacturing, agriculture, land use, consumption, and services can promote a 15% reduction in global carbon emissions (Qian et al., 2020).
(2) While promoting digital industrialization, the digital economy empowers agriculture, industry, and manufacturing, fostering the optimization and upgrading of the industrial structure and establishing a solid foundation for the mutual collaboration and common development of the three industries. The upgrading of the industrial structure effectively promotes the reduction of pollutant emissions such as SO2, CO2, and COD, thereby improving environmental quality.
The digital economy is considered a technological revolution that will significantly impact all forms of industries (Miller & Wilsdon, 2001). The digital economy has transformed the mode of agricultural production, cultivation, and sales, reducing production costs, enhancing the circulation efficiency of agricultural products, and achieving the upgrading of primary industries. The industrial sector has realized digitization and intelligence in procurement, production, sales, and more, employing innovative technologies for environmentally friendly production, which has helped reduce environmental pollution caused by industrial production and achieved industrial upgrading (Z. Li & Wang, 2022). The platform economy and digital technology have facilitated the connection between service supply in the service industry and end-user demand, helping reduce resource waste caused by information mismatch and untimeliness between supply and demand, and promoting the upgrading of resource allocation in traditional service industries (Zhao et al., 2023).
The digital economy has accomplished the restructuring of existing resources from low-end industries to high-value-added industries, encouraging the transformation of traditional labor and capital-intensive industries toward data-intensive and technology-intensive industries (J. Zhang et al., 2022). The high degree of innovation, penetration, and diffusion speed of the digital economy has enabled cooperation and communication between upstream and downstream enterprises, fostering the integration and development of industries (Bencsik, 2020). The upgrading of the industrial structure can significantly improve industrial production efficiency, achieve the goal of low input, high output, and low pollution, and transition the industrial ecosystem toward a green direction, thus contributing to the improvement of the ecological environment (Huang et al., 2023).
(3) The digital economy promotes the growth of R&D personnel and further accumulation of R&D capital, thereby driving technological innovation. As a knowledge-intensive industry, the digital sector is characterized by frequent internal innovation activities and abundant innovation resources conducive to achieving innovation (S. Zhang et al., 2020).
First, the application of digital technology significantly enhances the level of intelligence in production equipment, optimizing production processes and promoting collaboration (Gao et al., 2022). In this context, increasing number of companies are transitioning from resource-intensive to technology-intensive manufacturing industries, thereby improving production efficiency (Calvino et al., 2018). Second, the development of the digital economy elevates the technological content and added value of products, reduces energy consumption in the production process, and facilitates energy conservation and pollution reduction (Q. Li et al., 2019). Third, the growth of the digital economy aids in improving the cross-regional collaborative capacity of innovative factors such as capital, talent, and technology, which maximizes the integration of regional innovation resources and promotes the efficient and orderly flow of innovative factors (J. Zhang et al., 2022). Fourth, the progress of the digital economy also encourages technological exchanges among various innovative entities (Morrar et al., 2017). With the assistance of digital technologies like the internet and artificial intelligence, innovative entities can easily access information and knowledge, significantly enhancing the efficiency and frequency of knowledge exchange and fostering the dissemination of new technologies and professional expertise. Most perspectives agree that technological innovation can support environmental governance and reduce environmental pollution (Ulucak & Khan, 2020). Thus, developing the digital economy promotes technological innovation, improving environmental quality.
Policy Recommendations
According to the research findings, we propose the following policy recommendations:
Accelerate the development of the digital economy to enhance environmental quality.
First, focus on infrastructure and information resource construction that facilitates the development of the digital economy. Emphasize the implementation of “new infrastructure” projects such as 5G and big data centers, promote interconnectivity of infrastructure construction, and strive to create an innovative, scientific, and efficient environment for digital economic development.
Second, fully leverage the role of the digital economy in improving environmental quality. Establish intelligent pollution prevention and control systems, utilizing emerging technologies such as artificial intelligence, the Internet of Things, and cloud computing to achieve comprehensive coverage and real-time environmental pollution monitoring. Promote information sharing on pollution prevention and control among different regions, achieve interconnected pollution prevention and control, and make environmental pollution prevention and control more scientific, rational, and practical.
Lastly, promote the integration and development of the digital economy with the real economy. Develop policies and systems that align with the current stage of industrial development, stimulate the innovation and flexibility of digital economic development, promote the optimization and upgrading of clean technologies, facilitate the transformation from high-pollution and high-energy-consuming industries to clean industries, and achieve sustainable environmental development.
2. Strengthen the driving force of the digital economy for industrial structure upgrading and technological innovation.
First, enhance the adaptability and coordination of the layout of emerging industries, actively seize the opportunities for industrial digitization, promote the optimization and upgrading of industrial digitization, and use digitization, networking, and intelligence to promote deep integration between traditional industries and the digital economy.
Second, increase scientific and technological innovation research and development efforts, focusing on critical areas such as cloud computing, industrial internet, and big data. Promote the renewal and upgrading of foundational technologies to improve production efficiency. Pay special attention to the research and development of innovative low-carbon technologies, promote green and low-carbon transformation in energy, and provide essential technological support for energy conservation, emission reduction, and environmental quality improvement. Utilize digital technology to achieve interconnectivity of innovation platforms, integrate innovation resources, strengthen collaborative and open innovation, and unleash the potential of digitization.
Limitations and Future Research
This study explores the impact of China’s digital economy development on environmental quality. However, the results are subject to certain limitations. First, the study focuses on the development of China’s digital economy and environmental quality improvement. However, there are significant differences in economic development levels and environmental quality across various regions in China. Future research could conduct a more refined analysis on specific regions, such as Shanghai, Beijing, and other cities, to provide more accurate policy guidance. Second, China’s digital economy development is still in its early stages, with numerous interconnected factors influencing it. This study did not consider the impact of regional digital infrastructure construction and digital economy policies in the simulation analysis. Addressing and resolving these issues should be a focus of future research.
Footnotes
Abbreviations
BRICS: Brazil Russia India China.
CAICT: China Academy of Information and Communications Technology.
CLD: Causal loop diagram.
CO2: Carbon Dioxide.
COD: Chemical Oxygen Demand.
SO2: Sulfur dioxide.
CT: Communications Technology.
D1: Baseline scenario, The baseline scenario serves as the fundamental benchmark for adjusting other scenario parameters.
D2: The medium plan of the core scenario sets the digital economy growth rate at 13.2% .
D3: The high plan of the core scenario sets the digital economy growth rate at 15%.
E2: In the medium plan of the integrated scenario, the growth rate of the digital economy is set at 13.2%, the incremental of R&D capital and full-time equivalent of R&D personnel is increased by 5%, fixed assets investment in tertiary industry and employees in tertiary industry are increased by 5%.
E3: In the high plan of the integrated scenario, the growth rate of the digital economy is set at 15%, the incremental of R&D capital and full-time equivalent of R&D personnel is increased by 7.5%, fixed assets investment in tertiary industry and employees in tertiary industry are increased by 7.5%.
I2: The medium plan of the industrial structure upgrading scenario increases fixed asset investment in tertiary industry and employees in tertiary industry by 5%.
I3: The high plan of the industrial structure upgrading scenario increases fixed asset investment in tertiary industry and employees in tertiary industry by 7.5%.
T2: The medium plan of the technological innovation scenario is set with a 5% increase in R&D capital increment and full-time equivalent of R&D personnel.
T3: The high plan of the technological innovation scenario is set with a 7.5% increase in R&D capital increment and full-time equivalent of R&D personnel.
EKC: Environmental Kuznets Curve.
EPI: Environmental Performance Index.
GDP: Gross domestic product.
ICT: Information Communications Technology.
IPCC: Intergovernmental Panel on Climate Change.
R&D: Research and development.
STIRPAT: Stochastic Impacts by Regression on Population, Affluence, and Technology.
Author Contributions
All authors read and approved the final version of the manuscript. All authors contributed to the article search, data entry and validation. Zhenxiang Cao designed the methodology and wrote the first draft of the manuscript. And Liqing Peng conducted the analysis and reviewed the manuscript.
Declaration of Conflicting Interests
The author(s) declared no potential conflicts of interest with respect to the research, authorship, and/or publication of this article.
Funding
The author(s) disclosed receipt of the following financial support for the research, authorship, and/or publication of this article: A study on the Systematic Dynamic Path of Digital Economy Development to Promote Energy Saving and Emission Reduction in Anhui Province under the Goal of “Double Carbon.” (2022CX048). The financial was supported by Anhui Provincial Social Science Innovation and Development in 2022.
Ethical Approval
Not applicable
Data Availability Statement
Data sharing not applicable to this article as no datasets were generated or analyzed during the current study.