
Abstract
This paper aims to design a model that assesses the impact of digital marketing interventions on the finance and feasibility of Micro, Small, and Medium Enterprises (SMEs). The model developed in this study evaluates the most effective digital marketing alternatives to boost sales in line with the production capacity of the SMEs. The research methodology employs a system dynamic modeling approach to accurately represent the real system of SME X. The designed model comprises three subsystems: marketing, production, and finance, which are essential for assessing the feasibility of SMEs. Each subsystem includes interconnected variable elements linked through equations. Simulation processes are conducted using the system dynamics approach with 77 variables, three scenarios, and 16 alternatives, utilizing the Vensim application. The results suggest that digital marketing interventions effectively increase profits for small and micro-scale SMEs under conditions of high sales volume. However, when sales volumes are relatively low, conventional marketing proves more effective in enhancing profits. Effective digital marketing interventions significantly impact both profits and financial stability. The model’s originality lies in its ability to predict future conditions resulting from digital marketing interventions on profits and dynamic finance. The research’s novelty lies in generating new knowledge about effective digital marketing strategies.
Introduction
The rapid development of information technology is bringing significant changes to business activities and operational processes, driven by innovations in communication technology and digital media that are capable of globalizing businesses. Digital businesses enable all activities to be conducted using technology, including the online delivery of products to consumers through marketplace platforms. Digital marketing involves promoting products or services through internet-based digital platforms and information technology (Chaffey et al., 2009). Over time, research has shown that Small and Medium Enterprises (SMEs) are adopting digital marketing to sustain their businesses (Jadhav et al., 2023). This adoption is influenced by the rapid growth of social media, mobile applications, and other digital communication technologies utilized by contemporary society. The use of digital marketing and social media has become an integral element in supporting effective marketing strategies (Cambra-Fierro et al., 2021; Herhausen et al., 2020; Krings et al., 2021; Tarsakoo & Charoensukmongkol, 2020).
Companies strive to enhance their competitive position by creatively developing digital marketing strategies to attract customers and achieve growth. The utilization of digital technology to support operations and attract customers will become a crucial phenomenon in the coming decade, enhancing SME performance in global competition (Bortolotti et al., 2002; Jadhav et al., 2023; Smith, 2011). Research indicates that conventional marketing strategies are insufficient to support businesses in a competitive environment in achieving excellence and sustainable growth (Jadhav et al., 2023; Kaur, 2017). The increase in advertising budgets is evidence of the effectiveness of digital marketing in achieving market targets and growth. This involves increased sales volume, customer satisfaction, brand awareness, customer support, and reduced customer acquisition costs (Lamberton & Stephen, 2016; Tuten & Solomon, 2015).
Marketing capabilities, supported by digital technology, will determine an organization’s ability to explore customers, competitors, and the broader market environment (Day, 1994; Ribeiro-Navarrete et al., 2021; D. J. Teece, 2007). Marketing capabilities utilize various processes, where digital marketing can be employed to maintain customer relationships through best practices. These efforts aim to increase sales and company growth, influencing overall operational activities. Research indicates that marketing capabilities are a crucial input for operational capacity (Eisenhardt & Martin, 2000).
Digital marketing significantly impacts sales and company growth, despite the additional costs incurred. Marketing through social media platforms such as Facebook, YouTube, Twitter, Instagram, and other communication media accounted for $394.4 billion, or 55.3%, of global digital media advertising spending in 2022 and is estimated to increase by 7.2% in 2023 (Dentsu, 2023). Digital marketing business models include mobile marketing, e-commerce, cost per click, cost per mile, and cost per acquisition (Saura et al., 2022).
How effective is digital marketing in generating increased sales volumes and profits for Small and Medium Enterprises (SMEs)? Are the benefits proportional to the costs incurred for digital marketing? These are the research questions this paper addresses.
Various studies on digital marketing, as described above (Bortolotti et al., 2002; Cambra-Fierro et al., 2021; Herhausen et al., 2020; Jadhav et al., 2023; Krings et al., 2021; Smith, 2011; Tarsakoo & Charoensukmongkol, 2020), have not specifically addressed how and to what extent digital marketing interventions impact profitability. Whether there is a significant change in finances before and after digital marketing interventions has not been discussed in previous research. Additionally, in the dynamics of the system, the gap between marketing, production, and finance has not been addressed in earlier studies. There is a gap in understanding how various digital marketing interventions can specifically impact the financial performance of SMEs. This gap forms the basis for the urgency of this research and provides comprehensive and constructive reasons for conducting it.
Simulation modeling methodology is a widely used approach to understand the influence of interventions on a variable in a system. The System Dynamics methodology can provide important insights into how conditions, such as strategies, can affect the stability of the system in startup companies (Sastry, 1997). System Dynamics can also offer analyses and information from various perspectives for flexible strategy development (Bianchi & Bivona, 2002; Morecroft, 2007).
The system consists of interconnected elements in the form of variables that influence each other, where marketing is one variable influenced by others such as production, materials, labor, and finance. System modeling is a representation of the real system that allows for the control of elements within the system without disrupting the actual system, thereby enabling the identification of the best solutions from the system.
In this research, simulations are conducted on the designed model with various alternative scenarios using System Dynamics simulation. This paper aims to: (1) design a system dynamics model of marketing, production, and finance for SME X; (2) examine the impact of digital marketing interventions on profitability; (3) determine the best digital marketing alternatives for SME X. The novelty of this research lies in building a theory of effective intervention in digital marketing, addressing why, how, and when to achieve optimal results for the company.
Previous literature reviews generally state that digital marketing can enhance performance and competitive advantage but do not specifically address its impact on increasing profits. This paper explains how digital marketing impacts profitability, which can serve as a basis for determining digital marketing programs for SMEs.
The case study used to design the model involves a micro-scale SME producing soybean-based snacks, referred to as SME X. The challenges faced by SME X include barriers and constraints in business and digital marketing, where currently marketing is still conducted conventionally through orders and retail channels. SME X shares similar characteristics with other SMEs in Indonesia that face feasibility constraints in marketing, production, and financial aspects (Amornkitvikai & Harvie, 2018; Barringer & Gresock, 2008; G. Berry & Shabana, 2020; Chumaidiyah et al., 2024; Taylor, 2013).
Literature Review
Digital Technology and Digital Marketing
Progressively, digital technology has been employed in various activities of contemporary society. Companies use digital technology to coordinate all activities, enabling precise, efficient, and cost-effective control. Digital technology is employed not only for internal company operations but also to respond positively to customer needs. The use of technology can enhance the quality of information for company operations and provide customers with consistent and accurate information (Foroudi et al., 2016; Watson, 2006). Information quality involves integrated promotion, which includes branding consistency to support customers, product and pricing information with reliable images and product prices through retail channels, and integrated information transactions, which are sets of online customer transactions organized by retailers to provide personalized information and services (Gorla et al., 2010; Oh & Teo, 2010).
Digital marketing is a field that utilizes digital technology and social networks such as digital media, mobile devices, smartphones, the internet, and other technological tools to reach customers and promote a brand by communicating, creating, delivering, and maintaining values for stakeholders (Alford & Jones, 2020; de Amorim et al., 2022; Dias et al., 2021). Meanwhile, social marketing relies on marketing tools, techniques, and procedures to influence individuals or groups (Lee & Kotler, 2011), and/or broader upstream, midstream, and downstream interventions to influence systemic changes (Kennedy et al., 2018; Truong, 2017). Research indicates that the effectiveness of social marketing interventions at various points and times depends on the complex dynamic interactions and feedback loops (Saunders & Truong, 2019).
Dynamic Capability View
In an increasingly competitive era, companies must be prepared to face changes, such as adjusting to fluctuating market demands and corporate strategies. Most models and frameworks used to measure management performance focus only on tangible assets and static resources, making them less relevant when strategies change (Franco-Santos et al., 2012; Melnyk et al., 2014). Understanding the factors that influence the performance of a business or manufacturing process is crucial for evaluating and predicting the effectiveness of employed strategies (Suwignjo et al., 2000). Modeling approaches can introduce dynamism into the evaluation or prediction of performance.
Dynamic capabilities refer to a company’s ability to innovate, adapt to changes, and enhance itself to offer the best to customers while disadvantaging its competitors (Helfat & Peteraf, 2015; D. Teece et al., 2016). To manage uncertainty, organizations require strong dynamic capabilities. Dynamic capabilities are defined as patterns of collective activities that systematically generate and modify operational routines to achieve increased effectiveness, integrating internal and external competencies to address environmental changes (Winter, 2003; Zollo & Winter, 2002).
Capabilities arise from the use of human resources, assets, and processes, including the integration of internal and external resources (D. Teece et al., 2016). The interaction between elements in capabilities is interpreted using a system dynamics approach in a model. Hasegan et al. (2018) examined the use of cause-and-effect analysis in manufacturing systems to predict performance. According to them, exploring how resources are developed and maintained becomes a means of sustaining competitive advantage through dynamic capabilities.
Financial Performance Dynamic
The success of an organization is generally measured by its ability to generate profitability as a key aspect of financial performance. Resources and dynamic capabilities are managed to improve productivity and financial performance (Parker & Lawrence, 2021). To accelerate the development pace of SMEs, support from financial institutions that provide loans and other financial services is essential (Ajide & Ojeyinka, 2022). Financing provided by financial institutions for investment and working capital typically undergoes a feasibility study process to ensure the sustainability of the project (McLeod, 2021). The financing process for a project, originating from loans or equity, is used to fund productive activities, ultimately generating income as cash flow that circulates back as working capital and dynamically interacts.
Feasibility studies of projects using system dynamics modeling are suitable for dynamic environments, allowing for the flexible achievement of optimal results from multiple alternatives (Jo et al., 2015). System dynamics is employed as a model to depict the interrelationships and mutual influences among variables in the financial system. System Dynamics has gained popularity among researchers and practitioners as a practical capital budgeting method, particularly for assessing financial investments in IT and IS (Oesterreich & Teuteberg, 2020). System Dynamics can also be used to measure the impact of policies on finances, offering decision-makers the opportunity to create different financial policy models concerning various limiting variables applicable to each situation (Dabirian et al., 2023).
System Dynamics Simulation
System Dynamics was first introduced by Jay W. Forrester to address problems associated with the dynamic behavior of complex systems by understanding and measuring the impacts of interactions between system elements (Forrester, 1961, 1994, 1997; Sterman, 2000). To this day, the system dynamics simulation method has been applied in various disciplines, including management and economics (Radzicki, 2011). System Dynamics is used to simulate the financial systems of manufacturing companies, including key variables such as net cash flow, gross income, debt, and book value, and to study the dynamic behavior of variables before making decisions on expansion plans (Nair & Rodrigues, 2013).
The systems approach serves as both a methodology and an analytical framework for enhancing the understanding of system structures and behaviors, thereby facilitating the identification of practical action points related to decision outcomes (Shafieezadeh et al., 2020). System dynamics represents one of the methodologies employed within the systems approach (Cavana & Mares, 2004), and is integral to systems theory. Systems theory comprises a collection of statements aimed at elucidating various aspects of a system, including its characteristics, interactions, and activities, allowing for appropriate interpretation of these elements (Adams et al., 2014).
System Dynamics is regarded as the most important simulation method for understanding complex systems (Phelan, 1999). System Dynamics theory has long been used to model complex non-linear relationships. The use of simulation models based on System Dynamics is widely done by various researchers as a basis for decision-making in the public sector. System Dynamics is employed to simulate and predict the dynamic relationships between socio-economic development and environmental quality in a region (Jie et al., 2005). Another application is to evaluate the impact of sustainable transportation planning regulations (Sayyadi & Awasthi, 2017).
The use of System Dynamics in management differs significantly from static business models in terms of complexity, formality, flexibility, capturing capability, relationships, advantages, innovation models, new goals, up-to-date information, perspectives, and problem-solving abilities (Gozali et al., 2023). In the Kanban production system, System Dynamics offers advantages over fixed systems, especially in conditions with various demand uncertainties (Reddy et al., 2023).
In this study, a total of 77 variables were used, consisting of 12 variables in the production system, 20 in marketing, and 45 in the financial system. Variable identification was conducted based on the existing conditions of SME X and literature studies. Variables in the production system are supported by literature (Georgiadis & Michaloudis, 2012). Marketing variables are based on previous studies (Apasrawirote et al., 2022), while financial variables are derived from prior research (Dabirian et al., 2023).
Methodology
The systems approach is employed in this study for a better understanding of the structure and behavior of systems, aiming to identify the best practical actions for decision-making. Systematic thinking is an effective approach to address complex social and economic issues (Yeo, 1993). System dynamics are tools within a system approach suitable for understanding factors in the system and simulating behavior over time (Shafieezadeh et al., 2020). In this study, Vensim PLE version 9.3.5 x 64 software is utilized to model cause-and-effect relationships and causal loop diagrams.
Systems designed using a feasibility approach, such as for public investment, typically consider marketing, technical, financial, legal, and social feasibility (Abou-Zeid et al., 2007). System dynamics models are applied to public investment feasibility studies (Jo et al., 2015), depicting the relationships between components that form the benefits and costs of a project. Startup feasibility primarily considers market, technical operational, and financial aspects (Allen, 2016; Arvanitis & Estevez, 2018; ). Business feasibility is employed to examine whether the chosen option is viable as a commercial entity. In the context of small and medium-sized processing industries, technical and operational aspects of feasibility generally focus on production. Therefore, this study considers marketing, production, and financial aspects for feasibility assessment.
The case study used to design the model involves a micro-scale SME X that produces soybean-based snacks. The process begins with problem identification to explore the best alternatives for sales volume and production volume using various digital and conventional marketing methods. Variable identification is conducted by replicating the real system currently implemented in every process of SME X, covering production, marketing, and financial aspects. All variables and their interconnections within the model are identified for each process. The data used are derived from financial reports and interviews with SME representatives, with the research timeframe based on historical data over 12 months in the year 2022.
Variable Identification and Assumptions
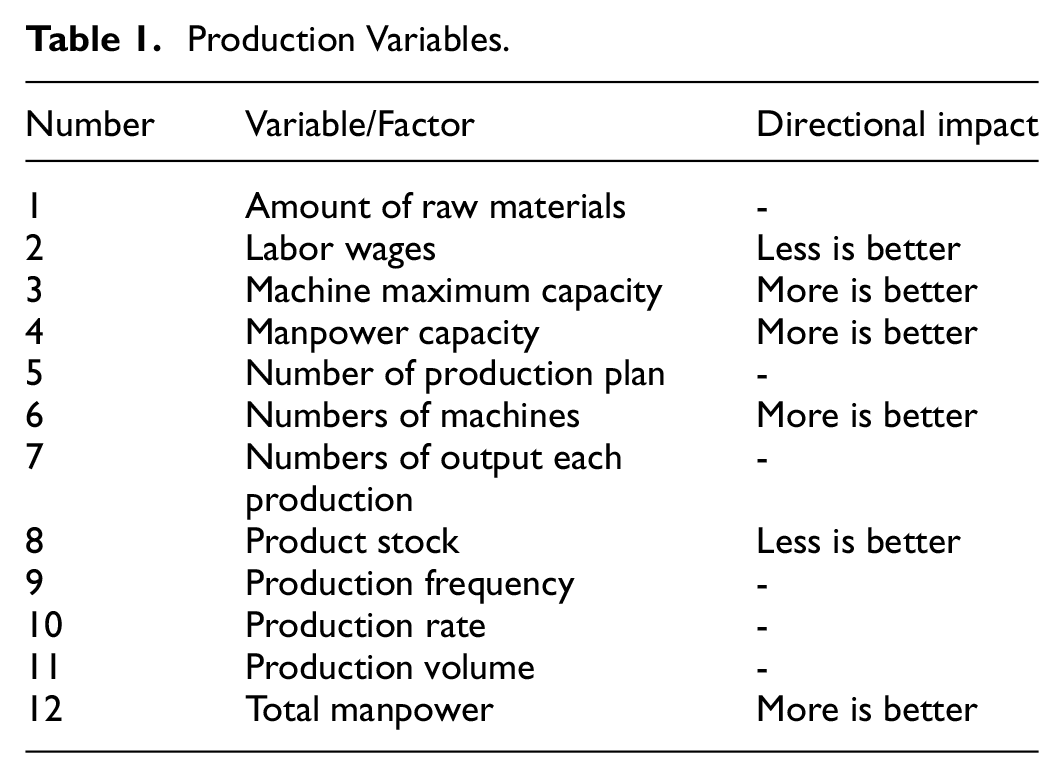
The model consists of three subsystems: marketing, production, and finance. Variable identification begins with the marketing subsystem, which comprises 20 variables; the production subsystem, which consists of 12 variables; and the finance subsystem, which includes 45 variables. The total number of variables used is 77. The production variables are shown in Table 1. These encompass raw materials used, labor requirements, machine capacity, product stock, production volume (quantity), and production rate (level). The production variables were generated based on the production system of SME X and supported by a literature review (Georgiadis & Michaloudis, 2012).
Production Variables.
In the marketing subsystem, 20 variables are identified, as indicated in Table 2. Marketing variables include, among others, FB advertising costs and frequency, TikTok advertising costs and frequency, marketplace advertising costs, number of clicks, offline sales volume, and online sales volume. The marketing variables were generated based on the sales system of SME X and supported by research studies (Apasrawirote et al., 2022). Waste product in the marketing system refers to products that are returned to SMEs because they have expired and were not sold.
Marketing Variables.

In the finance subsystem, 45 variables are identified, as shown in Table 3. Finance variables include administrative costs, general expenses, marketing costs, advertising frequency, raw material prices, labor costs, machine depreciation, revenue, funding, production costs, and more. The finance variables were developed based on the financial system of SME X and supported by research studies (Dabirian et al., 2023; Oesterreich & Teuteberg, 2020).
Financial Variables.

The limitations and assumptions used in designing the system dynamics model are explained as follows: The model is designed based on the system in SME X, relying on historical data from the year 2022. Data was obtained from production records, material inventories, labor reports, marketing and promotion records, financial statements, and interviews with the SME owner. Three scenarios are considered: pessimistic, moderate, and optimistic. The pessimistic scenario has the smallest initial sales volume, the moderate scenario starts with average sales volume, and the optimistic scenario begins with high sales volume. The marketing strategy involves five methods: conventional marketing through orders, conventional marketing through retail, digital marketing through Shopee (SH) marketplace, digital marketing via Facebook (FB) social media, and digital marketing through TikTok (TT) social media.
For conventional marketing through orders, there are no marketing costs, while the cost of conventional retail marketing includes transportation costs. Assumptions for digital marketing include advertising on the SH marketplace with a cost per click of Rp. 100, advertising on FB social media at Rp. 20,000 per use, and advertising on TT social media at Rp. 10,000 per use. This is based on the real advertising rates when the research was conducted.
The simulation model tests a total of 16 alternatives, comprising five pessimistic, six moderate, and five optimistic alternatives. The pessimistic scenario depicts minimum sales of SME X, the moderate scenario represents average sales of SME X, and the optimistic scenario portrays the highest sales according to the production capacity of SME X. The scenarios are tested based on sales volume and marketing strategy, implemented in five ways: two conventional methods (via orders and retail) and three digital methods (SH marketplace, FB social media, and TT social media).
Causal Loop Diagram (CLD)
The variables identified in the model are used to create a causal loop diagram that illustrates the relationships between one variable and another within the system (Cavana & Mares, 2004; Sayyadi & Awasthi, 2017; Sterman, 2000). This causal loop diagram represents the feedback structure of the system, consisting of variables connected by arrows that indicate cause-and-effect relationships among them. In the production subsystem, the diagram demonstrates the interaction of production factors such as machine capacity, raw materials, labor, and product inventory, all of which affect production volume and capacity. In the marketing subsystem, it represents the quantity of orders, sales volume, online sales via digital marketing, and conventional offline sales. Meanwhile, in the financial subsystem, it depicts the interdependence of all cost or expenditure elements and income from sales.
Figure 1 shows the causal loop diagram where a high-sales volume impacts profits significantly. The diagram illustrates the interconnections among marketing, production, and finance. It includes six feedback loops from the three subsystems: marketing, production, and finance. The model forms several balancing loop and reinforcing loops. The explanations for the six feedback loops are as follows:
(1) Loop 1 (R1), production sub system, with 5 participators:
Production Volume → +Product Stock →−Production Plan → +Amount of raw materials → +Production Frequency → +Production Volume
(2) Loop 2 (B1), production sub system, with 1 participator:
Total manpower → +Manpower Capacity →−Total manpower
(3) Loop 3 (R3), marketing sub system, with 2 participators:
Product Stock → +Number of product sample →−Waste product → +Product Stock
(4) Loop 4 (R2), marketing sub system, with 2 participators:
Production Plan → +Sales Volume →−Product Stock → - Production Plan
(5) Loop 5 (R4), financial sub system, with 4 participators:
Production Volume → +Sales Volume → +Sales Revenue → +Income → +Cost Production → +Production Volume
(6) Loop 6 (R4), financial sub system, with 2 participators:
Profit →−Cost Production → -Income → +Profit
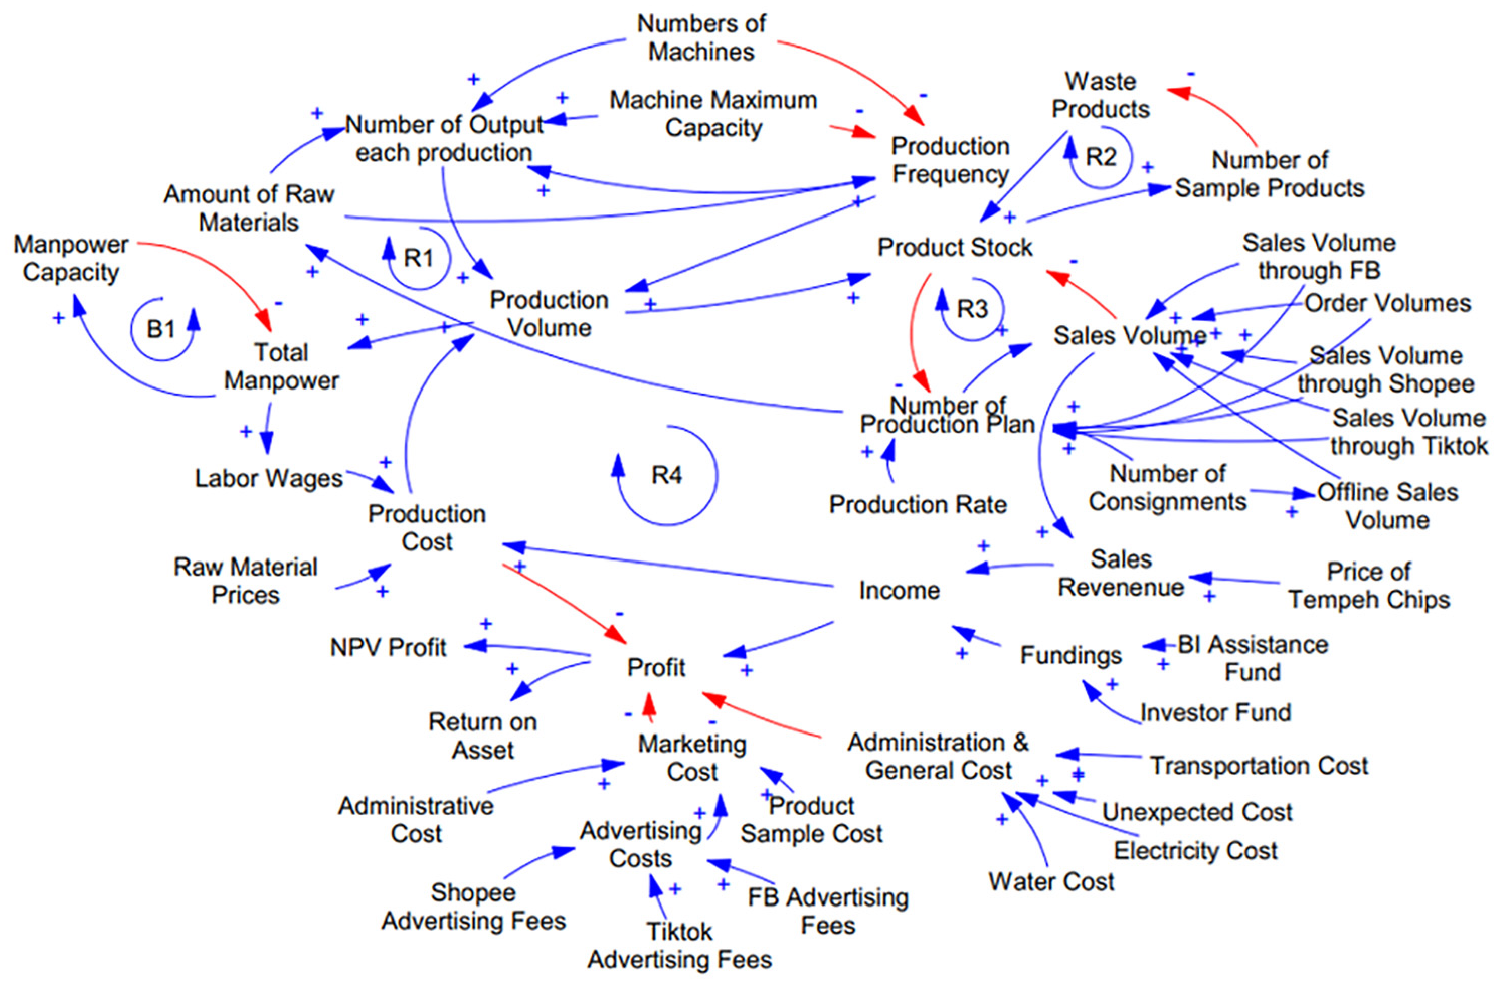
Causal loop diagram of SME X.
These feedback loops illustrate the cause-and-effect relationships. For example, in Loop 1, it shows that the higher the production volume, the greater the product stock available. If there is a high inventory of products, the production plan is reduced. With a reduced production plan, the demand for raw materials decreases. Fewer raw materials lead to a decrease in production frequency. If the production frequency is low, the resulting production volume is also reduced.
Stock Flow Diagrams (SFD)
Stock flow diagrams illustrate the rate of increase or decrease of a variable in the form of mathematical formulations, and the calculation results depict the model’s influence within the system. Stock flow diagrams reflect the system’s state and provide essential information for decision-making and action planning. It is crucial to create system dynamics that involve the stock structure and flow of system elements.
The stock flow diagram generated from the case study in this research is presented in Figure 2. This diagram shows the relationships between variables and their mathematical formulations. The time unit used for simulation is per month, with sales and profit projections made for the next 48 months. The equations in the production stock flow system indicate the interactions between production variables such as raw materials, machine capacity, labor capacity, production volume, and product stock.

SME X stock flow diagram.
The stock flow diagram of the production subsystem calculates the “number of production plan” based on the estimated product demand from the five marketing methods, both conventional and digital. The production plan quantity serves as the basis for calculating the needs for raw materials, labor, as well as machinery and equipment, with the following equations:

From the “number production plan’, the 'number of output each production” can be calculated, adjusted to the quantity of product demand. The equation for “number of output each production” is as follows:

Subsequently, calculate the “production rate” and “production frequency” with the following equations:

Calculate “production volume” and “product stock” through the following equations:

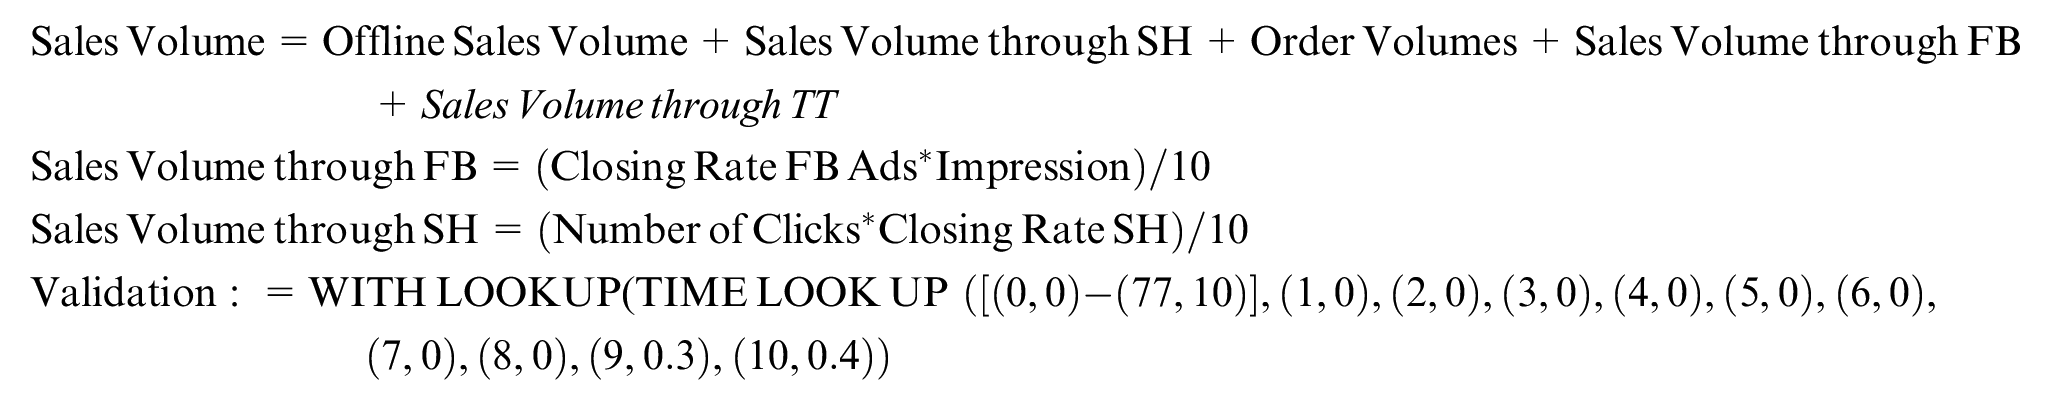
Equations in the stock flow diagram of the marketing subsystem show the interaction between marketing variables, including “closing rate FB advertising,”“closing rate SH,”“number of clicks,”“number of sample product,”“offline sales,”“order volume,”“volume order through SH,”“volume order through FB,” and “product stock.” In this flow diagram, the sales volume is calculated, representing the total sales from both offline and online channels. Some example equations are as follows:
Equations in the stock flow diagram of the financial subsystem show the interaction between financial variables, including administrative costs, advertising costs, overhead costs, raw material costs, labor costs, sales revenue, and profit. This flow diagram reconciles all expenditures and income within the system. Some equations in the stock flow diagram of the financial subsystem are as follows:

Verification and Validation
Verification and validation aim to ensure the conformity of the model with the real system. Model verification is carried out to ensure consistency between the model and dynamic hypotheses. The model verification process examines errors in the model and ensures that the model operates according to the logic of the system object (Sapiri et al., 2017). On the other hand, validation is an ongoing testing process that builds confidence in the model (Sterman, 2000). Thus, a model can be considered valid if its patterns can reflect the behavior of the real system. According to Barlas (1996), there are two common validity tests used:
a. Structure Validity
This test does not require simulation because it takes each relationship, whether it is a mathematical equation or any form of logical relationship, individually, and compares it with information available about the real system.
b. Behavior Validity
To compare the simulation output behavior patterns with the behavior patterns of the data, the following formulas are used:
i. Looking at the percentage error in the mean:

Where


A: Empirical Data
S: Simulation Output
N: Number of Data / Period
The model is considered valid if E1≤ 5%
ii. Looking at the percentage error in variation:

Where:


A: Empirical Data
S: Simulation Output
N: Number of Data/Period
The model is considered valid if E2≤ 30%
Model validation is conducted using Barlas validation, which includes structural validity and behavioral validity. The validation results indicate that all variables meet the criteria, that is, E1 ≤ 5% and E2 ≤ 30%, as seen in Table 4. Thus, it can be concluded that the model is valid and capable of representing the real system at SME X.
Model Validation.

Result and Analysis
The values of variables in the system can change over time due to the influence of the variable ratios involved in the system. Therefore, this case falls under system dynamics modeling. The designed system consists of three main feasibility-based subsystems: the production subsystem, the marketing subsystem, and the financial subsystem of SME X. This model can explain how interventions in digital marketing will affect production and impact profitability.
The simulation process is conducted using several alternatives to observe the impact of digital marketing sales at SME X, including pessimistic, moderate, and optimistic scenarios. The pessimistic scenario depicts minimum sales, the moderate scenario represents the average sales of SME X, while the optimistic scenario portrays the highest sales according to production capacity. The marketing system is implemented in five ways, including two conventional methods (via orders and retail) and three digital marketing methods (SH marketplace, FB social media, and TT social media).
At Low Sales Volume (Pessimistic)
In this scenario, the simulation is carried out by setting initial sales at minimum sales volume by SME X, with projected growth based on historical data. There are five alternative marketing scenarios in pessimistic conditions, as listed in Table 5:
Low 1: Conventional marketing via orders
Low 2: Conventional marketing via retail
Low 3: Digital marketing via SH marketplace
Low 4: Digital marketing via FB social media 1
Low 5: Digital marketing via TT social media 2
Alternative Scenarios Pessimistic.

aSocial media 1 is FB; social media 2 is TT.
The simulation results for pessimistic sales volume with the five marketing alternatives, as shown in Figure 3, indicate that the highest profits, in sequence, are obtained from the pessimistic scenario Low 1, Low 5, Low 2, Low 4, and Low 3. In conditions of low sales volume, the order of marketing methods that yield the highest profit is (1) conventional marketing via orders, (2) digital marketing via social media 2, (3) conventional marketing via retail, (4) digital marketing via social media 1, and (5) digital marketing via SH marketplace.

Profit for pessimistic sales.
Under these circumstances, conventional marketing provides higher profits compared to digital marketing because conventional marketing does not involve advertising costs. The cheapest advertising costs occur on social media 2, followed by social media 1, while the most expensive advertising costs are found on the SH marketplace. The pessimistic scenario Low 3 shows a negative trend because the advertising costs on the marketplace are greater than the profit from sales, resulting in a negative trend and loss.
Therefore, in conditions of low sales volume, the best alternative for SME X is to conduct 100% conventional marketing via orders. Conventional marketing via orders is more profitable than conventional marketing via retail, considering that conventional marketing via retail involves additional transportation costs and consignment systems. The money from sales is received by SME X several weeks after the products are sold. Moreover, conventional marketing via retail can also lead to the risk of returned products due to unsold items until the expiration date or waste product.
Accordingly, it is recommended to maintain and enhance relationships with customers who have placed product orders by phone, customers who come directly, and through word of mouth. Expanding and nurturing relationships with customers of SME X who have purchased products conventionally is a recommended strategy.
At Moderate Sales Volume (Moderate)
The initial sales volume is set based on the average monthly sales of SME X. This condition reflects the actual situation of the sales achievements obtained by SME X. In this average sales condition, six marketing scenarios are created, as seen in Table 6.
Alternative Scenarios Moderate.

Social media 1 is FB; social media 2 is TT.
The six alternative scenarios at moderate sales volume are described as follows:
Medium 1: Conventional marketing via orders 86%, conventional marketing via retail 13%, and digital marketing via SH marketplace 1%. This alternative corresponds to the marketing method currently applied by SME X, where most marketing is done based on customer orders.
Medium 2: Conventional marketing via orders 60%, conventional marketing via retail 20%, and digital marketing via social media 1 20%. This alternative shifts some conventional marketing via orders to digital marketing via social media 1.
Medium 3: Conventional marketing via orders 20%, conventional marketing via retail 60%, and digital marketing via SH marketplace 20%. This alternative enlarges the portion of conventional marketing via retail and digital marketing via the marketplace.
Medium 4: Conventional marketing via orders 50%, conventional marketing via retail 30%, and digital marketing via social media 2 20%. This alternative shifts some conventional marketing to digital marketing via social media 2.
Medium 5: Conventional marketing via orders 20%, conventional marketing via retail 20%, and digital marketing via social media 1 60%. This alternative focuses on digital marketing via social media 1.
Medium 6: Conventional marketing via orders 20%, conventional marketing via retail 15%, and digital marketing via social media 2 65%. This alternative focuses on digital marketing via social media 2.
The simulation graph results in moderate conditions with six marketing alternatives, as seen in Figure 4, show that the order of alternatives that yield the highest profit is Medium 4, Medium 6, Medium 2 and Medium 1 almost the same (overlapping), Medium 3, and the smallest is Medium 5. Medium 4 alternative provides the highest profit by shifting 20% of conventional marketing to digital marketing via social media 2. The second-highest profit is found in the Medium 6 alternative, which shifts 65% of conventional marketing to digital marketing via social media 2.
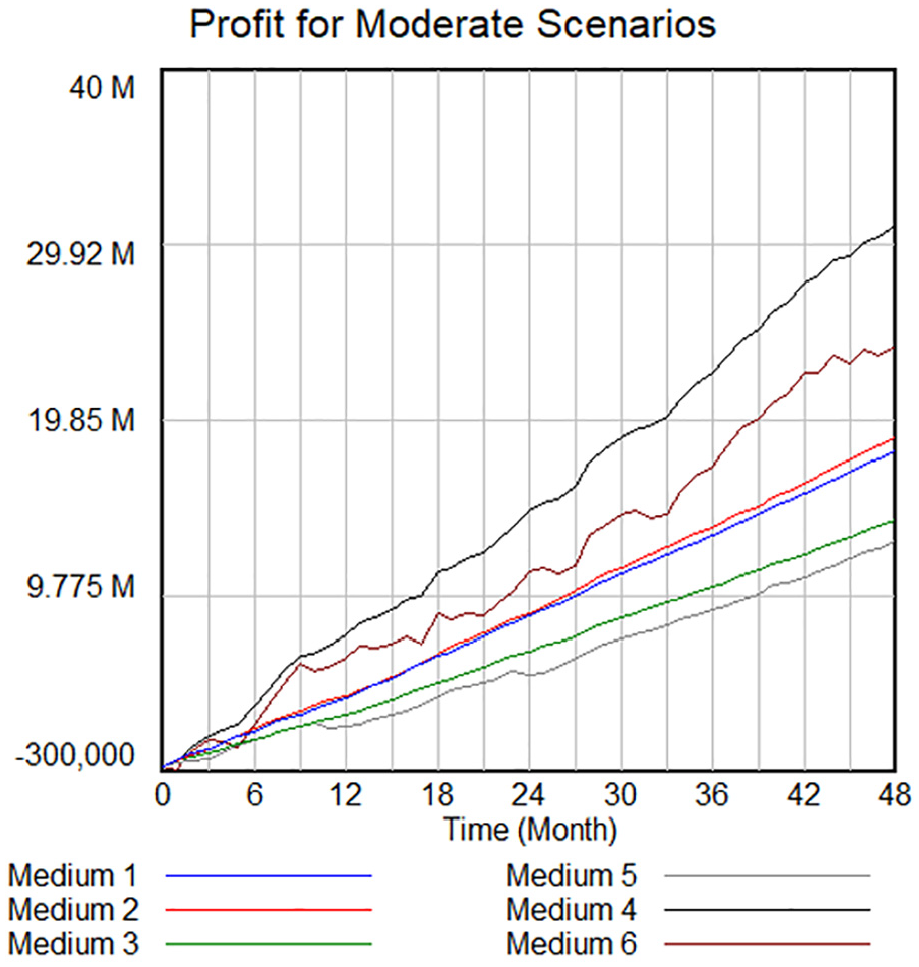
Profit for moderate sales.
The simulation results show that at average sales, conventional marketing by 80% and digital marketing via social media 2 by 20% can generate the highest profit. However, if the percentage shift to digital marketing via social media 2 is increased to 65%, a lower profit will be obtained. Therefore, in moderate conditions, SME X needs to maintain 80% conventional marketing, consisting of 50% orders and 30% via retail. Meanwhile, the remaining 20% can be done through digital marketing via social media 2.
At High Sales Volume (Optimistic)
In optimistic conditions, the initial sales volume is set based on the highest sales data, which is still within the production capacity of SME X. This scenario maximizes all available resources, including additional labor. Sales are assumed to be high by increasing the production rate to 265% of the current average conditions. Sales at high volume are carried out through conventional marketing, ranging from 25% to 40%, while digital marketing reaches 65% to 75% of sales volume. In this condition, there are five alternatives, as listed in Table 7. Assuming that the current conventional marketing is maintained at the current average production level (100%), an additional 165% production increase supports marketing through digital strategies. In this optimistic scenario, the production rate increase exceeds twice the average production volume or 265%.
Alternative Scenarios Optimistic.

Social media 1 is FB; social media 2 is TT.
The alternative scenarios in the optimistic condition in Table 7 show high sales volume conditions supported by digital marketing, maintaining conventional marketing at around 35% according to the current average conditions. In the optimistic High 1 and High 2 alternatives, digital marketing is focused on social media, while in the optimistic High 3 alternative, the proportion of digital marketing is evenly distributed among the three types of digital marketing used. In optimistic High 4, digital marketing is focused on the marketplace, while in optimistic High 5, the focus is on social media with almost equal proportions between the two social media platforms, social media 1 and social media 2.
The simulation graph results in high sales volume conditions (optimistic) with five alternatives, as seen in Figure 5, show that the five alternatives, which yield the highest profit in sequence, are High 2, High 1, High 5, High 3, and High 4, which provides the smallest profit. The highest profit is obtained from the optimistic High 2 alternative, namely conventional marketing via orders 20%, conventional marketing via retail 15%, and digital marketing via social media 2 65%. The second-highest profit is found in the optimistic High 1 alternative, with a proportion of conventional marketing at 35%, consisting of orders 20% and via retail 15%, while the remaining 65% uses digital marketing via social media 1.

Profit for optimistic sales.
In conditions of high sales, expanding sales through digital marketing via social media 2 and social media 1 provides higher profits than digital marketing via the SH marketplace. Sales through digital marketing on social media 2 yield the highest profit compared to the other two types of digital marketing. Therefore, SME X is advised to make efforts in digital marketing through social media, especially social media 2 and social media 1. Small companies like SME X need to increase production volume by at least twice the previous production to achieve significant profits through sales using a digital marketing strategy.
Discussion
Various literature studies on the effects of digital marketing on business organizations generally indicate that digital marketing is a key driver in increasing sales and profits, impacting financial and feasibility. The use of digital marketing and social media has become an integral element in supporting effective marketing strategies (Cambra-Fierro et al., 2021; Herhausen et al., 2020; Krings et al., 2021; Tarsakoo & Charoensukmongkol, 2020). Previous studies have not explored how digital marketing behaviors effectively enhance profits in companies of all sizes, including micro-scale SMEs. This represents a gap between this research and previous studies. This research demonstrates that for small-scale SMEs, interventions in digital marketing yield different effects compared to those in medium and large-scale SMEs. This is due to the low production volume of small-scale SMEs, making the impact of digital marketing less significant in increasing profits. To leverage digital sales, it is necessary to increase sales volume and production levels; furthermore, attention to product quality and competitive pricing is crucial. In digital marketing, quality and price are primary considerations for consumers.
The model designed in this research is based on the feasibility aspects of business, namely marketing, production, and finance, representing a real system in SMEs through simulation using a system dynamics method. The model consists of interconnected variables, validated based on historical data from 2022 for SME X. Limitations in the data used in the research affect the accuracy of the model in predicting or representing the dynamics of SME X’s system at that time. The complexity and abstraction of the system dynamics model design, although aimed at mimicking the real system, cannot capture every detail or aspect of SME X’s behavior accurately. Similarly, limitations in the system dynamics itself, such as assumptions, simplifications used, or inherent biases in the modeling approach, are present.
The novelty of this research lies in the model design to study the behavior of digital marketing interventions on the financial and feasibility of SMEs. The findings in this research state that conventional marketing works best at low sales volumes, while digital marketing performs well at high sales volumes. Furthermore, SMEs can use these findings for decision-making considerations in the marketing mix based on their sales volume situation, thus obtaining an effective marketing strategy.
In the cost-benefit analysis, it is evident that advertising costs for both conventional and digital marketing are components in the cost structure. Therefore, advertising costs for various marketing methods with different sales volumes will affect profitability. The need for optimization between costs and benefits through simulation of the causal loop model in this research includes administrative costs, advertising costs, overhead costs, raw material costs, labor costs, sales revenue, and profits.
Another limitation of the research lies in the validation and verification of the model, where verification and validation are conducted on the mathematical equations used in the stock-flow diagram. In future research, validation can be done by comparing the projection results of variables from the system dynamics simulation with historical data. Another validation approach can also involve comparing it with manually calculated results. The simulation scenario alternatives can still be further developed with more precise proportions between conventional and digital marketing to obtain optimal proportions. Additionally, in future research, this model needs to be tested and applied to other SMEs so that the model can be generalized.
Conclusion
This research simulates the effects of digital marketing on SME X, categorized as a micro-scale small business, under three predetermined sales conditions: pessimistic, moderate, and optimistic. In each of these sales conditions, five marketing alternatives were tested: (1) conventional marketing through orders, (2) conventional marketing through retail, (3) digital marketing through the SH marketplace, (4) digital marketing through social media 1, and (5) digital marketing through social media 2.
Simulation results for low or pessimistic sales volumes indicate that the alternative of conventional marketing through orders provides the highest profit, followed by digital marketing through social media 2, conventional marketing through retail, digital marketing through social media 1, and the lowest profit obtained from digital marketing through the SH marketplace. In low sales volume situations, conventional marketing is more effective due to the advertising costs involved in digital marketing through social media or the marketplace. Cumulatively, the cost per click advertising through the marketplace exceeds the cost per frequency advertising on social media 1 and social media 2. In situations of low sales, SME X should preferably engage in conventional marketing, especially through orders. For SME X, it is necessary to expand and maintain relationships with customers who have purchased products conventionally.
Results of the simulation process for average or moderate sales volumes indicate that conventional marketing still provides the highest profit compared to digital marketing. In this scenario, the highest profit is in the Medium 4 alternative, with 50% conventional marketing through orders, 30% conventional marketing through retail, and 20% digital marketing through social media 2. Thus, in average sales volume situations for SME X, digital marketing has not yielded significant profits.
Calculations of simulation results for high or optimistic sales volumes indicate that the High 2 alternative provides the highest profit, with the proportion of 20% conventional marketing through orders, 15% conventional marketing through retail, and 65% digital marketing through social media 2. Small-scale companies need to increase production volume by at least twice the previous production to achieve significant profits through digital marketing sales.
The novelty of this research lies in testing the impact of digital marketing interventions on the finances and feasibility of small-scale SMEs through system dynamics. The findings of this research state that conventional marketing works best at low sales volumes, while digital marketing performs well at high sales volumes.
Limitations of this research lie primarily in model validation, which needs to be done by comparing simulation projection results with historical data and manual calculations. Secondly, in alternative scenario testing, experiments need to be conducted on the model with other proportion alternatives of conventional and digital marketing to obtain optimal results. For future research, the model generated in this research can be developed and replicated for use in other SMEs, including medium and large-scale SMEs, so that the model can be generalized. However, model limitations, theoretical findings, differences in SME industry types or sectors, scale, and geographical location pose challenges in replication, requiring caution in drawing broad conclusions.
Theoretical Implication
The contribution of this research lies in the model design using system dynamics to understand the effects of digital marketing interventions on finance and feasibility, aspects not considered in previous studies (Bortolotti et al., 2002; Cambra-Fierro, 2021; Herhausen et al., 2020; Jadhav et al., 2023; Krings et al., 2021; Smith, 2011; Tarsakoo & Charoensukmongkol, 2020). Based on the causal loop of the model generated in this research, small businesses will be able to obtain information on business management, starting with production planning, financial management, and appropriate digital marketing methods. The development of digital marketing knowledge from this study reveals that at low and moderate sales volumes, digital marketing is not effective in increasing profits. Companies need to examine and consider the impact of digital marketing at these sales levels. However, at high sales volumes, digital marketing can significantly increase company profits. Conventional marketing works best at low sales volumes, while digital marketing excels at high sales volumes. The impact of digital marketing interventions on company profits is influenced by the volume of sales. Feasibility in marketing, production, and finance aspects become key considerations for companies when implementing digital marketing strategies.
Managerial Implication
For SMEs with a pessimistic scenario, meticulous planning of quantities, production stocks, and labor outlays is crucial to minimize waste products and costs. Additionally, employing conventional marketing can aid in cost reduction, enabling better financial control aimed at maximizing profits. In contrast, SMEs operating under a moderate scenario should focus on efficiently managing product stocks and production costs. It is essential to conduct conventional marketing while also monitoring unsold products. Additionally, allocating up to 20% of sales to digital marketing can significantly enhance profitability. On the other hand, SMEs with an optimistic scenario should operate at full capacity. This involves scaling up labor and production volumes by over 150% while maintaining efficient production costs. To achieve maximum profitability, it is recommended to implement a marketing strategy consisting of 35% conventional marketing and 65% digital marketing.
Footnotes
Funding
The author(s) received no financial support for the research, authorship, and/or publication of this article.
Declaration of Conflicting Interests
The author(s) declared no potential conflicts of interest with respect to the research, authorship, and/or publication of this article.
Data Availability Statement
The datasets used and/or analyzed during the current study are available from the corresponding author on reasonable request.