
Abstract
This study aimed to examine student motivation for honors programs using two types of motivation (autonomous and controlled) of Dutch traditional students, Dutch non-traditional students, and international students. Data were collected using Academic Self-Regulation Questionnaire (SRQ-A). K-means cluster analysis with autonomous and controlled motivation was conducted to identify the various types of motivation clusters. Subsequently, motivational profiles were compared using Analysis of Variance between Dutch traditional students, non-traditional students, and international students. Furthermore, associations between background variables and relative autonomous motivation of students to participate in the honors program were conducted. The response rate was 33.25% (n = 399). Four motivational profiles were identified: (1) HAMC (High Autonomous and Moderate Controlled), (2) HALC (High Autonomous and Low Controlled), (3) MALC (Moderate Autonomous and Low Controlled), (4) and MAMC (Moderate Autonomous and Moderate Controlled). Most of the honors program students in this study were represented in the good quality-HALC motivational profile. The findings also showed higher proportions of males (n = 71, 48%) and females (n = 120, 49.4%) in the good quality-HALC motivation profiles. Almost half of the students were found in the good quality cluster.
Plain language summary
This study aimed to examine student motivation for honors programs using two types of motivation (autonomous and controlled) of Dutch traditional students, Dutch non-traditional students and international students. Data were collected using Academic Self-Regulation Questionnaire (SRQ-A). K-means cluster analysis with autonomous and controlled motivation was conducted to identify the various types of motivation clusters. Subsequently, motivational profiles were compared using Analysis of Variance between Dutch traditional students, non-traditional students and international students. Furthermore, associations between background variables and relative autonomous motivation of students to participate in the honors program were conducted. The response rate was 33.25% (n = 399). Four motivational profiles were identified: (1) HAMC (High Autonomous and Moderate Controlled), (2) HALC (High Autonomous and Low Controlled), (3) MALC (Moderate Autonomous and Low Controlled), (4) and MAMC (Moderate Autonomous and Moderate Controlled). Most of the honors program students in this study were represented in the good quality-HALC motivational profile. The findings also showed higher proportions of males (n = 71, 48%) and females (n = 120, 49.4%) in the good quality-HALC motivation profiles. Almost half of the students were found in the good quality cluster.
Keywords
Introduction
Honors programs are becoming increasingly popular worldwide in higher education, and many universities including in the Netherlands have implemented them as well. Honors programs aim to attract the most talented and motivated students to unleash their intellectual abilities and to do something broader than their own university study. However, evidence about the quality of motivation (why do you do what you do) is limited. Previous research has also indicated that first-generation university students and minority groups have a lower likelihood to participate in honors programs (excellence programs) as compared to majority Dutch students, but the reasons for this are not known (Leest & Wolbers, 2021). Thus, the association of student’s background characteristics, such as being Dutch majority (traditional), non-traditional (first-generation university, ethnic minority background, lower parental educational level), or international, with participation in honors programs has not yet been quantitatively explored. This study combines these gaps in the literature, and aims to contribute to the empirical understanding of the quality of motivation (using Self-determination Theory framework developed by Deci & Ryan, 1985b) of Dutch majority (traditional), non-traditional, and international students for honors programs, and to explore which background variables are associated with the motivation for participation.
Honors Programs
Honors programs have been integrated as a special track in higher education globally. Many Dutch universities also offer honors programs in both Bachelors and Masters levels (Jacobs, Huijts, et al., 2021; Kool et al., 2017; Wolfensberger, 2015). These programs were designed to target most talented and motivated students. Previous studies illustrate that honors programs students are typically curious, constantly looking for additional challenges, and are intrinsically motivated (Scager et al., 2012). These programs are designed to enhance the personal, professional, and critical thinking attributes of motivated students through a challenging and demanding additional track along with their regular education (Jansen & Suhre, 2015). The learning experiences go beyond the standard curriculum as it often requires students to maintain high academic standards and engaged in extracurricular activities such as research, group activities with equally motivated and passionate students, and collaboration with faculty members. Students are engaged in different projects and assignments but also have the possibilities to work on their own projects (Jacobs, Huijts, et al., 2021).
The selection of students in the honors programs is primarily based on their GPA and motivation (Kool et al., 2017; van Rooij et al., 2018; Wolfensberger, 2015). However, most recent studies by Jacobs, Leest, et al. (2021) show that students are invited for an interview or are selected in the honors programs based on four characteristics: study-related side jobs, having traveled abroad or had an internship abroad, being involved in some volunteering work, and a GPA of 7.5 (out of 10) or higher. Research studies have demonstrated that such selection processes have created unintentional institutional biases and barriers and can negatively affect the representation of underrepresented groups in various programs (Fikrat-Wevers et al., 2023; Mulder, Wouters, Twisk, et al., 2022; Vietze et al., 2022; Wouters, 2020). We hypothesize that students coming from low socio-economic backgrounds and belonging to sociocultural or ethnic minority groups face systematic barriers (such as limited access to volunteering work or low resources for abroad travel) that could lower their chances of applying to and being selected to honors programs based on the criteria set for the selection to the programs. This is yet to be investigated.
Theoretical Framework: Self-Determination Theory (SDT)
Student Academic Motivation
Motivation has been frequently discussed in students’ learning and achievement studies. Studies have explored what accelerates student’s engagement in learning and how it could vary in level and types among individuals. Self-Determination Theory (Deci & Ryan, 1985a, 2000) highlights two motivational types among students which influence their academic outcomes: intrinsic and extrinsic. Intrinsic motivation is described as internal drive to complete a task for its own sake. Extrinsic motivation originates from external or internal pressure to obtain rewards, avoid punishment, please others, etc. Motivation for education and successful completion of educational programs has significant association with both intrinsic and extrinsic motivation. Intrinsic motivation is facilitated by inherent satisfaction; individuals finds the activity interesting and enjoyable (Ryan & Deci, 2017). Extrinsic motivation is distinguished into four subtypes: external regulation (e.g., parental pressure, obtaining rewards, and avoiding punishment), introjected regulation (e.g., internal pressure, guilt, and shame), identified regulation (value and endorsement of certain behaviour), and integrated motivation (internalization and assimilation with the self). Intrinsic motivation together with identified regulation forms autonomous motivation, whereas external and introjected regulations together form controlled motivation. Autonomous motivation is facilitated by experiencing autonomy (one’s own decision), competence (capability to doing something), and relatedness (sense of belonging) (Ryan & Deci, 2017) Figure 1 displays the conceptual model.

Self determination theory continuum.
The most recent SDT literature focuses on the concept of “flourishing”; it emphasizes that education should lead to flourishing of individuals through enhancing autonomous motivation. Flourishing comprises proactive agency by students, enhanced functioning, prosocial relationships, and psychological well-being (Ryan et al., 2023). Autonomous motivation is often labeled as “desirable motivation,” because a student then really wants to learn and enjoys this learning. While controlled motivation is labeled as “undesirable motivation” because a student engages in studying only in order to reach an external goal, for example getting a job (Kusurkar, Croiset, Ten Cate, 2013; Vansteenkiste et al., 2009).
Motivational Profiles
Based on the combinations of autonomous and controlled motivation, scholars have identified four motivational profiles (Kusurkar, 2023). These could be good-quality, poor-quality, high-quantity, low-quantity, or moderate motivational profiles (Howard et al., 2020; Kusurkar, Croiset, & Ten Cate, 2013; Orsini et al., 2018; van der Burgt et al., 2018; Vansteenkiste et al., 2009). A good-quality motivational profile is one in which autonomous motivation is high and controlled motivation is low, as it is associated with the most optimal study outcomes such as deep learning, self-study time, and academic performance (Vansteenkiste et al., 2009). Similarly, a high quantity motivation refers to the motivational type in which both autonomous and controlled motivation are high. Low autonomous and high controlled motivational profile is considered as poor-quality motivation and is associated with anxiety, procrastination, and low academic functioning (Zaccone & Pedrini, 2019). However, a motivational profile which has both low autonomous and low controlled motivation is considered as low quantity motivation. In few cases, studies have found moderate quality of motivational types in which both autonomous and controlled motivation are moderate (Gillet et al., 2013; Ratelle et al., 2007; van der Burgt et al., 2018).
Association of Motivational Profiles With Background Characteristics of Students
Many studies of students’ motivation for education have identified a variety of background characteristics (e.g., gender, ethnicity, parental education, socio-economic status, and others) as important factors influencing motivation (Gillet et al., 2013; Isik et al., 2017; Kool et al., 2017; Litalien et al., 2019). Some research reports that gender does not predict motivation for education (Litalien et al.,2019), whereas other studies indicate that female students show more autonomous motivation than males (Ratelle et al., 2007) and males report higher controlled motivation than females (Kusurkar, Ten Cate, et al., 2013). However, Zaccone and Pedrini (2019) in their study on student motivation and learning effectiveness of students for technical courses found that males were underrepresented compared to females in the good quality motivational profiles, whereas in the poor quality motivational profiles they were overrepresented. Similarly, international students have been found to be more autonomously motivated for education than the local students, which has been attributed to educational expenses and future career opportunities (King & Sondhi, 2018). Qualitative research has shown that culture-related factors in the educational environment, such as discrimination and lack of a sense of belonging, can negatively affect the motivation of students with ethnic minority backgrounds (Isik et al., 2017, 2021).
Prior Research on Motivation of Honors Program Students
This has been done in a rather broad way such as by using integrated indices, examining ability, motivation, and intellectual curiosity as one scale to measure the effects of honors programs on the participants (Jansen & Suhre, 2015; Kool et al., 2017). For instance, Kool et al. (2017) measured and compared the motivation of honors program students with non-honors students based on perseverance, mastery, and performance orientation. Ommering et al. (2021) examined motivational factors of students along with academic performance and extra-curricular researcher program (which is one of the honors programs). These studies emphasize the importance of focusing on motivation factors of students while selecting for honors programs rather than prior academic performance, while other studies have reported that selection on the basis of student motivation suffers from social bias and is not a valid tool for selection (Wouters et al., 2014). We conclude that it would be valuable to investigate motivational profiles and differences between autonomous and controlled motivations among students in order to: (1) examine student motivation for participating in honors programs, (2) inform initiatives to increase first-generation and minority students’ participation in the program (in this study termed as non-traditional students), and (3) develop effective program interventions. Furthermore, till date studies have focussed on perceptions, motivational factors, and effects of honors program on honors students (after they have enrolled into the program) (Jacobs, Huijts, et al., 2021; Kool et al., 2017). Research informing on the motivational types of honors programs students is rather limited.
Possible Inequalities in Participation in Honors Programs
In their study with over 1,000 students from five different higher education institutions in the Netherlands, Leest and Wolbers (2021) highlighted possible inequalities in the honors programs selection processes for first-generation university and ethnic minority background students. Identity representation has a major effect on students’ development. If students see role models who they can identify with (who look like them), they are more likely to imagine themselves belonging to that environment (Isik et al., 2017). MacDonald has highlighted challenges faced by honors program students who are first-generation university students, have a non-white ethnic background and have a lower socioeconomic status while completing their honors program (MacDonald, 2019). They have also made recommendations on how they can be helped by the institute where they are enrolled to tackle these challenges.
In general, little is known about student’s decision-making for honors programs, their motivational profiles and how these motivations differ between the various honors programs students. To understand students’ motivation for participation in honors programs, we explored the types of motivation students have and differences between sub-groups made on the basis of motivation.
Present Study
The paper aimed to explore the motivational profiles of honors program students. It further examines the differences in motivation among non-traditional Dutch students, traditional Dutch students, and international students. The current study contributes to the existing knowledge in two ways First, this study reports various motivational profiles found among honors programs students which is crucial to understanding students’ decision making and learning (Isik et al., 2017; Kusurkar, Croiset, & Ten Cate, 2013Vansteenkiste et al., 2009). Second, this study assesses the motivation of non-traditional Dutch students in comparison to the Dutch traditional and international students. The current study aimed to answer the following research questions: (a) What combinations of autonomous and controlled motivation do non-traditional students participating in the honors programs have in comparison to the traditional Dutch students and international students?, (b) What gender differences are observed in students’ motivational profiles for honors programs? (c) Which background characteristics are associated with the motivational profiles of student participating in honors programs?.
Method
Research Design and Setting
A descriptive cross-sectional survey was conducted amongst the honors programs students in the Bachelor programs at two universities in Amsterdam, the Netherlands. Students can generally apply for the programs in the last quarter of the first year of their Bachelor program, if their GPA is at least 7.5. The application procedures vary depending on the various disciplines at the university. The honors programs are conducted for 2 years. Students take several honors courses and each course has different assessment methods. The honors programs at the participating universities are designed to develop communication skills, professional skills, leadership, critical thinking and reasoning, research skills and skills to find possible alternative solutions for given problems. Students need to complete 30 European Credit Transfer System (ECTS) that they find interesting, which amounts to 4-5 honors courses. Most courses are taught in English.
Participants and Procedure
Honors program students were invited to participate in an online survey by using Survalyzer. The two schools, comparable in size and enrolment, were purposively selected. Prior to disseminating survey questionnaires to the participants, we contacted the honors program (HP) coordinators and student councils at both universities. The HP coordinators were informed, both orally and in writing, about the goals and objectives of the study. The HP coordinators sent out a general email to all the HP students about the study with a letter providing information about the research which included an informed consent form and links to the survey questionnaires. We also took HP student councils’ support for disseminating the information about the survey.
At both universities survey questionnaires were disseminated among Bachelor’s students (n = 1,200) who had just completed their honors program, and among those currently enrolled in honors programs. The program had both international and Dutch students. The data collection was performed during the COVID-19 pandemic from June until December 2021 and two email reminders were sent.
Participation was voluntary and had no consequences for students’ academic grades. Students were also allowed to ask questions, and request for clarifications about the research, for ethical reasons. To increase student participation in the study, the primary author attended student events, sent out information for student newsletters, and university newsletters. A €10 raffle was announced for every 10 students. The raffle was operationalized through an online platform, Survalyzer.
Data Collection
The 22-item survey was divided into two sections: background information and a questionnaire measuring individual motivation based on Self Determination Theory.
All students were asked to indicate their gender (e.g., male, female, other), students status (e.g., international or Dutch), country of birth, parents’ country of birth, language spoken at home with parents, and parents’ education level. We classified students’ ethnic identity based on their own and parents’ country of birth in alignment with previous studies: “Turkish/Moroccan/African, Surinamese/Antillean, Asian (Including Chinese), Western (including European, North American and Oceanian, Indonesian, and Japanese), and Other” (Isik et al., 2017). We adapted this classification for our study by adding Dutch as an additional category to differentiate the traditional Dutch students from non-traditional students.
We provided the following choices for parental education: Vocational Education (mbo), University of Professional Education (hbo), University of Science (wo), High School, No high school diploma, Other, and I don’t know to identify the first-generation students. Honors students were classified as “Netherlands,”“Europe EU (excluding Netherlands),”“Europe non-EU + Russia,”“North America,”“Asia,”“Africa,”“Latin America,” and “Other” to understand the backgrounds of the applicants. Similarly, Dutch Students were classified as “Traditional” and “Non-traditional” to examine the composition of majority, minority, and first-generation students.
The data on being a non-traditional student was compiled by combining the positive answers to first in their family to go to university and those who belonged to ethnic minority (Wouters, 2020). We assessed non-traditional Dutch participants’ characteristics of being first in the family to go to university by their parents’ highest completed level of education (van Rooij et al., 2018). Ethnic minority were classified into the following groups: “Turkish/Moroccan/African,”“Surinamese/Antillean,”“Asian (including Chinese),”“Western (including European, North American, Indonesian, and Japanese),” and “Other” as per the classification used by the Netherlands CBS (Central Bureau of Statistics).
In addition to students’ and their parents’ country of birth, we also asked participants how they identified themselves in terms of ethnicity. The answers to the students’ ethnic identity preferences were classified as “Dutch,”“Dutch and other,” and “Other.” The second classification “Dutch and other” was assigned for those students who identify themselves as, for example, both Dutch and Turkish. Similarly, the last category “other” was assigned to all the other ethnicities that did not fit into the previous two categories.
To measure motivation, we used a 16-item scale adapted from Academic Self-Regulation Questionnaire (SRQ-A) by Ryan and Connell (1989, p. 752). Each item was scored on a 5-point Likert scale (1 = “completely not important,” to 5 = “very important”). Each item followed the stem “I am participating in the university honors programs….” Example items were “…because I am highly interested in doing this” (autonomous motivation), “…because I would feel guilty if I wouldn’t do so” (controlled motivation). The measurement of motivation among university students using this instrument has been validated in several studies as well as captured in a summative chapter on SDT in HPE (see e.g., Isik et al., 2017; Kusurkar, 2023; van der Burgt et al., 2018).
Data Processing and Analysis
Data analysis was conducted using IBM SPSS version 20.00, setting the alpha level at .05. Missing values were handled pairwise per variable because of the small sample size (Newman, 2014). Reliability of the measurement using the questionnaire data was examined by calculating Cronbach’s alpha for internal consistency. The frequencies, percentages, means, and Standard Deviations (SDs) of all the variables were calculated. Subsequently, honors programs students were grouped into different motivational types using K-means cluster analysis.
As an initial step, the percentages of international, traditional, and non-traditional Dutch students were calculated. The motivation scores of AM and CM were converted into z-scores to perform cluster analysis. Outliers in the data were checked as cluster analysis is sensitive to outliers. Since we found only univariate outliers, we retained them in the cluster analysis (Leys et al., 2019). In order to examine the stability of the cluster solutions we used a double-split cross validation procedure (Vansteenkiste et al., 2009). The sample was randomly split into halves and K-means cluster analysis was performed and Cohen’s Kappa was calculated.
Using the analysis of variance, the variances of AM and CM scores explained by the clusters solutions were calculated. We performed nominal logistic regression analysis was performed to examine the associations between dependent and independent variables. This form of analysis is amenable not only to small sample sizes, but also to samples where the dependent variables have more than two categories. Multinominal logistic regression analysis are useful for the analysis of data generated in motivation studies as they help us to examine specific contrasts between the categories of each dependent variable and their association with the independent variable (Hermans et al., 2022).
The Relative Autonomous Motivation (RAM) was calculated by combining scores of both AM and CM to get an idea of the overall motivation or autonomous motivation. RAM was calculated in order to have an understanding of to what extent students’ motivation originates from their within (autonomous) and not from extrinsic factors (Kusurkar, Ten Cate, et al., 2013). The RAM is usually calculated by applying weights to each subscale of regulations (see e.g., Kusurkar, Ten Cate, et al., 2013). In this study, RAM was calculated in accordance with previous studies by applying negative weights to less autonomous regulations and positive weights to the more autonomous regulations to get the relative autonomous motivation using the following formula: RAM = (−2 * external regulation) + (−1 * introjected regulation) + (1 * identified regulation) + (2 * intrinsic motivation) (Howard et al., 2020; Kusurkar, Ten Cate, et al., 2013; Sheldon et al., 2017). Lastly, a two-way ANOVA was performed to investigate the association of background characteristics with RAM.
Results
Characteristics of the Respondents
A total of 399 honors programs students participated resulting in a 33.2% response rate. From the total 399 participants, 61.6% were female and 37.3% were male students, 43.2% were international students and 56.8% were Dutch students. Among the 225 Dutch students (56.8%), 58.2% (n = 131) were Dutch traditional students and 41.8% (n = 94) were Dutch non-traditional students. In our sample, the majority of international students participating in the honors programs were from Europe EU (excluding Netherlands) region (n = 106) followed by Asia (n = 22). The distribution of Dutch ethnic minority was 14.2% (n = 8) “Western (including European, North American, Indonesian, and Japanese),” 12.5% (n = 7) “Turkish/Moroccan/African,” 5.3% (n = 3) “Asian (including Chinese),” 3.5% (n = 2) “Surinamese/Antillean,” and 1.7% (n = 1) “Others.”
In addition, the majority (58.2%, n = 131) of Dutch students had at least one parent with university level education. Further, Dutch traditional (n = 127, 97.7%) and non-traditional students (n = 69, 73.4%) more often communicated in Dutch with their parents than other languages. Table 1 summarizes participants’ gender, educational level of their parents, students’ ethnicity, students’ ethnic identity preferences, and the language of communication with parents at home.
Characteristics of Honors Program Students.

Not applicable.
The Cronbach’s alpha for the measurement of autonomous motivation was .820 and for controlled motivation was .814 with the SRQ-A, which showed a good reliability. The total mean scores of 16 motivation items showed M = 3.050 and SD = 0.474. The total mean scores of autonomous motivation was M = 3.98 and SD = 0.595. Similarly, the total mean scores of controlled motivation was M = 2.12 and SD = 0.72.
Cluster Analysis
The K-means cluster analysis was performed to examine sub-groups of students. For the 394 students included in the analysis we tried 3-cluster, 4-cluster, and 5-cluster solutions. We also looked into the simple boxplot of distance of cases from its classification cluster center by cluster numbers and it showed few univariate outliers. We did not remove these outliers because univariate outliers do not influence the final clusters solution much (see for mores, Leys et al., 2019). The variance explained by the dimension of autonomous and controlled motivation was 87.7% and 86.0% for 3-cluster solution, 85.3% and 90.4% for 4-cluster solutions, and 83.5% and 91.4% for the 5-cluster solution, respectively. All cluster solutions were therefore above the 50% threshold for explained variance. Considering, however, that the 3-cluster solution explained the least variance and that 5-cluster solution was the least parsimonious solution, the 4-cluster solution was retained. The 4-cluster solutions are also favored by SDT and previous studies in education (see, e.g, Kusurkar, Croiset, Galindo-Garré, & Ten Cate, 2013; Vansteenkiste et al., 2009).
Additionally, the double-split validation procedure resulted in a similarly distributed 4-cluster solution, supporting the validity of the clusters. Cohen’s κ, performed to check the reliability between the measures, showed that Kappa is 0.025. Based on previous studies a Kappa (κ of 0.025, p = .328 represents slight reliability (McHugh, 2012). The 4-cluster motivational profile solution of honors programs students is depicted in Figure 2.

Retained 4-cluster profiles of motivation of honors student’s.
The retained cluster solution had four clusters (see Figure 2):
High Autonomous Moderate Controlled (HAMC): the high quantity motivation cluster (n = 73, 18.43%), with a high score on autonomous and a moderate score on controlled motivation;
High Autonomous Low Controlled (HALC): the good quality motivation cluster (n = 191, 48.23%) with a moderate score on autonomous and a low score on controlled motivation,
Moderate Autonomous Low Controlled (MALC): moderate quality motivation cluster (n = 46, 11.61%), with moderate scores on autonomous motivation and low scores on controlled the motivation
Moderate Autonomous and Moderate Controlled (MAMC): moderate quantity motivation cluster (n = 84, 21.21%), with a moderate score on autonomous motivation and a moderate score on controlled motivation (see Table 2).
Means, Standard Deviation (SD) of Motivation, Gender, and Distribution of Traditional and Non-Traditional Students for Motivational Types.

Note. HAMC = High Autonomous Moderate Controlled; HALC = High Autonomous Low Controlled; MALC = Moderate Autonomous Low Controlled; MAMC = Moderate Autonomous Moderate Controlled; AM = autonomous motivation; CM = controlled motivation; M = mean; SD = standard deviation; m/f = male/female; RAM = Relative Autonomous Motivation. The shaded cells show the distribution of motivational profiles and this is the universal format of showing findings of SD and others. The analysis of the table are provided below the table.
Motivational profiles among the different genders showed that the highest number of males and females were represented in the HALC motivational profile: male (n = 71, 48%), female (n = 120, 49.4%). We also investigated differences in the scores on autonomous motivation and controlled motivation between all four clusters using ANOVA. Significant differences were reported on both autonomous and controlled motivation between all four clusters p < .001.
Differences in Motivation Among Honors Programs Students
To evaluate the differences across motivational profiles between international and Dutch traditional and non-traditional students one-way Analysis of Variance (ANOVA) test was performed. The test revealed that student groups showed significant differences regarding their motivational profiles (F(2,393) = 3.168, p = .043). The Post Hoc test showed a significant difference between traditional students and international students, however, no significant differences were found between Dutch traditional and non-traditional students in any cluster.
To further investigate whether motivational profiles have any relationship with gender, students being first in their family to go to university, belonging to an ethnic group, and finally language of communication with parents at home, we calculated predicted probabilities for membership to one of the four clusters as mentioned above. A nominal logistic regression was performed to create a model of the relationship between the predictor variables (i.e., gender, first in the family to go to university, ethnic minority students, language of communication) and membership to one of the clusters. Table 3 presents the parameter estimates of the nominal logistic regression analysis performed. The fit of the model containing only the intercept had a −2 Log likelihood of 105.205, which was statistically not significant (p > .05). This implies that students’ motivation does not improve with the addition of this set of predictors. However, correlation between language of communication (in Dutch only) and cluster membership was statistically significant for cluster MAMC (p < .001). This implies that language of communication only in Dutch with parents has some association with the motivation of students falling in MAMC motivation profile for honors programs.
Parameter Estimates—Nominal Logistic Regression Analysis.

Note. B = logistic regression coefficient; Sig = significance (p-value); SE = standard error.
Bold value denotes that correlation between language of communication (in Dutch only) and cluster membership was statistically significant for cluster MAMC (p<.001).
In addition, a two-way ANOVA was performed to analyze the association of background characteristics with RAM of honors students (see Table 4 below).
Results of the Analysis of Variance to Check the Association of Background Characteristics With Relative Autonomous Motivation (RAM) as Dependent Variable.
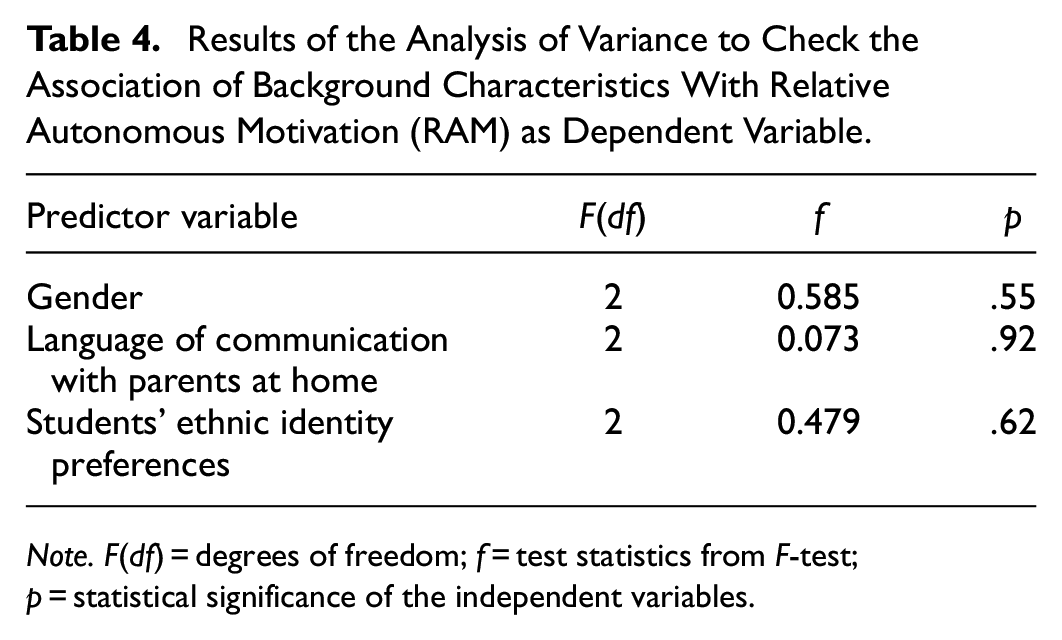
Note. F(df) = degrees of freedom; f = test statistics from F-test; p = statistical significance of the independent variables.
The results from simple main effects analysis showed that gender, language of communication with parents at home and students’ ethnic identity preferences did not have a statistically significant association with RAM of honors program students.
Discussion
In this study, we examined the honors program students’ motivational profiles and how they differ from each other. We also examined the gender differences and the association of background characteristics with students’ relative autonomy. To our knowledge, this study is the first to examine and systematically compare the motivations of Dutch traditional, Dutch non-traditional, and international students.
Regarding the first research question, we found four motivational profiles among the honors programs students in line with recent research: High Autonomous Moderate Controlled (HAMC), High Autonomous Low Controlled (HALC), Moderate Autonomous Low Controlled (MALC), and Moderate Autonomous and Moderate Controlled (MAMC). We found most of the motivational profiles similar to the study of Isik et al. (2017), however, we did not find profiles with the high controlled motivation profiles as found in the studies of Vansteenkiste et al. (2009) and Kusurkar, Croiset, Galindo-Garré, and Ten Cate (2013). Significant differences were found between international students and Dutch majority students, however, we could not find any differences in motivation between Dutch traditional and non-traditional students. The good quality motivational profile with high autonomous and low controlled groups were also found to have the highest number of Dutch traditional students (n = 64, 48.9%), Dutch non-traditional students (n = 42, 44.7%), and international students (n = 85, 49.7%). As expected, we found highest number of female students in the High Autonomous Low Controlled motivational profile, which was similar to Kusurkar, Croiset, Galindo-Garré, and Ten Cate (2013). This suggests that more autonomously motivated students participated in our study and/or in the honors programs. This is in alignment with SDT and previous studies (Isik et al., 2017; Kusurkar, Croiset, Galindo-Garré, & Ten Cate, 2013; Vansteenkiste et al., 2009). Not finding students with low motivation in this sample is not surprising because the students need to be highly motivated for taking extra courses voluntarily.
Concerning the second research question, there was no significant relationship between gender and the retained motivation clusters. Similarly, there was not enough evidence to show a significant relationship between students’ background characteristics and the four retained clusters. However, Moderate Autonomous and Moderate Controlled motivational profile students seemed to be associated with speaking mostly Dutch with their parents at home, in addition to their intrinsic interest for the programs. Similar findings have not been reported by previous studies in relation to the language spoken at home with parents and students’ motivation. Since this association cannot be theoretically explained and does not have any theoretical significance, it is likely that this is a chance finding.
Finally, regarding the third research question, simple main effect analysis showed that the background characteristics did not have a statistically significant association with RAM of honors program students. In our sample, students’ gender, ethnic identity preferences, and language communication with their parents at home were not associated with relative autonomous motivation of honors program students. Some studies have reported that background characteristics such as gender have no association with autonomous motivation of students (Litalien et al., 2019; Zaccone & Pedrini, 2019), while another study has reported higher controlled motivation among male students (Kusurkar, Croiset, & Ten Cate, 2013). In our study we did find higher proportions of females in High Autonomous Low Controlled group, in line with findings from Kusurkar, Croiset, Galindo-Garré, and Ten Cate (2013).
Our study suggests that high autonomous motivation profile students look for more challenges and therefore, are highly interested and curious in enrolling for honors programs. This is supported by previous studies that have indicated autonomous motivation is associated with students’ high interests in honors programs (Scager et al., 2012). However, studies have also found that higher grades and additional activities such as study or travel abroad, side jobs, and volunteering experiences play a crucial role in the selection process (Jacobs, Leest, et al., 2021). This may result in highly motivated non-traditional students to be discouraged to apply or to have lower chances of getting selected in these programs because they lack possibilities to obtain these experiences. Such actual as well as perceived inequalities have been reported in earlier research on students from Health Professions Education (Fikrat-Wevers et al., 2023; Mulder, Wouters, Twisk, et al., 2022; Vietze et al., 2022; Wouters, 2017, 2020). Rather than focusing on students’ resumes, honors programs should also find a way to recruit and admit eligible non-traditional students. For example, they could invite nearly all the applicants for an interview for better assessment. Research has also indicated that experiences in the educational environment related to sociocultural factors can demotivate non-traditional students and prevent them from performing to their full potential (Isik et al., 2021). Although some students are able to overcome such struggles and retain their motivation, universities should be aware of these mechanisms and ensure an encouraging environment in which non-traditional students feel supported and able to successfully participate in honors programs.
Limitations
The scope of this study was limited in terms of low response rate, therefore, the generalizability of the findings should be done with caution. The low response may be attributed to the timing of the research study and the COVID-19 pandemic. The number of females participating in the survey were higher than the males, however, this did not have any significant impact on the results in terms of gender. Another limitation is that we did not measure amotivation. In few research studies on motivational profiles, amotivation has been measured together with controlled and autonomous motivation (Gillet et al., 2017). It would be interesting to see if similar motivational clusters emerge if all the motivational regulations are included in the analysis. In this study we could not measure the first in the family to go to university among international students as the questionnaire set on the parents’ educational level were based on the Dutch educational system.
In addition, there could be possible social desirability-bias of students. Although the questionnaires were anonymous, students still might have given socially desirable answers as students unconsciously or consciously see autonomous motivation as good and controlled motivation as bad. There could also a be response-bias, that is, the more autonomously motivated students might have participated in the study survey which shows the high autonomous motivated students participate in the honours programmes.
Future Research
Reports have shown that high dropout rates among honors programs students (Vrije University & University of Amsterdam, 2020). Of the 252 students who started in 2018 to 2019, 131 (52%) dropped out of the programs. We were not able to compare the motivational profiles of successful honors programs students and the motivation of the dropouts. Future research could measure the motivation of honors programs graduates and dropouts in relation to their background characteristics. This will also help to come up with strategies to retain the number of students throughout the program.
Furthermore, honors programs students come from diverse educational backgrounds and this study did not measure students’ motivation as per their disciplines (e.g., medical students, law students, social science students, etc.). In addition, we could not measure if international students were first in their family to go to university, students’ age, socio-economic backgrounds, which makes it difficult to generalize the results. Therefore, more research involving motivational profiles of honors students with diverse educational, ethnic, and socio-economic background is needed before general conclusions can be drawn.
Conclusion
The current study examined the various motivational profiles in honors program students. Our research found four motivational profiles characterized by different degrees of autonomous and controlled motivation. Almost 50% of the Dutch traditional, non-traditional, and international students were found in High Autonomous Low Controlled cluster, which as per SDT is the desirable type of profile. Honors programs students’ background characteristics are not related to motivation for enrolment in the program. The study provides useful information which could help for more research on honors programs. It would be interesting to see how motivation of the students differ based on disciplines, socio-economic backgrounds, and ethnicity across international students, in future studies on honors programs students.
Footnotes
Acknowledgements
The authors would like to thank the participants of this research, the Honours Students Councils and Honours Students Coordinators Eva Meijerink at Vrije University Amsterdam and Iris Bijman at University of Amsterdam for their immense support and coordination in this research. Special thanks also goes to Dr. Emmanuel Abaith from Gent University for his suggestion on the additional statistical analysis.
Author Contributions
Conceptualization: RK, AW. Data collection: NB. Formal analysis: NB. All the analysis and results were discussed with the team. Writing original draft: NB. Writing-review & editing: NB, AW, RK.
Declaration of Conflicting Interests
The author(s) declared no potential conflicts of interest with respect to the research, authorship, and/or publication of this article.
Funding
The author(s) received no financial support for the research, authorship, and/or publication of this article.
Ethical Approval
The Medical Ethics review Committee of VUmc-number 2021.0111.
Data Availability Statement
Data will be made available upon request.