
Abstract
Developed countries have adopted the circular economy concept to solve environmental problems. This study underpins the paradox theory to investigate the circular economy’s implementation status in the ASEAN region through the circular economy index. The circular economy index disclosure data for top companies in the ASEAN region was collected through an automated content analysis approach using DICTION on the annual/sustainability reports. The findings show that most public companies from the ASEAN region disclose the circular economy indicators in their annual/sustainability reports. The environment-sensitive firms are disclosing the circular economy indicators actively compared to the non-environment sensitive companies. Based on the results, this study provides theoretical and practical implications. This study is also limited because it is based only on the ASEAN region. Future studies can underpin other theoretical support and provide a comparative analysis across the continents.
Plain Language Summary
This study used paradox theory to investigate the implementation of circular economy in the selected ASEAN countries. The study used circular economy index to collect data from the selected ASEAN companies. The results showed that environment-sensitive firms are disclosing the circular economy indicators actively compared to the non-environment sensitive companies. The study’s findings has implications for the companies to actively implement circular economy concept and highlight any issues and limitations.
Introduction
An organization is said to be socially sustainable when the designed system meets current stakeholders’ needs and helps to maintain a healthy community for future generations. In a market-based capitalistic society, corporations need to remain active in the system and economically viable. Economic growth directly results from production system efficiency, which is promptly consuming natural resources. The traditional business system will continue natural resource exploitation till they reach a critical limit. The circular economy concept has introduced new paths to disengage resource consumption and economic development. It breaks the bottleneck of resources and the environment (Wang et al., 2018). The concept of the circular economy is directly linked with sustainable performance. It depends on the production system innovations, including transforming the whole supply chain (Singh & Ordoñez, 2016).
Individuals, persons, companies, or countries cannot improve sustainability; it is a collective venture. There is a need for a revised and balanced approach to defining the ways of human interaction with the environment (Caradonna, 2022). Carbon Disclosure Project (CDP) provides a global system for organizations and cities that help manage and share important environmental information. CDP motivates companies to disclose their potential impact on the natural resources environment and take actions for its reduction (Climate action and profitability CDP S&P 500 Climate Change Report, 2014). Businesses use natural capital to sustain their existence. Depletion of natural resources represents massive potential costs for businesses.
Environmental assets, including native forests, water, and clean air, are public goods and are not exchanged in market transactions. It is not easy to measure their use even when it is vital for commercial processes. For example, certain manufacturing processes use water and air, which are returned to the environment with a reduced quality. The entities do not recognize this reduction in the quality of natural resources, as these depletions do not meet the definition of assets and expenses. Chartered Institute of Management Accountants argued that natural capital would be an important concern for businesses in the 21st century (Natural Capital Accounting, 2019). It will simultaneously be a risk and opportunity in growing markets. Old financial reporting is insufficient, shifting toward non-financial reporting across countries and regions. Public bodies have an important role in designing new policies for this procedural change and imposing new reporting requirements on organizations. KPMG analyzed 4,100 companies globally, including the 250 largest companies, and concluded that CR reporting is standard business practice worldwide (KPMG, 2013). They further commented that this rising trend is due to increased regulatory requirements; some managers voluntarily adopt these new reporting practices or respond to the stakeholders’ better informational needs.
In light of the arguments above, this study proposes the circular economy as a possible solution to environmental problems, but its implementation in the countries severely hit by the environmental issues is under-researched. A circular economy index was adapted from Geng et al. (2012) using paradox theory as a theoretical underpinning. The matrix is adapted from Geng et al. (2012) because its indicators are similar to the GRI sustainability reporting themes. Since the objective of this study is to analyze the implementation status in ASEAN’s top-performing companies, it is deemed suitable. The firms from the ASEAN region were selected as a sample of this study. An automated content analysis was performed using DICTION software on the sample firms’ annual/sustainability reports. The overall research question that this study aims to answer is as follows:
What is the extent of the circular economy implementation in the ASEAN region?
The forthcoming sections of this study are categorized as follows. The motivation of this study is discussed in Section 2. The relevant literature is discussed in Sections 3 and 4 explain the research framework of this study. Section 5 discusses the research methodology used to operationalize the research framework. The findings are presented in Section 6, and the discussion of the findings is presented in Section 7. The last section concludes this study based on implications, limitations, and future research direction.
Motivation of the Research
Society expects that a business’s operating activities are not harmful; they are sustainable and positively impact society. According to the guidelines of the regulatory bodies, businesses must adopt environmentally sustainable practices. The World Business Council for Sustainable Development emphasized that different environmental issues significantly affect organizational profitability. Market growth directly affects revenues, which depends on customers’ concerns about environmentally sustainable production methods. Sustainable and efficient production methods enhance organizational productivity by fewer inputs and associated costs. Seventeen sustainable development goals (SDGs) are included in the agenda of 2030 of the UN General Assembly, which is based on the principles of “leaving no one behind” and efficient resource management. The sixth goal of agenda 2030 is protecting and restoring the water-related ecosystem, which will enhance water use efficiency and quality. It is also desired to sustainably manage natural resources by reducing, recycling, and reusing waste or preventing waste generation. SDGs also encourage organizations to go for sustainable practices in their operations and include sustainability information in their reports. Adopting SDGs in the strategic decision/policies is the obligation of companies toward people and the planet, ultimately adding to long-term success.
United Nations Global Compact is the largest voluntary initiative of corporate citizenship, which will help the private sector manage risk and explore opportunities in social, environmental, and governance domains. The minimum requirement of corporate sustainability is to cover the fundamental responsibilities in anti-corruption, labor, human rights, and the environment. Environmental management has a specific emphasis on materials and materials-driven particles. The cause for this focused emphasis is the use of natural resource, materials, energy, waste generation, and emission that directly affects the environment. Organizations purchase materials and use resources to convert them to finished goods for their customers. But the manufacturing process generates waste due to operational efficiencies or upraising product quality. In addition, some energy, materials, and resources are not intended to convert into the final product but are used to manufacture the product. These eventually generated waste streams that need to be managed for sustainable operations.
Global environmental degradation and strategic development goals forced organizations to adopt a proactive approach and have a cleaner production system by adopting the circular economy (Aranda-Usón et al., 2019). For example, less material consumption can achieve a constant production level by reducing waste generation or reusing recycled material (Gao & Bansal, 2013). SDGs also encouraged companies to include sustainability-related information in their reporting cycle. However, the relationship between circular economy and sustainability reporting is not well known. Hence there is a need to provide empirical facts about reporting circular economy indicators in publicly available information, that is, annual/sustainability reports.
Literature Review
Circular Economy
Different authors added to the definition of circular economy as an innovative advanced economic model with a scope of reduction in raw material use by reuse of products and waste (Crossan et al., 1999). The strategy to modify the linear consumption system to a circular system for economic sustainability (Smith & Lewis, 2011) and the industrial system, which replaces the concept of end-of-life (EOL) and eliminates the use of products that harm the environment (Homrich et al., 2018). It reduces the linearity of the production-consumption system, which reduces the flow of materials (Lacy et al., 2019), system with minimum losses of materials and energy through recycling, reuse, and recovery (Hobson, 2016; Murray et al., 2017). Based on the above concepts, the circular economy is a shift of linear production-consumption systems focusing on reducing the flow of virgin materials, energy, and natural resources in manufacturing.
The circular economy concept was first introduced by Pieroni et al. (2019). They pointed out that the traditional open-ended economy has no built-in tendency to recycle, which treats the environment as a waste reservoir. They called for a need to envisage earth as a closed economic system to overcome resource scarcity and environmental problems where the economy and environment are not linear inter-linkages but are regarded by circular relationships (Boulding, 1966, Abou Taleb & Al Farooque, 2021). According to Egypt Business Director (2018), the concept of the circular economy is based on “take, make, and reuse” with the 3R principle of recycling, reusing, or reducing materials based on the characteristics of low consumption, low emission, and high efficiency Zeng et al. (2017) argued that the circular economy’s principal objective is curtailment in the flow of materials, efficient use of energy, and the revival of social and natural capital. In the circular economy, resources, that is, materials and products, remain in the marketplace for the maximum possible time by minimizing the use and waste of resources (Tura et al., 2019). The circular economy framework clearly defines the link between reductions in the use of natural resources, the environment, and the economy (Haas et al., 2015). It gives a collective view of the environment, economic benefits, and resources (Linder et al., 2017). The ultimate objective is to achieve zero waste disposals through the reuse and recycling of waste, which contributes to the environment and sustainability (Tura et al., 2019).
The use of waste for economic benefit is significantly dependent on separated waste collection and identification of municipal waste (Tura et al., 2019). Municipal waste management should be cost-effective, profitable, socially acceptable, and environmentally sustainable (Manninen et al., 2018). A principal barrier in waste management planning is the lack of accurate information on waste collection, composition, and treatment (Taleb & Al Farooque, 2021). Haas et al. (2015) argued that a circular economy would promote high-value material cycles once fully developed instead of traditional recycling.
The circular economy is an emerging topic. Prior studies explored the firm’s role at the micro-level (Lieder & Rashid, 2016) and macro-level (Mokhtar et al., 2016). A business’s transformation from a traditional linear production-consumption function to a circular consumption system needs an evolutionary process (Merli et al., 2018). The firms adopting a circular economy will undergo organizational learning, which will occur gradually (Daddi et al., 2019). There is limited research on the crucial factor in the circular economy’s success in businesses (Yuan et al., 2006). The adoption process has already been proactively experienced in eco-innovation and environment management (Gavana et al., 2016).
Previously, firms placed value purely upon commercial motive, which is valuing customers that are encased in the shape of profit in the market (The ASEAN Post, 2020). The business model discusses environmental and social aspects as a value logic (Dentchev et al., 2018). The business model for sustainability has emerged due to social inequalities in society and the degradation of the environment (De Angelis, 2021) to achieve a socially and environmentally sustainable economy (Sánchez-Ortiz et al., 2020; Short & Palmer, 2008). Sustainability is not dependent only on the process and product innovation but rather on altering the value creation system (Sánchez-Ortiz et al., 2020; Wells, 2016). In the academic business model, innovation is a distinct area that got practitioners’ attention (De Angelis, 2021). Businesses are unhurried in accepting circularity principles (Babbitt et al., 2018; Pauli, 2010) because of various challenges (Kirchherr et al., 2017; Urbinati et al., 2017).
Circular Economy and Reporting
The existing literature is currently exploring a conceptual link between circularity and environmental value creation (Mathews & Tan, 2011). There is a strong emphasis on deriving methods to evaluate environmental, social, and economic sustainability in business models (Bocken et al., 2016; Ellen MacArthur Foundation, 2014; Pearce & Turner, 1990) and circularity indicators (Malinauskaite et al., 2017). However, little is known about how companies place the circular economy concept in their strategic sustainability position and measure circular economy indicators (Strasser, 2000). The corporate governance framework ensures that companies disclose accurate and timely information on all material issues; companies disclose their non-financial information through auxiliary reports (Strasser, 2000). For example, companies disclose circular economy indicators regarding “3R” (Kojima, 2016) in their corporate sustainability reports (Strasser, 2000). Despite the disclosure of circular economy indicators, empirical evidence is lacking on the extent of alignment between sustainability indicators, otherwise known as the triple bottom line, and circular economy (Huppes & Ishikawa, 2009). Therefore, based on the literature review gaps, this study proposes the research framework in the next section.
Research Framework
Scholars are investigating to conceptualize the discussion of the circular economy. The theory is indispensable in understanding the circular economy (Katz-Gerro & López Sintas, 2019) or its phraseology (van Bommel, 2018). In the available literature, the concept of circular economy has been discussed under the theoretical assumptions of various theories that include stakeholder theory (Welford, 1998), the resource-based view (Aranda-Usón et al., 2019), institutional theory (Zeng et al., 2017), business model theory (Ring, 1997) and dynamic capabilities view theory (Kirchherr et al., 2018). Despite many previously available theories, Parida et al. (2019) argued that the circular economy requires reconsideration of the theoretical underpinning.
Paradoxes and Production System
Paradox theory has been used as theoretical support in recent studies matching the circular economy concept. For instance, it has been discussed in corporate sustainability literature (Hart, 2000; Jelinski et al., 1992). Paradox theory has recently been discussed in the circular economy and business model literature (Daly, 1996; Walls & Paquin, 2015). Paradoxes are incompatible but interrelated elements (Stahel, 1982). The features of the circular economy can explain the suitability of paradox theory. Both concepts are depended on complex systems (European Commission, 2014). Lewandowski (2016) argued that the circular economy is a “systemic” and “revolutionary” approach that decouples economic growth and natural resources pressure. Therefore, circularity is likely to raise several organizational paradoxes.
One of the organizational paradoxes is that the current production system is unsustainable due to high greenhouses gas emissions and voracity of scarce resources, which creates high volatility in the price of raw materials (Khan et al., 2023), a large amount of waste that it generates (Seebode et al., 2012). Statista (2023) argued that the circular economy is a spiral loop within which an organization attempts to reduce environmental deterioration, and energy consumption without curtailing its growth. The circular economy is among the most relevant issues discussed in public bodies and is of great concern to both consumers and businesses (Ellis-Petersen, 2019; Figge et al., 2017). This has to increase awareness about reducing production and increasing recycling (Linder et al., 2017; Teece, 2010). The origin of the circular economy falls into two scientific aspects; one is about industrial ecology (Frosch, 1992; Graedel, 1996; Lifset, 2002), and the second is about ecological economics, which is about recycling and efficient use of waste (Ayres, 1999; Boulding, 1966; Elia et al., 2017; Ghisellini et al., 2016; Roome & Louche, 2016). More specific fields of the circular economy are industrial symbiosis (Chertow & Ehrenfeld, 2012) industrial ecosystem (Jones & Comfort, 2017), eco-efficiency (Hahn et al., 2018; Hysa et al., 2020; Witjes & Lozano, 2016), reduction of pollutant emissions (Pauliuk, 2018), and clean and efficient production (Haas et al., 2015; Linder et al., 2017; Stewart & Niero, 2018). Hence, the circular economy concerns environmental quality, social equity, economic prosperity, and future generation (Seebode et al., 2012). Based on the paradox theory assumptions, this study aims to identify the circular economy implementation in the ASEAN region given the increasing environmental issues.
Research Method
Sample and Data Collection
This study’s population of interest is the companies in the selected ASEAN region. This study selects companies in ASEAN as a sample because it faces immense climate change issues (Korhonen et al., 2018). It is recently termed the “garbage site” (Ellen MacArthur Foundation, McKinsey, Sun, 2015). For example, plastic pollution is at its peak in the ASEAN region (Thomson, 2010). Hence, selecting the ASEAN region to analyze circular economy indicators’ implementation status as a possible solution to environmental problems seems appropriate. Since companies can play a massive role in the curtailment of environmental issues (Ivory & Brooks, 2018), the top 50 companies of the ASEAN region from the respective stock exchanges of Malaysia, Indonesia, Philippines, Singapore, and Thailand are selected as the sample of this study. The top five high GDP countries were selected from the ASEAN region (Stevenson & Evans, 2004) because a higher number of resources help implement sustainability-related initiatives. The annual and sustainability reports of the respective companies were downloaded for the year 2019.
Measurements
The circular economy indicators were identified in the company’s reports through an index adapted from Geng et al. (2012). As this study focuses on the environmental issues concerned with reuse, recycling, and reproduction, the indicators related to material reduction, recycling, and pollution control were adopted to measure circular economy (see Table 1). Both Material reduction and recycling and pollution control have seven indicators. This study’s scoring technique is termed the “unweighted scoring method” (Garcés-Ayerbe et al., 2016). The indicators were scored using a dichotomous scale based on the unweighted scoring method. Where 1 indicates if the item is disclosed in the report and 0 indicates otherwise. Based on the CE index, the highest scores show high disclosure. The maximum possible score for material reduction, recycling, and pollution control is 7. In total, the highest possible score is 14.
Circular Economy Indicators Related to Environmental Practices.

Source. Adapted from Geng et al. (2012).
Since this study aimed to analyze the disclosure of circular economy indicators related to environmental accounting, it was logical to categorize the firms from each country into environment-sensitive and non-environment-sensitive firms. The sectors’ classification was adopted from Moreau et al. (2017) and Geissdoerfer et al. (2017). They have categorized chemical, mining, metals, oil exploration, paper, plantation, construction, and transportation as environment-sensitive companies. While companies belonging to other sectors are categorized as non-environment sensitive.
Content Analysis Procedure
The content analysis based on the CE index was performed on DICTION-an automated software for content analysis. DICTION software was developed to analyze verbal tones by Haupt et al. (2017). This software stands out from other content analysis software due to several benefits as highlighted by Chun-rong and Jun (2011). First, the dictionaries and the software have backing from the linguistic theory. Second, as the software is based on artificial intelligence, the reliability of the content analysis performed on this software is higher than manual content analysis for coding and quantification. Third, in addition to the benefits, DICTION also provides the flexibility of creating dictionaries (Silvestre & Ţîrcă, 2019). Therefore, this study used DICTION to avoid subjectivity bias and increase the CE index coding reliability.
Fourteen dictionaries were created on DICTION to identify CE indicators disclosures in the annual/ sustainability reports. The dictionaries included all the possible related words of the subsequent indicators. For example, for Energy consumption per added industrial value (M1), all the related words were extracted from the Oxford dictionary and Collins dictionary. The dictionaries for individual items provided a score >1. This indicates that the related item is disclosed in the respective companies’ annual/sustainability reports; hence, based on the dichotomous scoring method, 1 was allocated, and 0 if the dictionary score was <1, indicating no disclosure.
Findings
Each ASEAN country had a different classification of industry sectors. All types of sectors were included to capture the company’s sector association accurately. Moreover, the companies were categorized into the environment and non-environment sensitive category to analyze which sectors precisely disclosed more circular economy indicators (see Table 2). Except for Malaysia, some companies were dropped from each country due to the unavailability of annual/sustainability reports. In total, there were 211 top performers from the ASEAN region. Among these companies, 111 belonged to the environment-sensitive category.
Sample Profile of the Companies.

Based on the indicators provided by Geng et al. (2012), this study’s finding shows that most companies from the selected ASEAN countries disclosed information related to solid waste generation (M4), industrial water reuse ratio (M5), and solid waste reuse ratio (M6) in their reports. All the companies from Malaysia, the Philippines, and Singapore disclosed solid waste generation per added industrial value, whereas Thailand and Indonesian companies lagged with a disclosure percentage of 89 and 95. A similar trend of disclosure for M5 and M6 can be seen in the five ASEAN countries. The combined percentage of these disclosures is higher than 87% compared to other material reduction and recycling indicators. Industrial wastewater generation per added industrial value (M3) and water from wastewater treatment plants (M7) is among the lowest disclosed indicators, with percentages ranging between 2 and 20 for this study’s five ASEAN countries. The extent of energy consumption per added industrial value (M1) disclosure percentages range between 27 and 66. Perhaps, it indicates that energy, water, and solid waste generation and consumption are considered important concerning environmental issues. Thus more focus is placed on their disclosure in the five ASEAN countries (see Table 3).
Extent of Circular Economy Indicators Disclosure.

A similar extent of pollution control indicators can be observed in Table 3. The treatment of domestic wastewater (P4), treatment of domestic rubbish (P5), and waste collection system (P6) are among the highest disclosed indicators across five ASEAN countries. The percentages range from 63 to 100. It can be inferred that disclosure of these indicators is linked with M4, M5, and M6 because they are the aftermath of the waste produced. Other indicators of the pollution control labeled P1, P2, and P7 percentages of disclosures follow a similar pattern. The percentages range from 17 to 61. This shows that most companies in the five countries disclosed this information in their annual/sustainability reports. On the other hand, the disposal rate of dangerous solid waste (P3) had the lowest percentages score across the five countries ranging from 0 to 29. A possible explanation could be that not many companies in this study’s sample deal with dangerous solid wastes. Hence the disclosure score is also low. A comparative analysis of the above discussion is illustrated in Figure 1.
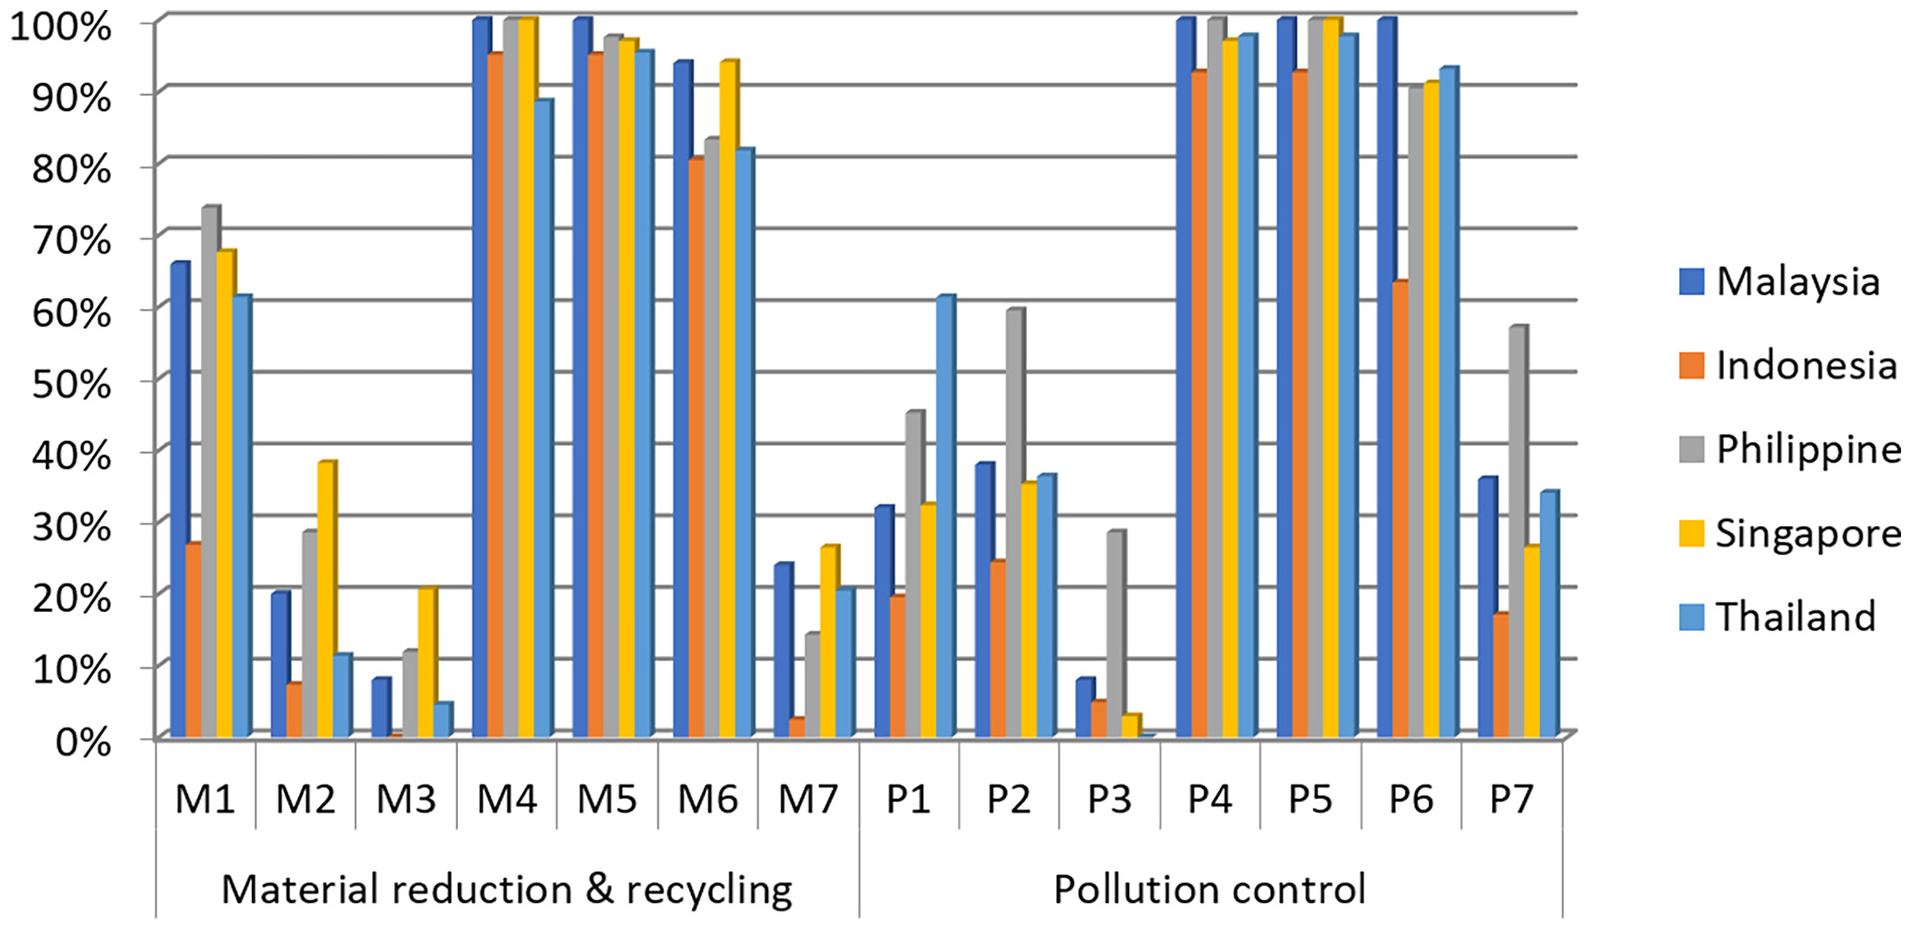
Disclosure comparison of the ASEAN countries.
A cross-country comparison of the circular economy indicators disclosure in the companies’ annual/sustainability reports is presented in Table 4. Among the five sample countries, Singaporean companies have the highest disclosure rate related to material reduction and recycling. Indonesia has the lowest percentage of material reduction and recycling disclosure. Malaysia, the Philippines, and Thailand have similar percentages of material reduction and recycling disclosures. On the contrary, the Philippines and Thailand scored highest for the pollution control indicators, that is, 68.7% and 60%, respectively. Malaysia and Singapore had a similar disclosure percentage, while Indonesian companies disclosed the lowest information related to pollution control in their annual/sustainability reports.
Country-wise Disclosure.

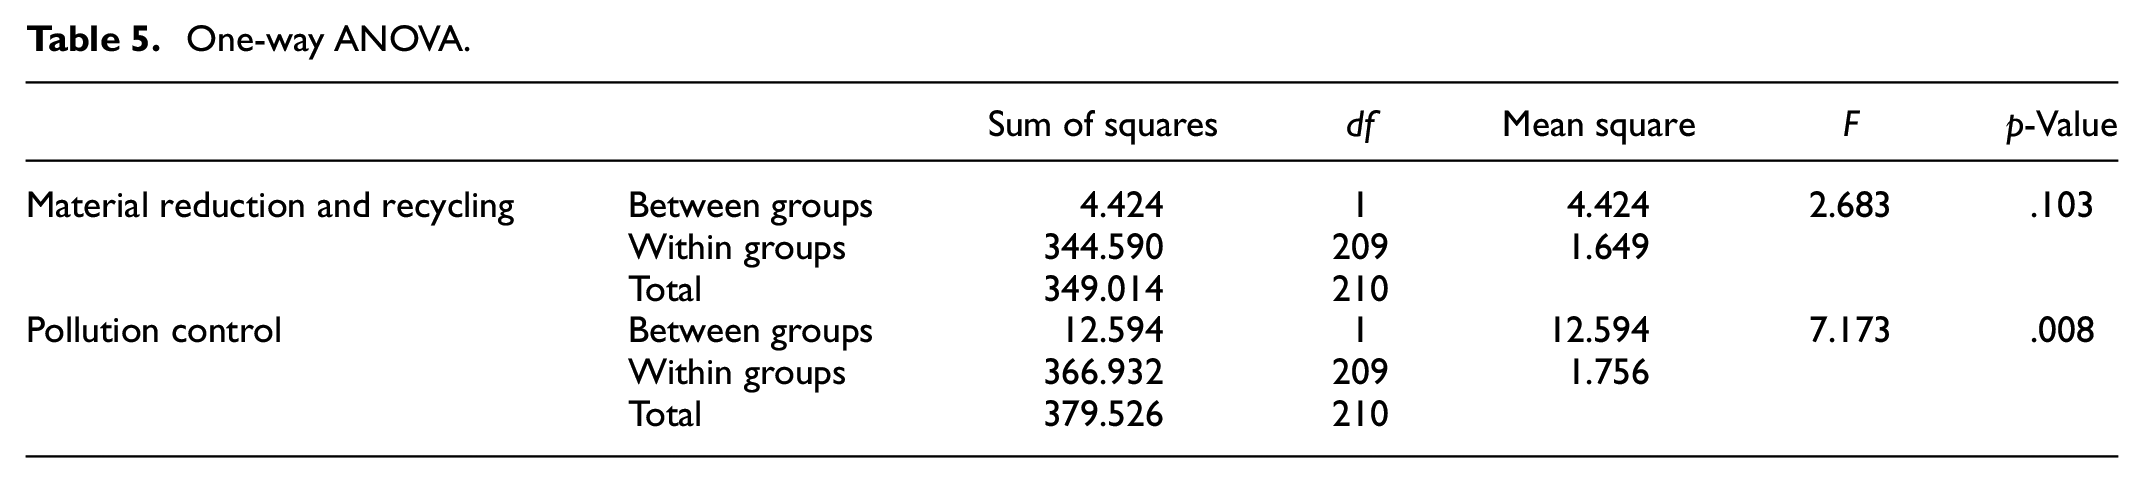
After the comparative analysis of circular economy indicators disclosures and a cross-country analysis, One-way ANOVA results from SPSS are shown in Table 5. One-way ANOVA was conducted to analyze the difference in disclosure between environment-sensitive and non-environment sensitive companies. Prior to the one-way ANOVA analysis, Levene’s statistics values were insignificant >.05. This indicates that the variables do not have homogeneity issues. The p-value for material reduction and recycling indicates no significant difference between the extent of disclosures of environment-sensitive and non-environment sensitive companies of the five ASEAN countries. However, the p-value for pollution control is significant at <.05. This shows a difference between the pollution control indicators disclosures by environment-sensitive and non-environment sensitive sample companies of this study. The difference between the mean values of the circular economy index can be observed in Figure 2. It shows that environment-sensitive firms’ disclosure scores are higher for material reduction & recycling, and pollution control than the non-environment sensitive firms.
One-way ANOVA.
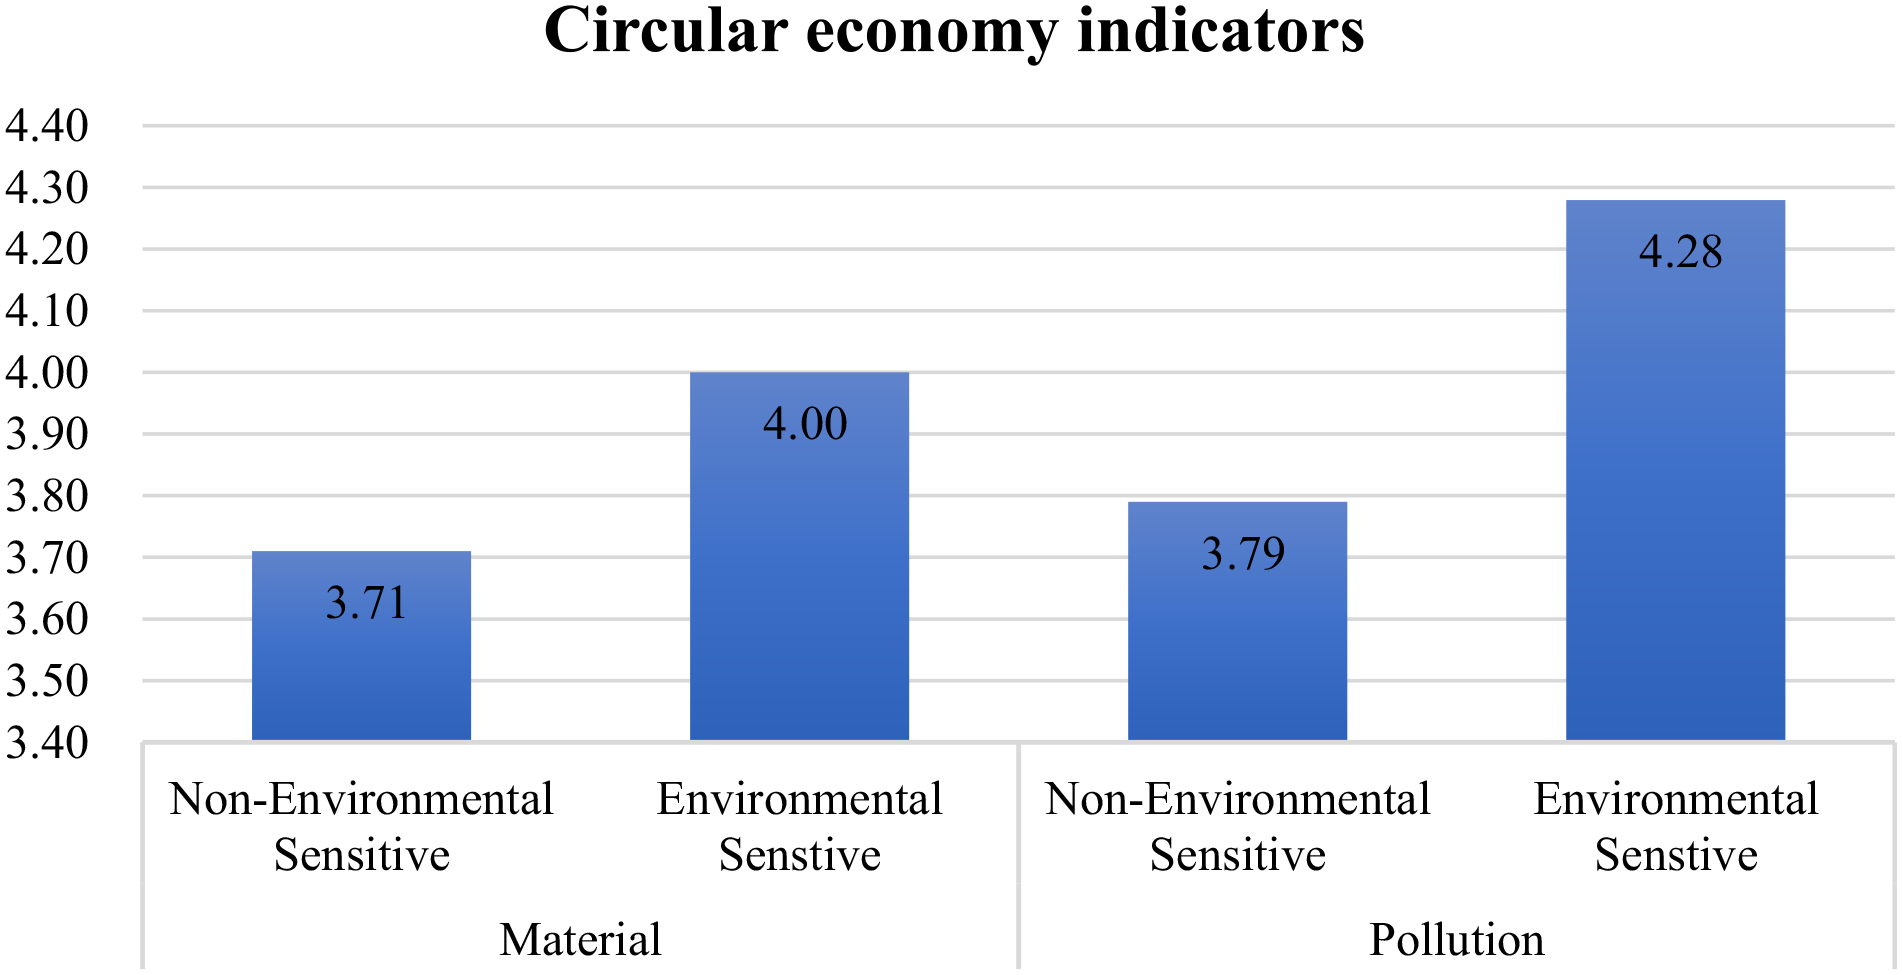
Mean comparison.
Discussion
The circular economy definitions have linkages with sustainable development in the existing available literature. Most of the elements to measure the circular economy are defined. The logic of own definition references is made toward The World Business Council for Sustainable Development, Agenda of 2030 of UN General Assembly, United Nations Global Compact, and the EU Action plan in defining circular economy. Table 1 shows the index used to measure the “R” principle in reporting circular economy indicators by companies in their reports. The highest score gained about material reduction and recycling in the selected ASEAN countries is Singapore, that is, each selected company reported it 4.44 times. Indonesia is the least concerned about material reduction and recycling, with a reporting score of 3.07 times by each selected company. In reporting pollution control, each Philippines’ selected company reported it 4.81 times, whereas Indonesia has the lowest reported score about pollution control, which is 3.15 times for each company. There are no consistent results in reporting material reduction and recycling indicators in respect of each country. Each country has mixed results about reporting each indicator of the circular economy. However, there is a uniformity of results in reporting M4, M5, P4, P5, and P6 labeled indicators of circular economy in all the countries. Almost all the selected companies report these indicators. The reporting score is above 90%. These results are consistent with Stewart et al. (2018).
Statistical analysis presented in Table 5 indicates that both the categories- environmental and non-environmental sensitive companies- have similar behavior about material reduction, reuse, and recycling, which keep recourses in use for longer. The average disclosure about the material by each company indicates that products should be designed in a continuous loop or future generation-based (Strasser, 2000). Therefore, the circular economy is an essential part of business activity. The finding indicates that companies have disclosed information about circular economy indicators that may affect the environment either in materials or pollution control. As for the existence of reduction, recycling, and reuse of materials, our results are consistent with Kojima (2016) and Strasser (2000). Our results indicate that solid activities of the circular economy are articulated the most in annual reports. These solid arguments and a figurative indication of circular economy in annual reports give a strong circular economy grip on the respective industry (Kalmykova et al., 2018). Interestingly, a trade-off between the implementation of the circular economy has not been outlined by any companies, which indicates that it is an intrinsic part of sustainability (Strasser, 2000). However, few authors have pointed out trade-offs (Geng et al., 2009). Companies with a higher score of disclosing circular economy indicators have a narrative of the “reduce” principle. These findings are consistent with observations in the academic literature (Kojima, 2016), which believes that companies can address their environmental problems by adopting circular economy principles (Stewart et al., 2018). The circular economy systematically improves economic growth and reduces pressure on natural resources, generating many organizational paradoxes. A circular economy helps to reduce environmental deterioration and sustain organizational growth.
Conclusions
This study aimed to examine the extent of circular economy disclosures in the ASEAN region. A content analysis approach for the circular economy index was used to operationalize the aim of this study. The findings show that companies actively disclose circular economy indicators in their financial and non-financial reports. However, a difference can be observed between environment-sensitive and non-environmental sensitive companies’ disclosure practices, specifically regarding pollution control indicators.
Implications
This study has several theoretical and practical implications. This study is a significant contribution related to the circular economy in academia. The disclosure about circular economy indicators in non-financial reports was not analyzed/acknowledged in the prior available studies. Each dimension and sub-dimension of the circular economy’s parameters are analyzed and compared within the selected ASEAN countries. The companies of 38 sectors are analyzed, which exhibits that they do not systematically acknowledge information about the use of natural resources and their potential impact on the environment.
This study provides insights to the UN’s policymakers on the sustainable development program from a practical perspective. First, the policymakers can emphasize guiding the countries lacking or facing challenges in adopting the circular economy. Second, this study provides an update to the practitioners through the five ASEAN countries’ comparative analysis. Third, it highlighted the loopholes that need improvement. For example, the companies of selected ASEAN countries need to focus more on the wastewater treatment and facilities provided centrally to cater to wastewater management. This study’s findings also provide updated details on the circular economy implementation status for the sample companies’ regulators. Moreover, the relevant stakeholders can consult this study’s findings for the investment in environmentally responsible companies.
Limitations and Future Research Direction
Despite a significant contribution to the existing literature, this study has some limitations. First, it did not include all the other related circular economy indicators. The focus was on implementing circular economy indicators related to environmental issues. Future studies can present empirical evidence by adopting a comprehensive circular economy index. Second, this study’s framework did not consider other factors such as firm size and age. Future studies can add other contributing factors and test the findings of this study. This study’s scope can be expanded by investigating circular economy indicators in other parts of the world that are severely hit by environmental issues. Fourth, future studies can incorporate stakeholders’ views on the circular economy as a potential solution to environmental issues through other research methods such as interviews and surveys. Lastly, most of the companies of selected ASEAN countries are large public interest companies with a value higher than the lowest benchmark established by the EU, which falls under the scope of EU 2014/95 directives. Therefore, a comparative analysis can be drawn between EU companies and ASEAN companies to examine the extent of circular economy implementation and discloser of non-financial information.
Footnotes
Declaration of Conflicting Interests
The author(s) declared no potential conflicts of interest with respect to the research, authorship, and/or publication of this article.
Funding
The author(s) received no financial support for the research, authorship, and/or publication of this article.