
Abstract
This study investigates the performance of corporate social responsibility (CSR) portfolios based on ESG scores of stocks traded in Borsa Istanbul (BIST). It also evaluates the performance of a trading strategy that represents buying portfolios that include companies with high CSR performance and selling portfolios comprising companies with low CSR performance. Therefore, two portfolios with high and low CSR performance were formed from stocks traded in Borsa Istanbul. These portfolios’ performances were compared from July 2010 to June 2020. The findings show that the alpha coefficient of the portfolio containing stocks of companies with high CSR performance is generally positive and significant. Thus, companies’ past CSR performances provide valuable information for investors. Additionally, based on this, investors can achieve a superior performance against the market. However, the alpha of the difference portfolio, which shows the difference between the two portfolios’ performance, is, in most cases, insignificant. This suggests that there is no proof that the portfolio comprising companies with high CSR performance is superior to the portfolio including companies with low CSR performance. These findings are supported by additional testing. Consequently, our result provides supporting evidence for the “no effect” hypothesis.
Plain Language Summary
With the emergence of green investors in recent years, it has become clear that it is not enough to base investment decisions solely on financial criteria. These investors consider the environmental and social impact of companies in their investment decisions, rather than financial criteria. This investment style differs from the traditional risk-return approach. In this context, non-financial information such as corporate social responsibility is becoming increasingly important for both companies and investors. This study examines whether corporate social responsibility performance has an impact on portfolio performance in Turkey. The information obtained in the current study shows that companies' past corporate social responsibility performances may be important information for investors. In other words, investors can demonstrate a superior performance against the market by using this corporate social responsibility performance data. Another important result obtained in this study is that there is no difference between the performances of companies with high and low corporate social responsibility performance. Therefore, a buy and sell strategy based on corporate social responsibility information does not provide any extra profit.
Keywords
Introduction
Investors choose between various investment strategies to increase their returns. They generally use financial returns as an indicator for evaluating their investments’ performance. However, with the emergence of green investors in recent years, it is insufficient to only consider financial criteria as a basis for investment decisions (Ballestero et al., 2012). For investment decisions, these investors consider the impact of companies on the environment and society rather than the financial criteria (Heinkel et al., 2001). This investment style differs from the classical risk-return approach (Renneboog et al., 2008). In this respect, non-financial information, such as CSR or ESG, is gaining importance for both companies and investors. According to Bouslah et al. (2018), several indicators support this claim: (1) The emergence of companies specializing in collecting and evaluating CSR data from various sources (CSR reports, websites, or news sites) to measure companies’ CSR performance. (2) The emergence of funds and indexes that determine firms based on CSR or sustainability performance. (3) There is an increasing interest in CSR among investors as well as researchers. Investments in social responsibility have increased in recent times (Renneboog et al., 2008). Likewise, the number of studies conducted in the field of CSR has also increased (Meseguer-Sánchez et al., 2021). According to The Forum for Sustainable and Responsible Investments (2020), total US assets managed using sustainable investment strategies have risen from $12.0 trillion at the beginning of 2018 to $17.1 trillion, with an increase of 42% at the beginning of 2020. This amount represents 33% of the total US assets managed by professionals. Furthermore, Science Direct, Pro Quest, and Web of Science included 7,311 scientific studies on this subject in 2010, which rose to 10,331 in 2017 (see Agudelo et al., 2019). (4) Several companies, especially large ones, prepare special reports on their CSR actions and policies, or allocate certain parts of their annual activity reports to CSR. Some CSR-related developments are also seen in Turkey (Ararat, 2008). For example, the number of Turkish firms in the databases of various international organizations (Thomson Reuters and CSRHub) that measure firms’ CSR performance has increased over the years. Additionally, the BIST Sustainability Index was launched and published by Borsa Istanbul in 2014 (Borsa Istanbul, 2021). Considering these developments, companies are expected to include CSR in their activities and investors are likely to consider CSR in their investment processes.
CSR issues have gained importance in the field of finance due to the increase in specialized institutions, the expansion of academic research, the increase in funds managed according to sustainability criteria, and the proliferation of online resources and CSR reports. The increasing importance of CSR in the field of finance has led to the emergence of studies that investigate the association between CSR and various company characteristics from different perspectives. Most of these studies examine the relationship between CSR and financial performance (Kim et al., 2018; Marić et al., 2021; Oh & Park, 2015; Orlitzky et al., 2003; Scholtens, 2008; Su et al., 2016), while some (Aupperle et al., 1985; Türker, 2015; Syed, 2017) analyze the association between CSR and profitability. A few studies explore the association between CSR and the cost of debt (Magnanelli & Izzo, 2017; Oikonomou et al., 2014; Yeh et al., 2020), whereas some focus on the impact of CSR on equity and the cost of capital (El Ghoul et al., 2018; Eom & Nam, 2017; Ok & Kim, 2019; Reverte, 2012; Sharfman & Fernando, 2008; Wu et al., 2014). Furthermore, several studies explore the link between CSR and risk (Benlemlih et al., 2018; Bouslah et al., 2018; Hsu & Chen, 2015; Liu & Lu, 2021; Mishra & Modi, 2013; Salama et al., 2011). Additionally, some studies examine the relationship between CSR and various issues such as information asymmetry, capital structure, leverage, firm value, and financial distress (Bae et al., 2019; Cui et al., 2018; Goss, 2009; Lopatta et al., 2016; Pijourlet, 2013; Verwijmeren & Derwall, 2010). However, the studies on the relationship between various issues of finance and CSR have revealed conflicting results. Accordingly, the following questions arise: whether CSR activities will provide benefits for the company in the future and whether investors who include CSR in their investment processes will gain abnormal returns. This study seeks to answer these questions for companies as well as investors.
Moreover, while the number of empirical investigations on the relationship between CSR and portfolio investments has expanded recently, a clear consensus has not yet emerged on the performance of investments. Some studies (Derwall et al., 2005; Kempf & Osthoff, 2007; Qureshi et al., 2021; Ziegler et al., 2011) conducted in developed and developing countries reveal that CSR positively affects investment performance. Therefore, investors can achieve higher performance by investing in CSR companies. However, some studies (Hong & Kacperczyk, 2009) suggest that CSR negatively affects investment performance. More specifically, investors achieve low performance by investing in CSR companies. Other studies (Hamilton et al., 1993; Halbritter & Dorfleitner, 2015; Humphrey et al., 2012a, 2012b) have revealed that CSR does not affect investment performance. Furthermore, there are limited studies (Alper & Aydoğan, 2018; Aras et al., 2010; Arsoy et al., 2012; Başar, 2014; Özçelik et al., 2014; Sakarya et al., 2014) on CSR in Turkey. A majority of these investigations focus on the connection between CSR and financial performance and reveal conflicting outcomes. Moreover, these examinations use return on equity (ROE), return on assets (ROA), and Tobin’s Q as financial performance indicators. In contrast to existing investigations in Turkey, we analyze the connection between CSR and financial performance based on portfolio analysis. Moreover, we apply four asset-pricing models to explain portfolio performance. Thus, this study that links portfolio performance and CSR will be valuable to the CSR literature in Turkey (Although Turkey expression is used in this study, Turkey’s name was accepted as Türkiye by the United Nations).
We examine the CSR portfolios’ performance based on the ESG scores using capital asset pricing model (CAPM), three-factor model (3FM), four-factor model (4FM), and five-factor model (5FM) between July 2010 and June 2020 in an emerging market, namely Turkey. The results obtained from the models showed that high-scoring portfolios reveal a positive and significant alpha. This shows that CSR performance positively affects portfolio performance. Therefore, investors can gain better performance than the market by investing in portfolios with high CSR performance. Furthermore, this result indicates that the market lacks CSR knowledge. This study also examined the performance of a trading strategy, which is measured by the difference between the alphas of the high-scoring and low-scoring portfolios. According to the results, the alpha of the difference portfolio is generally not significant. This suggests that the trading strategy does not provide abnormal returns. In addition, these findings are supported by using two additional proxies (BIST Sustainability Index and Stakeholder Score) for CSR performance.
This study consists of 6 sections. Section 1 presents the introduction. The next section presents the hypotheses discussed in previous studies and the literature. Section 3 discusses the way we create portfolios and how to measure portfolio performance. Section 4 provides the regression findings while Section 5 presents the empirical findings from additional tests. Finally, Section 6 provides the conclusion.
Literature Review
Numerous surveys have examined the relationship between CSR and stock performance. Nonetheless, their outcomes provide blended proof of the effect of CSR on stock performance. There are three alternative hypotheses in the literature (see Hamilton et al., 1993; Mollet & Ziegler, 2014). These hypotheses concern the stock performance of both responsible and traditional firms. The first hypothesis is the “doing good while doing well” hypothesis. It suggests that the expected return on stocks of responsible firms is higher than the expected return on stocks of traditional firms. More specifically, the “doing good while doing well” hypothesis indicates that CSR has a beneficial effect on performance. Some studies provide results that support this hypothesis. Based on the corporate eco-efficiency performance of innovest strategic value advisors, Derwall et al. (2005) investigated whether socially responsible investing impacts portfolio performance. Two stock portfolios with different eco-efficiency performances were created, and the performance of these portfolios was evaluated. The primary question of the study was whether social responsibility investments show high or low performance. Therefore, they compared the performances of portfolios created based on US stocks from 1997 to 2003. According to the results, the high-ranked portfolio shows superior performance. The portfolio containing stocks of companies with high CSR performance provides a significantly higher average return than a portfolio comprising stocks of companies with low CSR performance. Additionally, the same results occur even at all transaction cost levels. The results suggest that it may be beneficial to consider social responsibility and environmental criteria during the investment process.
Kempf and Osthoff (2007) examined whether buying stocks with high CSR performance, and selling stocks with low CSR performance provides a higher performance. The sample covers United Statesfirms from 1992 to 2004. The performance of the portfolios is evaluated using four-factor models. The results reveal that this strategy provides high abnormal returns. Investors reach maximum returns by using several CSR indicators simultaneously. In other words, firms with high CSR performance perform better than firms with low CSR performance. Additionally, abnormal returns continue to remain meaningful even after transaction costs are taken into account. That is, alphas remain significant even at various transaction cost levels. Overall, the study reveals that past CSR performance is valuable to investors and that high abnormal returns can be achieved with a trading strategy based on public information.
Based on the CSR performance provided by Kinder, Lydenberg, Domini Research & Analytics (KLD), Statman and Glushkov (2009) analyzed the performance of social responsibility investments for the years 1992 to 2007. CAPM and the 4FM reveal that the risk-adjusted returns of the high and low strategies are significant and positive. This study suggests that investors can gain an advantage over traditional investors by including stocks of companies with high CSR performance in their portfolios and avoiding socially-irresponsible stocks.
Ziegler et al. (2011) investigated the association between responses to climate change and returns. This study examined whether a trading strategy causes positive or negative abnormal returns. This trading strategy involves buying the stocks of companies that disclose their responsibility against climate change and selling the stocks of companies that do not make a statement against climate change. The main results of the study are as follows: (1) Such a strategy will become more valuable over time in Europe. (2) This strategy was particularly rewarded in 2004 to 2006. (3) The association between corporate response to climate change and returns in United States energy companies is positive. The findings suggest that if global warming awareness is expected to increase in any country, investments in such a country will become more attractive or profitable in the future.
The second hypothesis is: “doing good but not well.” It suggests that the expected returns of traditional firms are higher than the expected returns of the responsible firms. More specifically, the “doing good but not well” hypothesis indicates that CSR has a negative effect on performance. Therefore, according to this hypothesis, there is a significant performance distinction between portfolios covering the stocks of companies with high CSR performance and those covering the stocks of companies with low CSR performance, and this difference is in favor of traditional firms (Hamilton et al., 1993). Some study results support this hypothesis. Brammer et al. (2006) analyzed the interaction between CSR and stock performance in the UK. Environment, employment, and community activities were used instead of the total performance measure to represent CSR performance. In other words, the performance of CSR categories was considered. Their results suggest that firms with high CSR scores have lower returns than firms with low CSR scores. Accordingly, by creating a portfolio that includes stocks with the lowest CSR performance, significant abnormal returns can be obtained.
Furthermore, Hong and Kacperczyk (2009) investigated the impact of social norms on markets in the United States from 1965 to 2006. This study used asset pricing models, such as CAPM, in addition to cross-sectional regression. The results revealed that stocks that are generally excluded from a portfolio due to social norms or limited risk sharing have higher expected returns. Additionally, they show that “sin” stocks are priced lower and provide higher excess returns than other stocks.
Finally, the third hypothesis is the “no effect” hypothesis. It suggests that there is no difference between the expected returns of the responsible firm and that of traditional firms. Therefore, according to this hypothesis, CSR stocks are not mispriced as CSR is correctly priced by the market. In other words, the expected returns of responsible and non-responsible firms are equal (Hamilton et al., 1993; Mollet & Ziegler, 2014). Hamilton et al. (1993) compared the performance of social responsibility mutual funds and conventional funds between January 1981 and December 1990. Excess returns of funds were measured using Jensen’s alpha. The sample included 17 funds. According to the empirical findings, the excess returns of the 15 funds were not different from zero. While excess returns of one fund from the rest is positive and significant, excess returns of the other is negative and significant. This result supports the “no effect” hypothesis. Consequently, their results argue that social responsibility does not affect the expected stock returns or capital costs of firms. Therefore, investors will not have any losses if they invest in socially-responsible investment funds.
Humphrey et al. (2012b) analyzed whether there is a distinction between the financial performance and risks of corporations with high and low ESG scores in the UK between October 2002 and September 2008. The results exhibited that investments based on ESG rankings have neither costs nor benefits. Additionally, there is no difference between the systematic risk, book-to-market, and past performance of portfolios in which corporations with a high ESG score are included and portfolios in which corporations with a low ESG score are included. However, portfolios in which corporations with a high ESG score include larger firms. Overall, their results argue that there is no significant difference between the performance of both portfolios.
Mollet and Ziegler (2014) explored whether responsibility firms have positive or negative abnormal returns for the United States and European countries. Therefore, they examined whether there is wrong pricing in these stocks. They report insignificant abnormal returns for both Europe and the United States.
Halbritter and Dorfleitner (2015) analyzed the association between CSR and financial performance based on ESG performance in the United States from 1991to 2012. ASSET4, Bloomberg, and KLD were used for CSR data, and portfolio analysis was performed separately for the databases. Separate portfolios were created for each category of ESG and the overall score. They also analyzed the performance of a trading strategy based on such information. According to the results, there is no significant performance difference between portfolios with high and low scores in the United States market in general. Thus, the findings argue that investors should not expect an abnormal return by buying and selling portfolios of high-and low-scoring firms.
Additionally, Auer and Schuhmacher (2016) analyzed the performance of social responsibility investments in Asia-Pacific, the United States, and Europe between August 2004 and December 2012. They constructed high-scored and low-scored portfolios on the basis of ESG, and used the Sharpe ratio to compare portfolio performance. Their results argue that stocks with high ESG scores have higher performance than stocks with lower ESG scores for both regions. Moreover, there is no proof of the advantages of the ESG strategy for Europe.
Data and Methodology
The data of this study include monthly returns of stocks, risk-free interest rate, market return, book-to-market ratio, CSR performance, profitability ratio, market capitalization, and growth rate of total assets. The sample of this study includes firms trading in Borsa Istanbul, excluding financial firms. First, two portfolios are created from stocks with different CSR performances. Subsequently, the performance of these portfolios is measured. In this section, information is provided on CSR and financial data, portfolio formation, and the study method.
CSR and Financial Data
As a result of the increase in CSR awareness among investors and companies and the emergence of different regulations (see Renneboog et al., 2008) regarding CSR in some countries (e.g., the UK, USA, and other countries), various organizations have begun measuring the CSR performance of companies. These organizations specialize in gathering and assessing CSR data from various sources (e.g., CSR reports). They collect information about various CSR categories based on the methods they have determined. The collected information is evaluated according to certain criteria, and a score or grade is assigned to show the CSR performance of the companies. One such database is the Thomson Reuters ESG database, while other databases include Sustainalytics, Bloomberg, RobecoSAM, Vigeo, CSRHub, or EIRIS.
This study uses ESG data provided by Thomson Reuters Eikon (now known as Refinitiv) as a proxy for CSR performance. Thomson Reuters collects information about ESG with more than 400 metrics at the firm level to strengthen the company valuation and scoring process by using various sources (e.g., annual reports of companies or CSR reports among others). The information was collected in 10 topics and 3 categories (ESG). The environmental category includes the topics of innovation, resource use, and emissions. The social category includes the topics of product responsibility, workforce, community, and human rights. The governance category comprises the topics of CSR strategy, management, and shareholders. The sum of these three categories shows the total ESG score of a firm. High ratings represent a high ESG performance (Thomson Reuters, 2018). A firm’s ESG rating or CSR performance varies between D− and A+. The fact that the company attaches importance to CSR-related activities and, consequently, carries out such activities ensures that it obtains a good score. A− and higher ratings highlight that the CSR performance of a company is excellent. In contrast, D+ and lower ratings indicate a poor CSR performance.
The Thomson Reuters ESG database is widely used in many studies, both in developed and developing countries. This demonstrates the reliability of the database. Additionally, this database evaluates the CSR performance of companies in a multidimensional and comprehensive manner. However, a limited number of Turkish companies are scored in the Thomson Reuters ESG database, with an average of 24 Turkish companies between 2009 and 2018. We use two proxies for CSR performance to overcome this problem and increase the results’ reliability and validity. The other proxies used in the current study are the BIST Sustainability Index and Stakeholder Score.
In the current study, the risk-free interest rate was acquired from the website of the Republic of Turkey Ministry of Treasury and Finance. Book-to-market ratio and market capitalization data were acquired from Borsa Istanbul. The profitability ratio and growth rate of total assets were acquired from Finnet, one of the official data of Borsa Istanbul.
Portfolio Formation
This study uses ESG data provided by Thomson Reuters Eikon as a CSR performance indicator. The ESG data cover 2009 to 2018. To ensure that ESG information for year t − 1 is known, we form high-scoring, low-scoring, and difference portfolios in June of each t year according to the ESG rating of year t − 1. The high-scoring portfolio includes stocks of companies with an ESG rating of above C+. The low-scoring portfolio includes stocks of companies with an ESG rating of C+ and below. The difference portfolio is created by taking the difference between the returns of high-and low-scoring portfolios. The difference portfolio implies taking a long position in a high-scoring portfolio and a short position in a low-scoring portfolio. The difference portfolio also helps us see if there is any difference in performance between the two portfolios. We also formed size (SMB), value (HML), momentum (WML), profitability (RMW), and investment (CMA) portfolios or factors according to the studies of Fama and French (1993, 2012, 2015) and Carhart (1997). Subsequently, we show how we construct these portfolios or risk factors. The forming basis of these risk factors is companies (excluding financial companies) quoted in Borsa Istanbul. After forming the portfolios, we calculated the equally weighted monthly returns for these portfolios from July 2010 to June 2020. Equally weighted portfolios were reformed each year in June.
Size and Value Factors
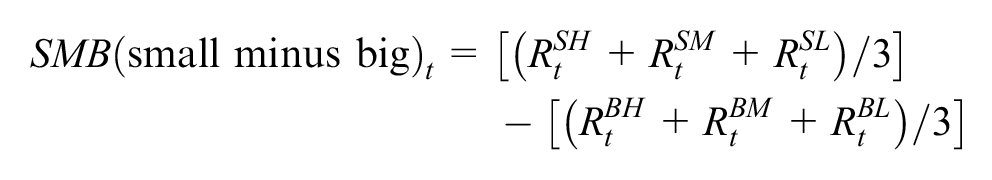
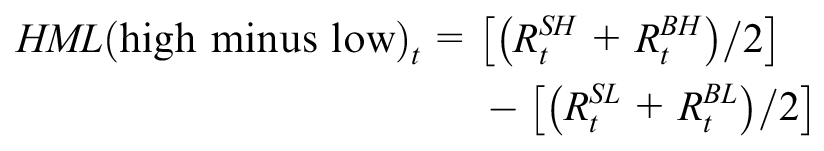
We constructed the size (SMB) and value (HML) portfolios, similar to the portfolio construct methods of Fama and French (1993). Market capitalization was used to measure firm size. To generate the SMB and HML portfolios, all BIST stocks were first sorted from the smallest to the largest by market capitalization in June of each year from 2010 to 2019. Then, these stocks were separated into two groups: big and small. The big group was coded as B, while the small group was coded as S. The median value was used for the group separation. The small group contained stocks below the median value. The big group contained stocks above the median value. Furthermore, all BIST stocks were independently sorted by their book-to-market equity (B/M) ratio in December of each year t − 1. These stocks, ranked according to their book-to-market ratios, were separated into three groups: low, medium, and high. The high group was coded as H, the low group as L, and the medium group as M. The 30th, 40th, and 30th percentiles were used to divide stocks into three groups. The low, medium, and high groups contained stocks with the bottom 30%, medium 40%, and top 30% book-to-market ratios, respectively. Consecutively, all BIST stocks were separated into two groups based on their market capitalization and three groups based on their book-to-market ratio. Using these five groups, six equally weighted intersection portfolios were obtained. These six intersection portfolios are SL, SM, SH, BL, BM, and BH. For example, stocks in the BH portfolio have a large market capitalization and a low book-to-market ratio. These six portfolios’ monthly average returns were computed from July of year t through June of year t + 1. Portfolios were rearranged in June of each year. Therefore, the number of stocks in the portfolios varied from year to year. Additionally, portfolio construct periods started at the end of June of each year t and ended in June each year t + 1. By using the six intersection portfolios mentioned above, the SMB and HML portfolios were constructed for each t month as follows:
Momentum Factor
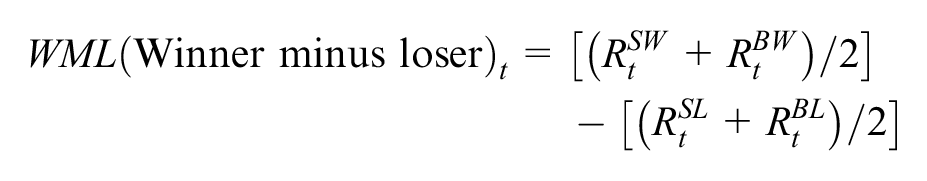
We constructed the momentum (WML) portfolio, based on the portfolio construct methods of Carhart (1997) and Fama and French (2012). First, all BIST stocks were sorted by their cumulative returns from t − 11 to t − 1 in month t. Then, these stocks were divided into three groups: winners, medium, and losers. The winners group is coded as W, the losers group as L, and the medium group as M. The losers, medium, and winner groups contained stocks with the lowest 30%, medium 40%, and highest 30% cumulative returns, respectively. Six equally-weighted portfolios were obtained from the intersection of the two portfolios (S and B) formed according to their sizes and three portfolios (W, M, and L) formed according to their cumulative returns. These six intersection portfolios are: SL, SM, SW, BL, BM, and BW. For example, the BW portfolio covers stocks with large market capitalizations and high cumulative returns. Four of the intersection portfolios above were used to construct the WML portfolio. For each month t, the WML portfolio was constructed as follows:
Profitability and Investment Factors
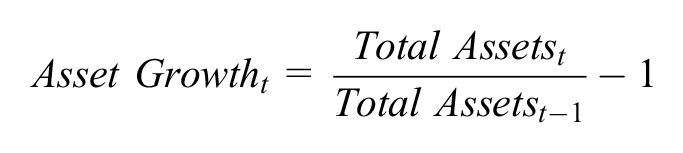
We constructed the profitability (RMW) and investment (CMA) portfolios, following the portfolio construct methods of Fama and French (2012) and Chiah et al. (2016). We used return on equity (ROE) as a proxy for profitability. We also used asset growth as a proxy for investment. Asset growth was calculated using the following equation:
To construct the RMW portfolio, we sorted stocks based on their profitability in December of each year t − 1. Then, the sorted stocks were divided into three groups: robust (R), medium (M), and weak (W). The robust, medium, and weak groups contained stocks with the highest 30%, medium 40%, and lowest 30% profitability, respectively. Six equally-weighted portfolios were obtained from the intersection of the two portfolios (S and B) formed according to their sizes and three portfolios (R, M, and W) formed according to their profitability. These six intersection portfolios are: SR, SM, SW, BR, BM, and BW. For example, the SR portfolio covers stocks with small market capitalizations and robust profitability. Four of the intersection portfolios above were used to construct the RMW portfolio. For each month t, the RMW portfolio was constructed as follows:

A similar procedure was followed when forming an investment portfolio. Accordingly, stocks were ranked according to their investments and divided into three groups: aggressive (A), medium (M), and conservative (C). The aggressive, medium, and conservative groups contained stocks with the highest 30%, medium 40%, and lowest 30% investment, respectively. Six equally-weighted portfolios were obtained from the intersection of the two portfolios (S and B) formed according to their sizes and three portfolios (A, M, and C) formed according to their investment. These six intersection portfolios are: SC, SM, SA, BC, BM, and BA. For example, the BA portfolio covers stocks with large market capitalizations and aggressive investments. Four of the intersection portfolios above were used to construct the CMA portfolio. For each month t, the CMA portfolio was constructed as follows:

Finally, to construct the SMB portfolio used in the five-factor model, we used 18 portfolios formed according to size, investment, book-to-market (B/M), and profitability ratio. For each month t, the SMB portfolio was constructed as follows (Fama & French, 2015):


Table 1 reports descriptive statistics among the portfolios from July 2010 to June 2020. The returns of the high-scored portfolio range from −0.218 to 0.203 and have a mean of 0.014. The returns of the low-scored portfolio range from −0.151 to 0.148 and have a mean of 0.019. The excess returns of the market portfolio range from −0.174 to 0.156 and have a mean of −0.01%. Evidently, the average return of the high-scored portfolio is lower than the low-scored ones. The standard deviation (SD) of the high-scored portfolio is 0.068 while of the low-scored portfolio is 0.058.
Descriptive Statistics.

Note. SMB3and4FM denotes the SMB portfolio formed for the three and four factor model. SMB5FM denotes the SMB portfolio formed for the five factor model. SD = standard deviation; Obs = observations.
Performance Measurement
Studies in the CSR field generally prefer different approaches. The first approach is regression or correlation analysis. In this approach, the relationship between a dependent variable (mostly corporate financial performance) and one or more independent variables (mostly CSR performance) is examined. Studies (Cho et al., 2019; Oh & Park, 2015) with this approach generally examine CSR performance’s effect on financial performance. However, in this approach, a causality problem may arise between CSR and financial performance. Financial performance is likely to have an impact on CSR performance (Jo & Harjoto, 2012). Further, CSR performance may also affect financial performance (Nelling & Webb, 2009; Scholtens, 2008). The second approach is event studies. With this approach, the short-term reactions of stock returns or firm performance to an event are measured. However, the effects of short-term responses may weaken or disappear over time (Ziegler et al., 2007). The third approach is portfolio analysis. In this approach, portfolios with high and low CSR performance are generally formed. Then, the risk-adjusted returns of these portfolios are compared, and it is examined whether there is a difference between the returns (see Derwall et al., 2005; Kempf & Osthoff, 2007). Additionally, the risk-adjusted returns of social responsibility and conventional mutual funds are compared using the portfolio approach (see Hamilton et al., 1993). We chose the portfolio approach due to the drawbacks of regression and event studies. In this approach, the possible effect of firm-specific changes on the results is less than in the other approaches (Ziegler et al., 2011). Moreover, stock returns are less sensitive to reverse causality and endogeneity problems than other financial measures (Guo et al., 2018). Other reasons for choosing the portfolio approach are as follows: (1) Comparing the performance of portfolios created from stocks with better and worse CSR performance. (2) Examining whether there is a difference between the risk-adjusted returns of these portfolios based on CSR performance. (3) Suggesting a trading strategy based on CSR performance.
To estimate risk-adjusted returns, portfolio analysis must include asset pricing models (Ziegler et al., 2011). Therefore, in parallel with some studies (Choi et al., 2010; Derwall et al., 2005; Mollet & Ziegler, 2014; Statman & Glushkov, 2009; Ziegler et al., 2011), we chose the asset pricing models in our portfolio analysis. These models provide some benefits for the purpose of this study: (1) Models estimate the risk-adjusted returns of portfolios. (2) Models measure the performance of a trading strategy based on CSR information. (3) Models control non-CSR factors.
In the current study, we first used the CAPM (Lintner, 1965). The only factor in this model is the excess market return. After empirical discussions about the inefficiency of CAPM, 3FM was advanced by Fama and French (1993). The 3FM consists of three portfolios. These are the size, value, and market portfolios. Therefore, secondly, we used the 3FM. Carhart (1997) stated that 3FM does not explain the momentum strategy. Therefore, he suggested that the momentum factor should be added to the 3FM. As a third model, we also used the 4FM. Finally, we used the 5FM proposed by Fama and French (2015). The 5FM comprises profitability and investment portfolios added to the 3FM. In summary, we employed four performance models to determine the performance of high-scoring and low-scoring portfolios in terms of CSR. The models used were as follows:


In these models,


Results
Table 2 presents the correlation coefficients among high-scored, low-scored, difference portfolios, and other factors. The correlation coefficients are not high between the dependent variables (Market, SMB, and HML) used in 3FM, the dependent variables (Market, SMB, HML, and WML) used in 4FM, and the dependent variables (Market, SMB, HML, RMW, and CMA) used in 5FM. There is a positive coefficient of correlation between the high-scoring portfolio and the Market, SMB, and CMA, while it is observed that there is a negative correlation coefficient between the high-scored portfolio and HML, WML, and RMW. Similarly, there is a positive coefficient of correlation between the low-scored portfolio and Market, SMB, and CMA, while there is a negative coefficient of correlation between the low-scored portfolio and HML, WML, and RMW. Therefore, these results can be interpreted as the absence of multiple connections between the variables.
Correlation Coefficients.

Note. SMB3and4FM denotes the SMB portfolio formed for the three-and four-factor models. SMB5FM denotes the SMB portfolio formed for the five-factor model.
***, **, and * refer 1%, 5%, and 10% significance, respectively.
The variables of this study have the characteristics of a time series. Time series data may contain a unit root. The absence of a unit root of the series or stationarity is an important feature of the time series. Thus, it should be tested whether the series are stationary. Testing stationarity is important for obtaining meaningful relationships between the variables. The fact that the series in the analysis is not stationary causes meaningless relationships between variables. In this study, ADF (Augmented Dickey-Fuller) and PP (Phillips-Perron) tests broadly utilized in the literature were used to evaluate the stationarity of variables. The ADF and PP test statistics and MacKinnon critical values are presented in Table 3. The absolute values of the MacKinnon critical values were smaller than the absolute values of the ADF and PP test statistics. Therefore, while the null hypothesis claiming that series are not stationary is rejected, the alternative hypothesis claiming that series are stationary is supported. According to these results, all series to be used in models do not contain unit roots at the 1% significance level. In other words, all series are stationary.
Unit Root Tests.

Note. SMB3and4FM denotes the SMB portfolio formed for the three-and four-factor models. SMB5FM denotes the SMB portfolio formed for the five-factor model.
denotes significance at the 1% level.
The findings of CAPM, 3FM, 4FM, and 5FM are presented in Table 4. In addition to the performances of high-and low-scoring portfolios, we also present the performance of the difference portfolio. One of the primary focal points of this study is to examine the performance difference between the two portfolios. The difference portfolio is created by taking the difference between the returns of high-and low-scoring portfolios. The alpha of the difference portfolio reveals the influence of CSR on portfolio performance. According to the CAPM results, the alpha of the high-scoring portfolio that includes stocks of companies with high CSR performance is positive and statistically significant. This shows that the performance of high-scoring portfolios is significantly different from that of the market. The high-scoring portfolio has a superior performance compared to the market. Similarly, the alpha of the low-scoring portfolio that includes stocks of companies with low CSR performance is positive and statistically significant. The low-scoring portfolio has a superior performance compared to the market. The risks (coefficient on market) of both high-scoring and low-scoring portfolios are positive and significant. The alpha of the difference portfolio, which shows the difference between the performances of the two portfolios, is negative but not statistically significant. This result indicates that the performance of the low-scoring portfolio is better than that of the high-scoring one. However, this difference was not statistically significant. More specifically, the trading strategy does not provide higher risk-adjusted returns. Additionally, the beta of the difference portfolio is positive and significant. In this respect, the systematic risks of high-scoring portfolios are higher than those of low-scoring portfolios.
Empirical Results.
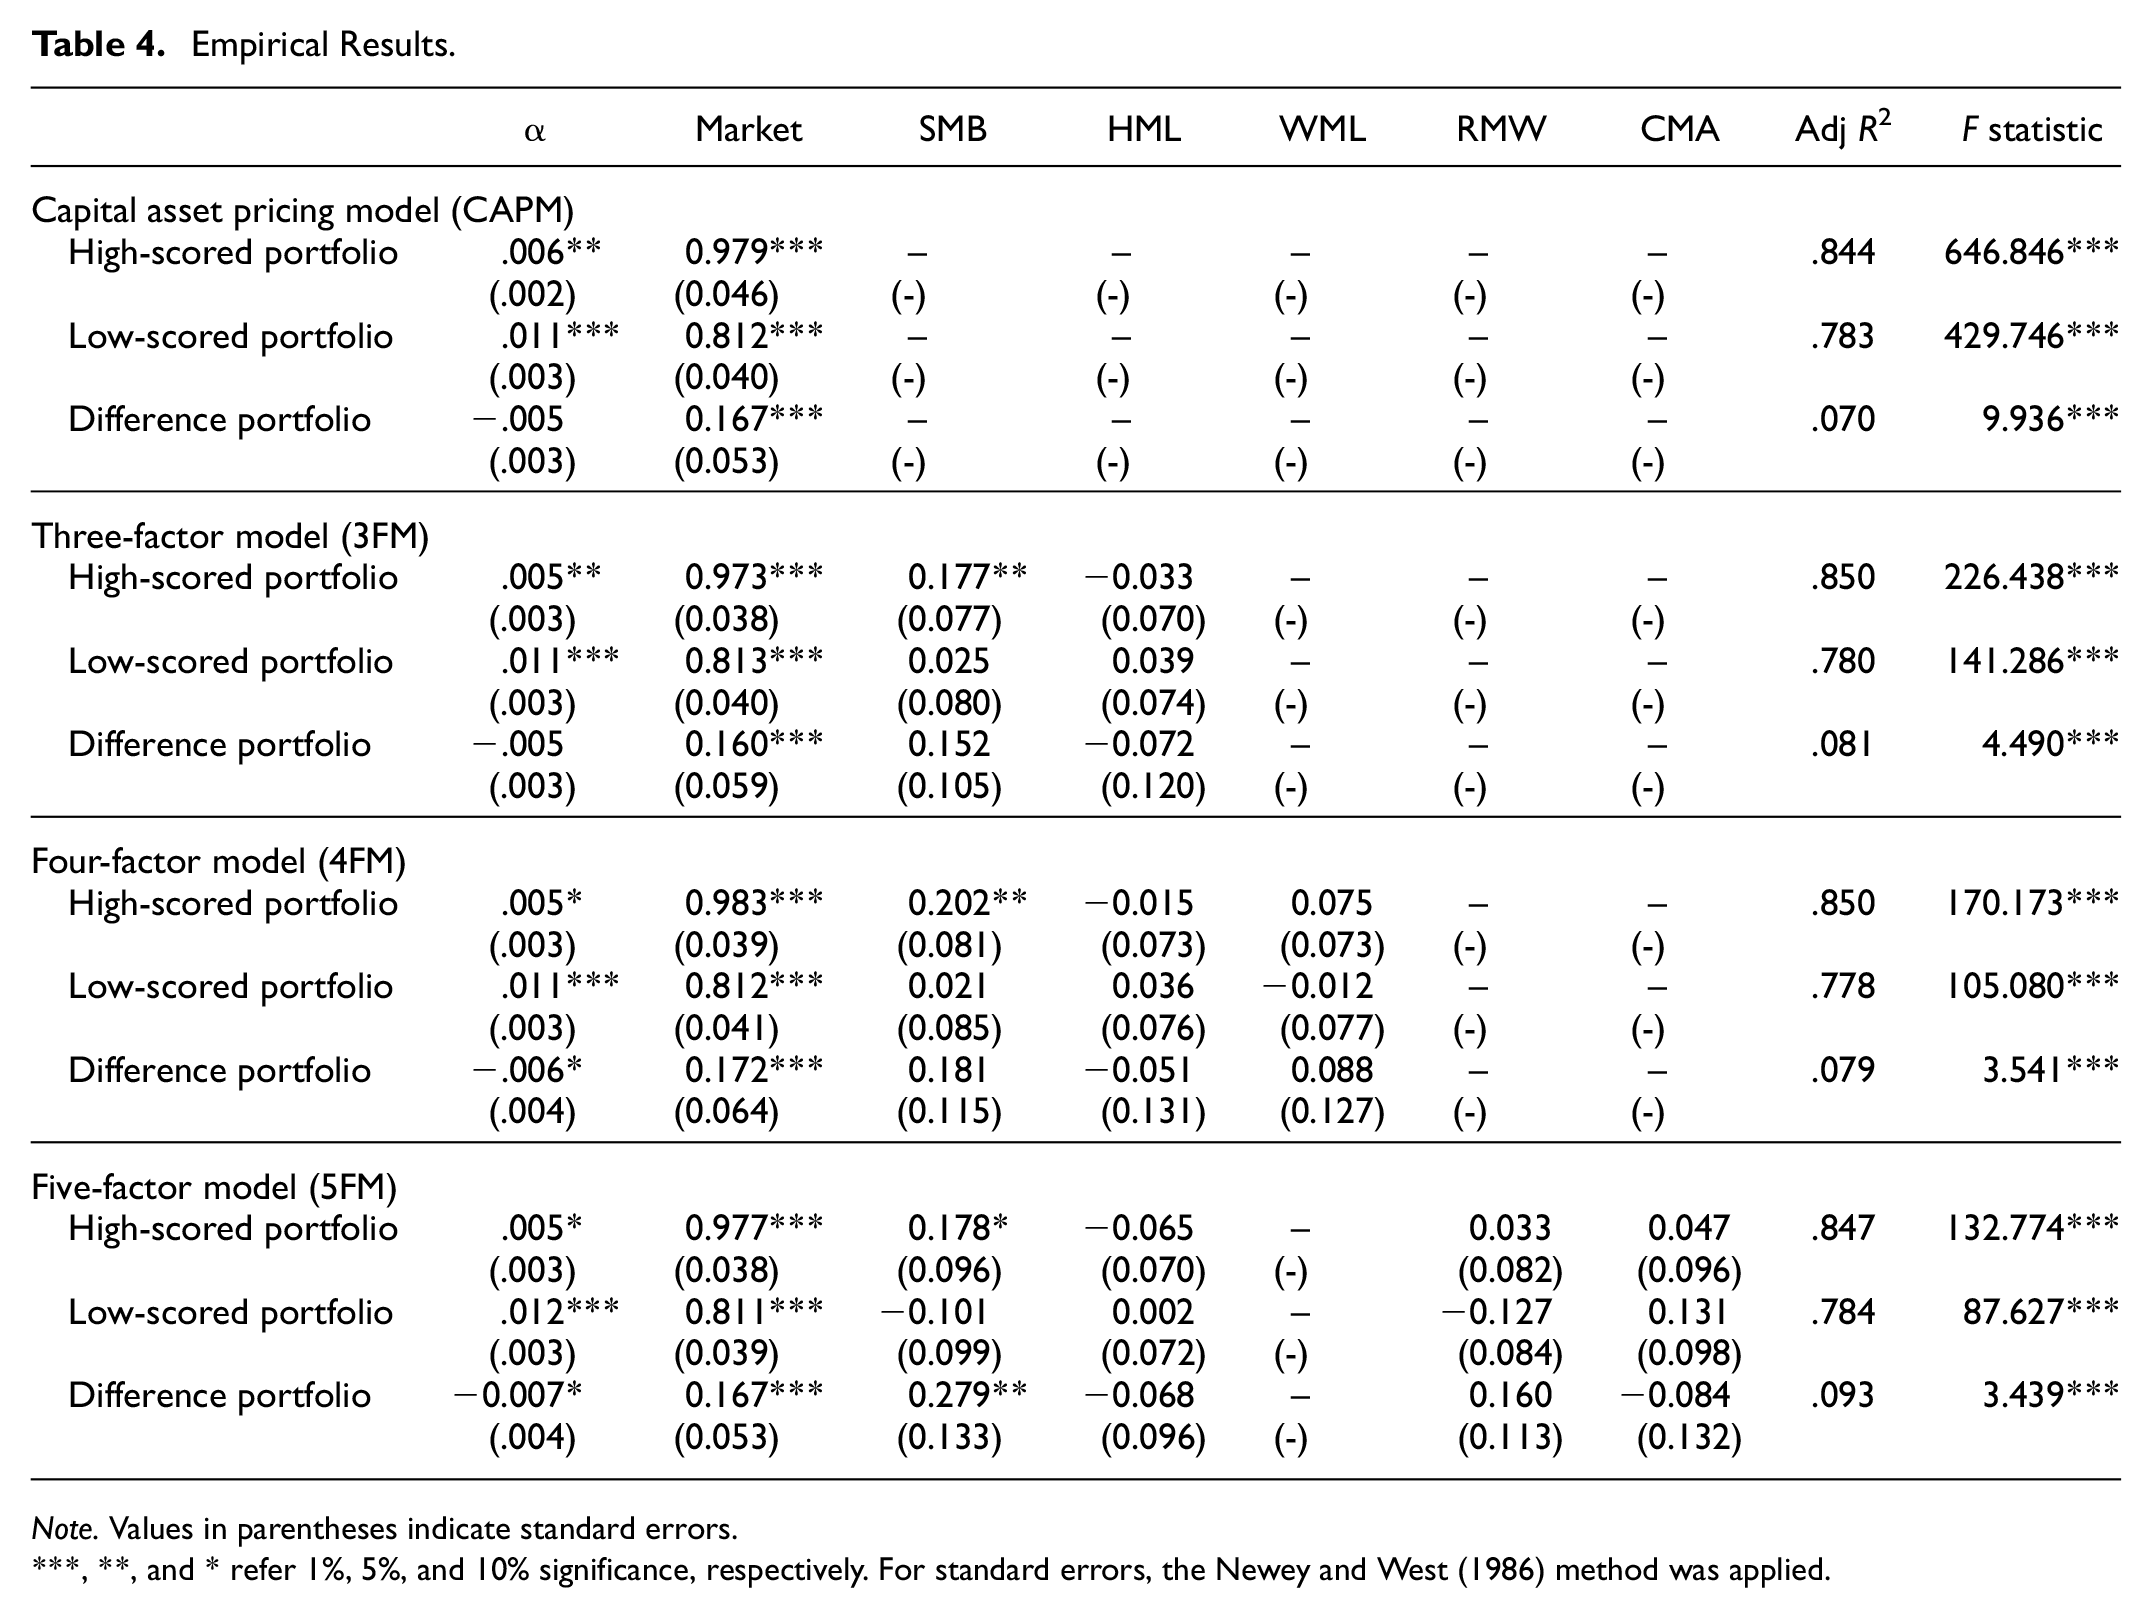
Note. Values in parentheses indicate standard errors.
***, **, and * refer 1%, 5%, and 10% significance, respectively. For standard errors, the Newey and West (1986) method was applied.
The performance of the high-scoring and low-scoring portfolios in 3FM is similar to the CAPM results. Unlike CAPM, 3FM includes SMB and HML factors. While the coefficient on SMB is significantly positive for the high-scoring portfolio, it is not significant for the low-scoring and difference portfolio. The HML coefficient is not significant for all three portfolios. According to the alpha estimates in 4FM and 5FM, the performance of both high-and low-scoring portfolios is significantly different from that of the market proxy. Unlike CAPM and 3FM, the alpha of the difference portfolio in 4FM and 5FM is negative and significant at the 10% level. According to this result, an abnormal return can be obtained with a trading strategy that represents buying portfolios that include companies with high CSR performance and selling portfolios that include companies with low CSR performance. However, the 10% significance level is weak in social science studies. While the coefficient on SMB in 4FM is significantly positive for the high-scoring portfolio, it is not significant for the low-scoring and difference portfolio. In 5FM, the coefficient on SMB is positive and significant at the 10% level for the high-scoring portfolio and difference portfolio. The coefficients of HML, WML, RMW, and CMA are generally insignificant in all models.
Additional Tests
To increase the reliability and validity of the results and strengthen robustness, we also used two alternative proxies for CSR performance. Following Artiach et al. (2010) and Lourenço et al. (2012), we first used the BIST Sustainability Index as a proxy for CSR performance. The BIST Sustainability Index was launched on November 4, 2014, by Borsa Istanbul with the code XUSRD. This index aims to increase the understanding, knowledge, and practices of sustainability, especially among Borsa İstanbul companies. The sustainability valuation results of Refinitiv are used to determine the companies to be included in the BIST Sustainability Index. Accordingly, companies to be included in the BIST Sustainability Index must meet three conditions: first, the company’s combined ESG score should be 50 or more. Second, each pillar score (environment, social, and governance) should be 40 or more. Third, at least of the category scores (resource use, emissions, innovation, workforce, human rights, community, product responsibility, management, stakeholder, CSR strategy) should be 26 or more (Borsa Istanbul, 2022). Therefore, it is understood that the social responsibility investments or ESG investments of companies that are not included in the index are insufficient. As Artiach et al. (2010) and Lourenço et al. (2012) stated, companies that are constantly included in the sustainability index make more financial and strategic investments in corporate sustainability performance than other companies. Moreover, the companies that are not included in the index are lacking in their corporate sustainability investments. Therefore, we used the criteria of whether companies are included in the BIST Sustainability Index to categorize companies into high-scoring and low-scoring groups. In the current study, the high-scoring portfolios cover companies that included the BIST Sustainability Index during the years 2014 to 2018. The low-scoring portfolios cover companies that are listed in the BIST All Shares Index but are never included in the BIST Sustainability Index during the years 2014 to 2018. After creating portfolios with high and low scores, we compared the performances of these two portfolios between July 2015 and June 2020. Table 5 shows the companies (excluding financial companies) included in the analysis during the sample period. period.
Sample for Analysis (BIST Sustainability Index vs. BIST All Shares Index).

Note. The number of companies in the BIST sustainability index is obtained from Borsa Istanbul (www.borsaistanbul.com).
The performances of the high-and low-scoring portfolios are compared using the models shown in the “performance measurement” section. The findings of CAPM, 3FM, 4FM, and 5FM are presented in Table 6. According to the CAPM results, the alpha of both high-scoring and low-scoring portfolios is positive and statistically significant at the 5% level. This result indicates that the performance of both portfolios is significantly different from that of the market portfolio. In the CAPM, the results of the difference portfolio are not reported. This is because the F statistic of the model is not significant. Additionally, the market coefficient (beta) of both portfolios is positive and significant at the 1% level.
Empirical Results (BIST Sustainability Index vs. BIST All Shares Index).

Note. The results of the difference portfolio in the CAPM were not reported because the F statistic was insignificant. Values in parentheses indicate standard errors. ***, **, and * refer 1%, 5%, and 10% significance, respectively. For standard errors, the Newey and West (1986) method was applied.
The alpha coefficients of the high-, low-, and difference portfolios are statistically insignificant in 3FM, 4FM, and 5FM. This result indicates that the performance of the high-scoring and low-scoring portfolios is not superior to that of the market portfolio. Accordingly, no investor can provide a superior return by investing in companies with high or low CSR performance. Additionally, these results show that there is no difference between the performance of portfolios with high and low scores. According to this result, an abnormal return is not obtained with a trading strategy that represents buying portfolios that include companies with high CSR performance and selling portfolios that include companies with low CSR performance. The results for the trading strategy in Table 6 are similar to those in Table 4. The coefficients of market and SMB factors for high-scoring and low-scoring portfolios are positive and significant at the 1% or 5% levels. The coefficient of the HML factor differs in the models for the high-, low-, and difference portfolios. Accordingly, while HML is significant in some models, it is insignificant in some models. The coefficients of the WML, RMW, and CMA factors are generally insignificant for 4FM and 5FM.
This study used the scores under the “Stakeholders” heading of corporate governance ratings as another CSR performance proxy. In Turkey, some international organizations (such as Kobirate and Saha) evaluate different number of companies each year. These institutions generally determine the corporate governance performance of companies according to the headings specified in the Corporate Governance Communiqué published by the Capital Markets Board in 2004. In this communique, corporate governance principles are presented under four headings: shareholders, public disclosure and transparency, stakeholders, and the board of directors. The following items are included under the Stakeholders heading (Capital Markets Board of Turkey, 2004): (1) Company policy regarding stakeholders. (2) Supporting the participation of stakeholders in company management. (3) The company’s human resources policy. (4) Relationships between customers and suppliers. (5) Ethical rules and social responsibility. Organizations that evaluate Turkish companies often use these items to calculate their stakeholder scores. Considering the definition of CSR and the dimensions and categories of CSR, we believe that these items can be used as proxies for CSR performance as similar proxies have been used in some studies (see Su et al., 2016). The number of companies with stakeholder score and the number of companies without stakeholder score, but listed in the BIST All Shares Index, are shown in Table 7.
Sample for Analysis (Companies with Stakeholder Score vs. Other Companies).
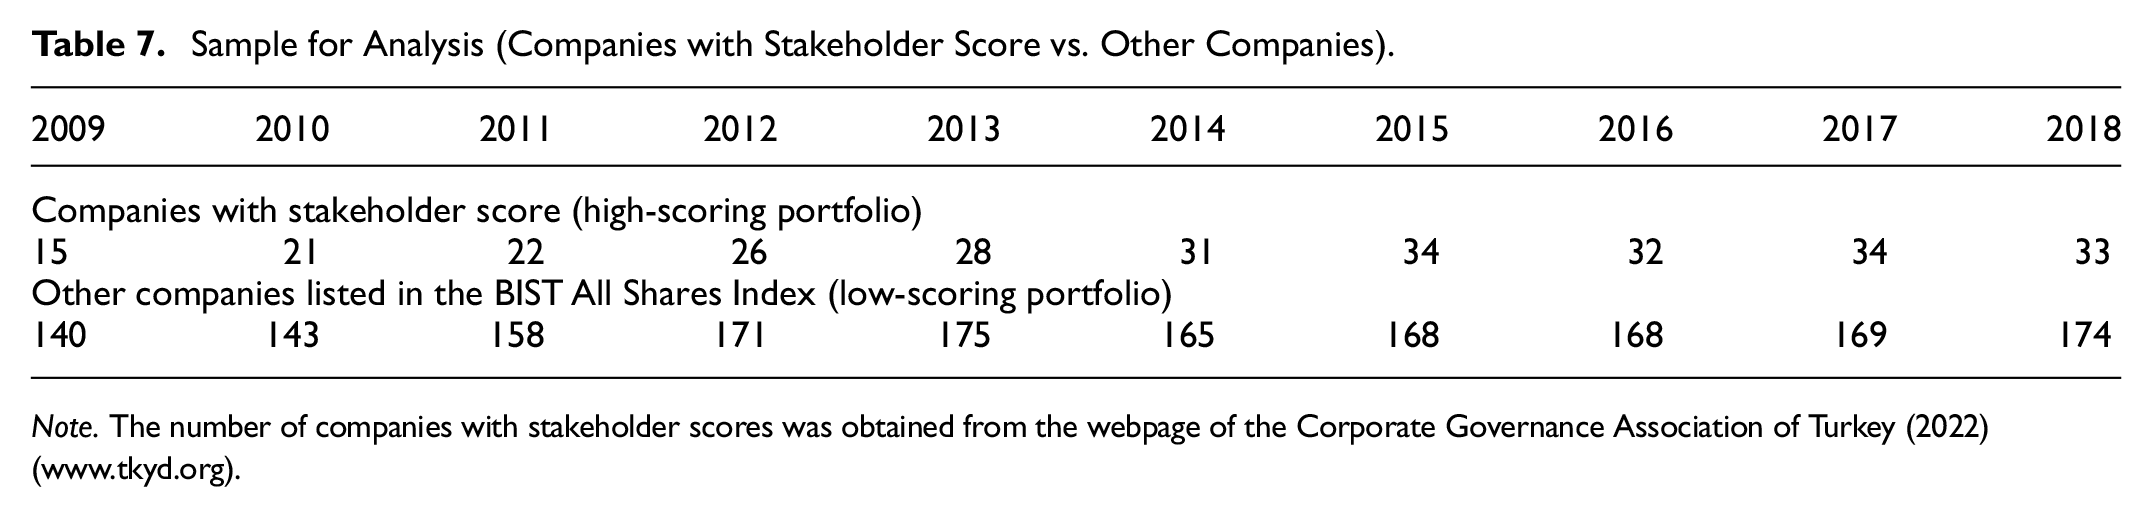
Note. The number of companies with stakeholder scores was obtained from the webpage of the Corporate Governance Association of Turkey (2022) (www.tkyd.org).
Table 7 presents the number of companies (excluding financial companies) included in the portfolio analysis each year throughout the study sample. Portfolios with high CSR scores cover companies with stakeholder scores. Portfolios with low CSR scores cover other companies listed in the BIST All Shares Index, but do not have a stakeholder score.
According to the CAPM results in Table 8, the alpha of both high-scoring and low-scoring portfolios is positive and statistically significant at the 1% level. This indicates that the performance of both portfolios is significantly different from that of the market portfolio. Additionally, the market coefficient (beta) of both portfolios is positive and significant at the 1% level. In the 3FM, 4FM, and 5FM, the alpha coefficient of the high-scoring portfolio is statistically significant, while the alpha coefficients of the low-scoring and difference portfolios are insignificant. These results show that the performance of high-scoring portfolios is superior to that of market portfolios, while the performance of low-scoring portfolios is inferior to that of market portfolios. In addition, these results show that there is no difference between the performance of portfolios with high and low scores. Therefore, an abnormal return is not obtained with a trading strategy that represents buying portfolios that include companies with high CSR performance and selling portfolios that include companies with low CSR performance. The results for the trading strategy in Table 8 are similar to the results in Tables 4 and 6.
Empirical Results (Companies with Stakeholder Score vs. Other Companies).
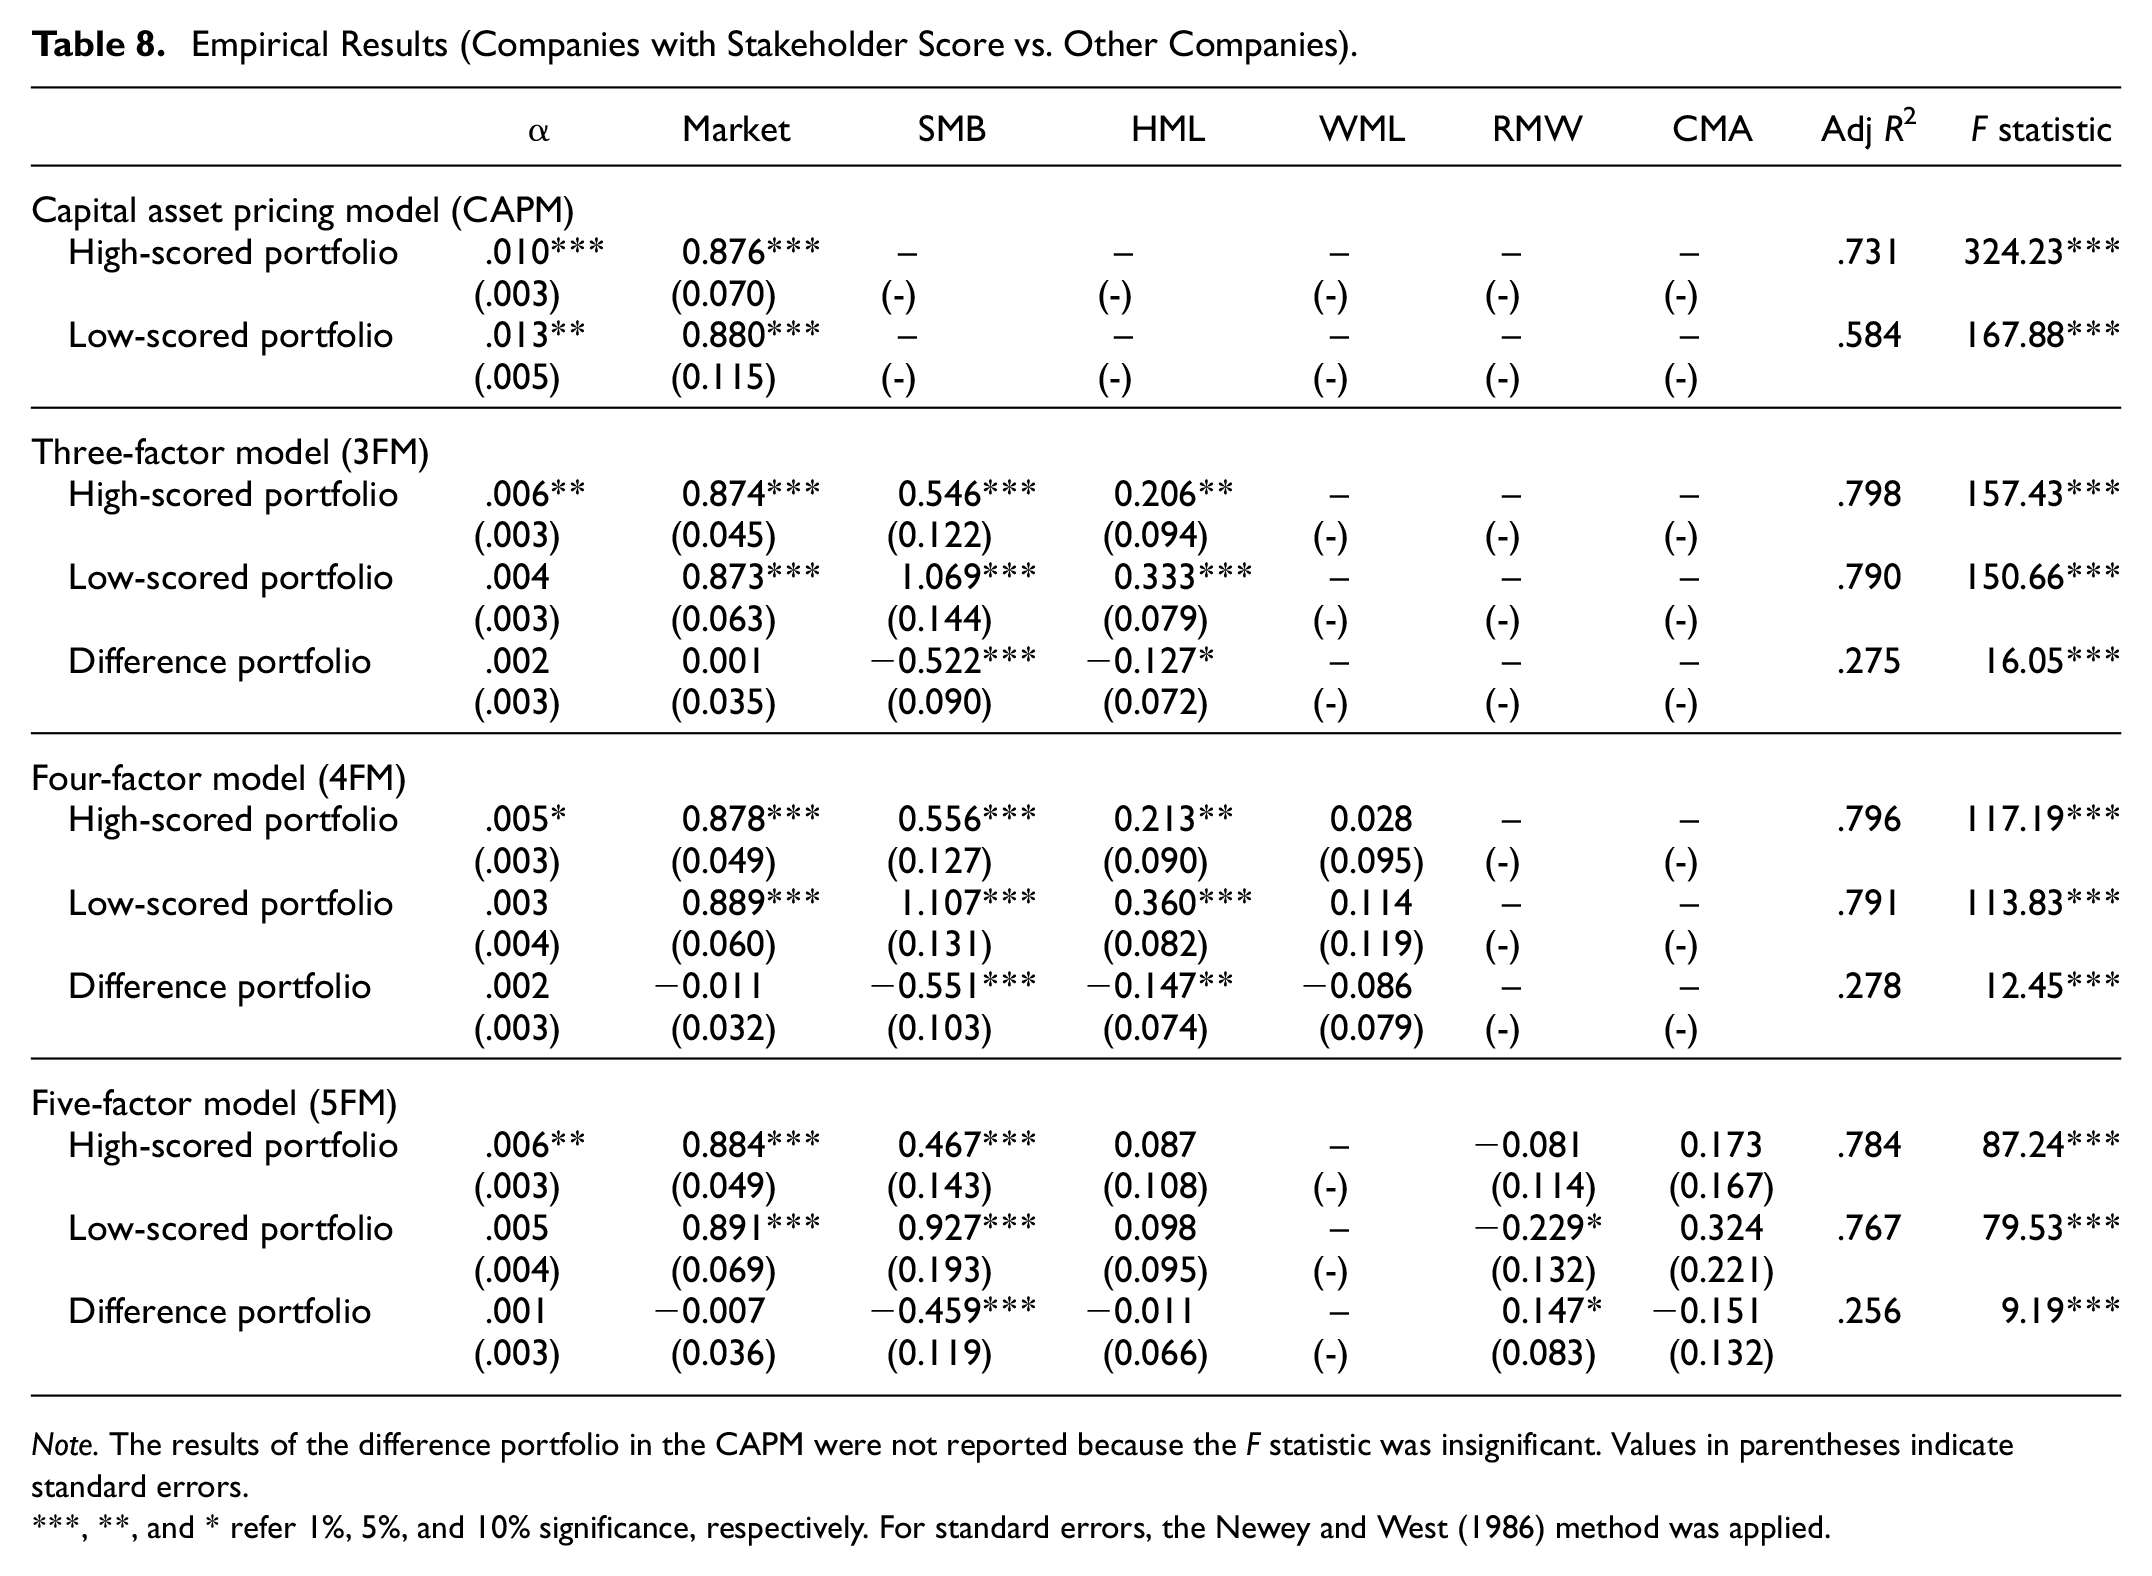
Note. The results of the difference portfolio in the CAPM were not reported because the F statistic was insignificant. Values in parentheses indicate standard errors.
***, **, and * refer 1%, 5%, and 10% significance, respectively. For standard errors, the Newey and West (1986) method was applied.
In the 3FM, 4FM, and 5FM, the beta coefficients of both the high-scoring and low-scoring portfolios are positive and significant at the 1% level. However, the beta coefficients of the difference portfolios are insignificant. Therefore, the systematic risks of high-and low-scoring portfolios are not significantly different. The SMB coefficients for the high-, low-, and difference portfolios are significant at the 1% level. The HML coefficients in the 3FM and 4FM are positive and significant at the 1% and 5% levels for the high-and low-scoring portfolios. However, the HML coefficients in 5FM are not significant. In addition, the WML and CMA coefficients are not significant. Finally, while the RMW coefficient for high-scored portfolios is insignificant, it is significant at the 10% level for low-scored and difference portfolios. These results show that high- and low-scoring portfolios generally do not differ in terms of WML, RMW, and CMA factors. In other words, the momentum, profitability, and investment performance of companies with high and low CSR scores are similar.
Conclusion
We examined the CSR portfolios’ performance based on the ESG score using CAPM, 3FM, 4FM, and 5FM between July 2010 and June 2020 in Turkey. For this, we formed two portfolios with high and low CSR performance from stocks traded in Borsa Istanbul (BIST). The results revealed that the alpha coefficient of the portfolio that includes stocks of companies with high CSR performance is generally positive and significant. This result shows that the past CSR performance of companies provides valuable information for investors. Furthermore, based on this information, investors can achieve a superior performance against the market. The result indicates that the market is inefficient in terms of CSR knowledge. We also evaluated the performance of the trading strategy. This strategy represents buying portfolios that include companies with high CSR performance and selling portfolios that include companies with low CSR performance. The alpha of the difference portfolio, which shows the difference between the performances of the two portfolios, is statistically insignificant in most cases. This suggests that there is no proof that portfolios that include companies with high CSR performance are superior to portfolios that include companies with low CSR performance. Additionally, we measured the performance of the trading strategy by using two more proxies for CSR to support these results. These proxies are the BIST Sustainability Index and stakeholder scores. Additional analysis results also show that there is no difference between the performances of the two portfolios. Therefore, the trading strategy does not provide abnormal returns. These results regarding the trading strategy are consistent with those of Hamilton et al. (1993), Humphrey et al. (2012a, 2012b), Halbritter and Dorfleitner (2015), and Auer and Schuhmacher (2016). Consequently, our main result provides supporting evidence for the “no effect” hypothesis.
Another important result is that the systematic risks of high-scoring and low-scoring portfolios are positive and significant at the 1% level in all models and all proxies. That is, the betas of both portfolios are positive and significant. However, in the first analysis, in which ESG is used as a proxy for CSR performance, the beta coefficient of the difference portfolios is significant in all models, while it is insignificant in all models in additional analyses using two different proxies (BIST sustainability index and stakeholder score). Therefore, the results on whether the systematics risks of companies with high and low CSR performance are different are not consistent. Similarly, the coefficients of the SMB and HML factors show conflicting results. While these coefficients are significant in some models, they are insignificant in others. The WML, RMW, and CMA coefficients were generally insignificant in all models and all proxies. This shows that portfolios do not differ with regard to momentum, profitability, and investment. These factors are not important when comparing the performances of high-scoring and low-scoring portfolios. When all these findings are evaluated together, the following results emerge:
(1) CSR performance is an important information for investors. Investors can obtain an abnormal return by buying the stocks of companies with high CSR performance.
(2) The alpha coefficients of the difference portfolios are insignificant at the 1% and 5% levels for all CSR proxies and all models. In other words, a buy-and-sell strategy based on CSR information does not provide an abnormal return.
(3) The WML, RMW, and CMA factors were mostly insignificant. Therefore, we recommend using the 3FM alpha instead of CAPM, 4FM, and 5FM alpha when evaluating the performance of a portfolio constructed according to CSR information. Additionally, we recommend that different proxies should be considered for CSR performance in the analyses, as the SMB and HML factors show conflicting results.
The potential limitation of this study is the limited number of companies engaged in CSR activities in Turkey. Additionally, no companies are engaged in CSR activities in every sector. Therefore, it is not possible to test whether the results obtained in this study are sensitive to the sector. In future studies, with an increase in the number of Turkish companies engaged in CSR activities in various sectors, different results can be expected in this direction.
Footnotes
Declaration of Conflicting Interests
The author(s) declared no potential conflicts of interest with respect to the research, authorship, and/or publication of this article.
Funding
The author(s) received no financial support for the research, authorship, and/or publication of this article.