
Abstract
This study explores the late coronavirus disease 2019 (COVID-19) pandemic, particularly, 2022Q1 to 2022Q3, to analyze the stock returns of industries expected to have a direct impact. The aim is to identify the factors influencing stock returns and to provide investment strategies, focusing on investment risk control (loss aversion). A total of 193 common stocks listed on the Taiwanese stock market were collected from four major industries: sports, restaurants, biotechnology, and epidemic prevention. Using the past information set (2021Q4): variables in three dimensions—firm characteristics, financial indicators, and corporate governance—are used to construct a stock investment strategy model. Empirical evidence shows the existence of differences in the stock investment advantages of some industries and firm characteristics and the lack of investment advantages of epidemic prevention stocks in 2020. The decision-tree model has a precision of 79.4% and an accuracy of 72.0%. The five most important factors affecting stock returns are market value, cash flow adequacy ratio, return on assets, Tobin’s Q, and price/book value. The scheme inducting three types of losses of return (loser) and one type of profit (winner) is summarized for reference. Second, it confirms the correlation between past information sets and stock returns, suggesting that Taiwan’s stock market was inefficient during the late stage of the COVID-19 pandemic. Finally, this study’s findings can be used as a reference for future fund managers and investors when handling similar events.
Plain Language Summary
This study explores the late COVID-19 pandemic, particularly, 2022Q1 to 2022Q3, to analyze the stock returns of industries expected to have a direct impact. The aim is to identify the factors influencing stock returns and to provide investment strategies, focusing on investment loss aversion. A total of 193 common stocks listed on the Taiwanese stock market were collected from four major industries: sports, restaurants, biotechnology, and epidemic prevention. Empirical evidence shows the existence of differences in the stock investment advantages of some industries and firm characteristics and the lack of investment advantages of epidemic prevention stocks in 2020. The decision-tree model has a precision of 79.4% and an accuracy of 72.0%. The five most important factors affecting stock returns are market value, cash flow adequacy ratio, return on assets, Tobin’s Q, and price/book value. The scheme inducting three types of losses of return (loser) and one type of profit (winner) is summarized for reference. Second, shows that Taiwan’s stock market was inefficient during the late stage of the COVID-19 pandemic. Finally, this study’s findings can be used as a reference for future fund managers and investors when handling similar events.
Keywords
Introduction
In March 2020, the World Health Organization (WHO) classified coronavirus disease 2019 (COVID-19) as a global pandemic. The pandemic has been ongoing internationally for more than 3 years. In the early stages of the pandemic, as vaccines and specific drugs were not yet available for the arrival of new viruses, most countries adopted strict quarantine policies, travel restrictions, and lockdowns (Farooq et al., 2022). These policies restricted daily activities to prevent the spread of the epidemic. The COVID-19 pandemic has had a wide-ranging impact on life and the economy (Jiang et al., 2021). Under the impact of the pandemic, global stock markets suffered significant losses, with a sharp decline partially due to headwinds such as lockdowns that limited economic activity (Chundakkadan & Nedumparambil, 2021). In particular, some emerging stock markets have a greater impact than the developed ones (Hashmi et al., 2021).
With the advent of vaccines and the flurry of economic relief measures implemented by many governments, the panic that people feel has gradually become less, and they become less helpless about the impact of the pandemic. To et al. (2023) also confirmed that mass vaccination brings more optimism to stabilize the economy and financial markets and that the impact of the late epidemic on the stock market is intuitively less direct and psychologically frustrating than the initial shock. The highest peak of the pandemic in Taiwan began in 2022Q1 to 2022Q3, which was part of the late stages of the global COVID-19 pandemic, providing an opportunity to examine the pandemic’s impact on local stock markets in the late stage. Mazur et al. (2021) showed that the initial COVID-19 pandemic (March 2020) has led to different directions and degrees of impact on stock-based returns for different industry classes. Dharani et al. (2023) stated that the COVID-19 pandemic have a heterogeneous impact on stock prices across industries. For example, Boldeanu et al. (2022) confirmed that metallurgical, IT, and C-related industries had the greatest impact. Therefore, this study focuses on industries that are expected to be affected by the epidemic to understand whether the late epidemic also has a heterogeneous impact on the stock prices of these industries.
In the literature on the COVID-19 pandemic’s impact on the stock market, the proposed investment strategy focuses on hedging portfolios with short-term industrial risks during the pandemic (Boldeanu et al., 2022; Shahzad et al., 2021b). There remains a lack of investment strategies and plans to address the long-term impact of the pandemic. In addition, most previous studies that have explored the impact of the pandemic on stock returns have used econometric models or statistical methods. However, these methods have some limitations on the study variables; therefore, this study used data mining as a study tool to avoid the problem that the study variables have limitations. The objectives (expected contributions) of this study are as follows:
(1) To explore the impact of the COVID-19 pandemic on the Taiwanese stock market in 2022Q1 to 2022Q3 and to test the difference in stock price returns between industrial stocks in the sports, multinational chain restaurants, biotechnology, and epidemic prevention industries. The results confirm that the effect of the epidemic and industry heterogeneity still exist in the Taiwanese stock market.
(2) From the perspective of investors’ risk management, the loss of stock returns is defined as the target variable (dependent variable). The independent variables of the three dimensions—firm characteristics, financial indicators, and corporate governance—in the quarter before the outbreak of the epidemic (2021Q4) are considered past information sets. Data mining (classification and regression trees; CRT) is used to establish an evaluation model for stock return losers.
(3) Important factors and investment rules that affect stock returns in the late epidemic are identified using the tree model to provide reference guidance for future investment decisions.
(4) According to the tree model, some independent variables (past information sets) can be used as important variables to predict future stock returns (target variables).
This result leads to the inference that the Taiwanese stock market does not fit the efficient market hypothesis (EMH; Fama, 1970), based on the EMH’s argument that past information sets are irrelevant to future stock returns. When past information sets had a significant impact on future stock returns, they failed to support the EMH of the Taiwanese stock market, confirming the inefficiency of the market during the late stage of the COVID-19 pandemic.
This paper is organized as follows. Section 2 presents the literature review; Section 3 presents the data and methodologies; Section 4 presents the results; and finally, Section 5 presents the conclusions.
Literature Review
Some studies have explored the impact of COVID-19 on the stock market or financial instruments, whereas others believe that the return rate has a significantly negative or no effect (Al-Awadhi et al., 2020; Li et al., 2022; Liu & Lee, 2020, 2022; Liu et al., 2020; Wang & Liu, 2022; Wu et al., 2021). Bouri et al. (2021) analyzed the changes in the structural and return relationships of various assets (e.g., gold, crude oil, world equities, currencies, and bonds) due to the COVID-19 outbreak and confirmed its rapid troubling impact of the COVID-19 outbreak. In addition, Liu et al. (2020) confirmed that the coronavirus outbreak had a short-term negative abnormal return for stock market indices in affected countries, such as Japan, South Korea, Singapore, the United States, Germany, Italy, and the United Kingdom. Sun et al. (2021) explored the impact of COVID-19 on the Chinese stock market. They found that the pandemic had an overall negative impact on the stock market during the post-event window. The impact on stock returns is more significant for stocks with higher price-book (PB) value, price/earnings (PE), market value, lower net assets, and institutional stock ownership ratios.
Shahzad et al. (2021a) studied the impact of the COVID-19 outbreak on the network dynamics of industrial stock prices in the U.S. stock market. Network reorganization was found during the pandemic, and the dominant clusters became more closely connected. Therefore, it was believed that the industrial topology did not collapse due to the pandemic. Many studies have confirmed that stock prices can vary across industries due to the COVID-19 pandemic. For example, Mazur et al. (2021) confirmed the March 2020 stock market crash due to the pandemic and the pandemic’s stock prices across different industries. Healthcare, pharmaceutical, digital, and agriculture-related industries have benefited (Mazur et al., 2021; Sun et al., 2021), but have harmed the stock prices of entertainment, hospitality, tourism, and international transport services industries (Mazur et al., 2021; Shahzad et al., 2022; Wu et al., 2021). Aslam et al. (2023) studied the dynamic relationship between the prices of industrial stocks in the Pakistani stock market. The stock market was driven by the oil and gas marketing and exploration departments and was highly dependent on commercial banks, fertilizers, power generation and distribution, and auto parts and accessories.
Adnan and Johani (2023) confirmed that the manufacturing sector is more pessimistic than the non-manufacturing sector due to the pandemic, but the pharmaceutical, IT, and telecommunications industries are expected to benefit from the pandemic. Farooq et al. (2022) confirmed that equities in developing countries have significantly negative abnormal returns in response to the second wave of COVID-19. Finally, studies confirm that the impact of COVID-19 on stock markets varies widely across countries, particularly in China and South Korea (Jiang et al., 2021).
The effectiveness of the stock market during the pandemic has received considerable attention. Chakraborty (2023) found that investors in the Indian stock market made irrational investment decisions during the COVID-19 crisis and that the inefficiency of the market brought instability to the stock market. Adnan and Johani (2023) confirmed the inefficient market activity during the pandemic in the Dhaka securities market over a short period. Under the EMH, past, present, and even future information sets are immediately, adequately, correctly, and effectively reflected in stock prices (Fama, 1970). Therefore, stock prices are unpredictable, and any investment strategies cannot beat the market in the long term to obtain an excessive return. Conversely, when the market is inefficient or partially inefficient, certain information sets can be used to explain or predict stock price adjustments (Azarnejad & Khaloozadeh, 2022; Liang et al., 2022; Lv & Qi, 2022).
For example, variables that utilize firm characteristics are listed, and the foundation years, firm size (market value), debt rates, EPS, and enterprises’ new investment activity intent (Tobin’s Q; Liu, 2021) are analyzed. Chen et al. (2021) used financial ratios to study capital gains and losses in stock markets. Excluding the unpredictable limitation view of the stock market, data mining and artificial intelligence methods were used to study stock market capital gains and losses. Past stock prices are used to learn and evaluate financial indicators to gain useful knowledge and as a technology and strategy for predicting stock prices so that they can be used in decision-making algorithms to trade stock programs (Fiol-Roig et al., 2010).
In corporate governance, Carvalhal and Nobili (2011) confirmed that governance explains the average return on stocks and that governance factors seem to be more powerful than business size and financial accounting factors. Corporate governance is negatively correlated with the risk of stock price crashes and a higher level of corporate governance can effectively reduce the likelihood of future share price crashes. Wang et al. (2021) recommended strengthening corporate governance to reduce the risk of sharp declines in stock prices. Additionally, institutional investors’ shareholdings positively correlate with corporate stock price crash sensitivity (the conditional probability of individual stocks crashing during a market crash; Pan et al., 2021). A significant negative correlation exist between equity concentration and the average daily return rate. The highest concentration of shareholder ownership and the impact of foreign ownership on stock prices are significant for specific information (Gul et al., 2010). Nguyen et al. (2019) confirmed that foreign ownership has a significant impact, with an increase in the proportion of foreign ownership, leading to an improvement in stock returns and a higher price risk. This section describes variables regarding firm characteristics, corporate governance, and financial indicators. If these variables belong to past information, based on the EMH, the set of past information is fully reflected in the stock price. Therefore, without losing generality, these variables cannot be used to predict or analyze future stock prices.
Decision trees are a common methods of data mining (Rokach & Maimon, 2014). This is an algorithm with supervised learning capabilities that classifies data into different attributes according to specific rules. According to the importance of the explanatory variables, the classification rules were found to achieve a tree-like hierarchical classification structure. The established tree structure model summarizes important rules and makes predictions for unknown samples. It is widely used in finance (Basak et al., 2019; Chen et al., 2021; Coelho et al., 2007). For example, bankruptcy prediction models have been used to build financial crises in Taiwan’s electronics industry (Chen et al., 2021) and apply detection models for stock market manipulation (Liu et al., 2021). Cheng et al. (2021) explored the relationship between financial indicators, corporate governance, and stock returns in the sports and leisure industries through decision trees to establish a stock investment decision model. Most of these studies were based on the superior predictive power of the analysis model.
Data and Methodologies
Empirical Data
This study explored common stocks listed on the stock exchange market (SEM) and over-the-counter (OTC) in Taiwan and collects data from 193 companies in the sports industry, multinational chain restaurants, epidemic prevention concepts, and biotechnology industry based on the concept of stock or industry classification on Taiwan’s Yahoo stock market website. The rationale for collecting data on the sports industry (31 stocks) and multinational restaurant chains (18 stocks) is that the pandemic will introduce control measures and restrict people’s activities. Therefore, reducing consumer demand in these industries is necessary, which is expected to have a negative impact (–). The biotechnology industry (128 stocks) and epidemic prevention concept stocks (49 stocks, some with double counting and classification into other industries) are expected to be affected by the epidemic and have positive stimulus demand (+) in related industries (e.g., medical materials, drugs, and people’s livelihood supplies). In addition, epidemic prevention concept stocks were released through the Yahoo Finance website during the early stages of the pandemic (2020Q1), which was recommended by professional investors. These investors include industry researchers, investment experts, stock analysts, and professional investment institutions. This portfolio consisted of stocks expected to directly benefit the company’s operations as due to the impact of the COVID-19 pandemic, including companies that produce vaccines, biotechnology, pharmaceuticals, medical devices (masks), and daily necessities (disinfectant detergents). This belongs to the general expectation of market investors in the early stages of the global pandemic (Q12020) for the impact of future pandemics (the total number of infected people in Taiwan in 2020 was only 823, according to the statistics of Taiwan’s Department of Health, whereas the total number of infected people from overseas immigration accounted for 92.47%). It is believed that these stocks will benefit and contribute to firm performance or stock prices, with a positive effect.
These industry stocks are those that investors generally expect to be more affected by the COVID-19 pandemic. This study collected the proxy variables of these stocks in Q4 of 2021 in three dimensions (this is information before the COVID-19 pandemic in Taiwan), such as firm characteristics and basic situation, financial indicators, and corporate governance, and collected the stock price and return rate from 2022Q1 to 2022Q3. This period covered the peak of Taiwan’s major COVID-19 pandemic (weeks 12–36 of 2022, the more intense period; the total number of infected people in the entire year exceeded 8.85 million, accounting for about 38.5% of the total number in Taiwan). If the time interval between the past information set and the predicted value is too long, the prediction accuracy may decrease. These data explore the extent to which past information sets explain the loss of stock returns during the COVID-19 pandemic. The tree model identifies important return loser (win) rules to provide a reference for fund managers or stock market investors in investment strategies or risk management during similar major public health crises in the future and as an inference of stock market efficiency during the COVID-19 pandemic in Taiwan. The empirical data for this study were obtained from the Taiwan Economic Journal Database (TEJD).
Study Variables
(1) Dependent variable: The dependent variable (target variable) is a measure of whether a stock held has fallen in price and incurred losses. Therefore, the binary variable was defined as a loser variable. When the stock price in 2022 moves from Q1 to Q3, the rate of return is less than or equal to 0, given that the loser variable is equal to 1; a return rate greater than 0 is given in that the loser variable is equal to 0. At this point, the return rate = (stock trading price at the end of the period-stock trading price at the beginning of the period)/stock trading price at the beginning of the period × 100%.
(2) Candidate independent variables: (1) Firm characteristics and basic situation (13 indicators): Listing the market (SEM = 1; OTC = 2), sports industry (Yes = 1; Non = 0), epidemic prevention (Yes = 1; Non = 0), multinational chain restaurants industry (Yes = 1; Non = 0), biotechnology industry (Yes = 1; Non = 0), trading price (the price of the stock is the closing price of the last trading price in 2021; NT$), and year of establishment (year). Tobin’s Q ratio was employed to explain the enterprises’ new investment activity intent. Tobin’s Q ratio higher than 1 indicates that the firm’s stock price is higher than the distribution cost. The firms have a higher intention to invest or capital increased (Liu, 2021). Dividend yield (%), price-to-sales ratio (PSR), PB ratio, number of employees (people), market value (unit: million NT$), and risk variable (whether the company has experienced financial crises, major financial events, suspensions due to poor prosperity, asset hollowing out and misappropriation, value impairment, negative net value, large losses, and low net worth in the past 5 years: Yes = 1 and Non = 0).
In addition to considering the company’s basic situation and stock price, the above characteristics also refer to the factors set by Liu (2021) on firm characteristics, such as the listing market, year of establishment, size (market value and number of employees), and growth opportunities (PB and Tobin’s Q ratios). However, the short-term impact (no more than one-quarter) was explored by Liu (2021), whereas this study is at least three-quarters long. The industrial variables are based on the industrial attributes of the sample to define four dummy variables: sports, epidemic prevention, multinational chain catering, and biotechnology. Finally, based on the superiority of the decision-tree method, it can accept a wider range of candidate independent variables in advance; therefore, these variables can be considered.
(2) Financial indicators (19 indicators): These data are derived from the financial ratios disclosed in statutory financial statements prepared by listed companies on a quarterly basis. This information is often provided on publicly available financial information websites in Taiwan (e.g., websites that can be linked to the “Market Observation Post System” through the Taiwan Stock Exchange at: https://emops.twse.com.tw/server-java/t58query) to provide market investors with access to the company’s financial information. The selection of financial indicators was partially based on Barak and Modarres (2015), and 19 commonly used financial indicators were selected considering Taiwan’s habitual use. Divided into four main categories: (i) financial healthy: current ratio (%), quick ratio (%), debt ratio (%), and interest protection multiples (%); (ii) efficiency: accounts receivable turnover (time), days payable outstanding (time), inventory turnover (time), average days in sales (%), fixed assets turnover (%), and total asset turnover (%); (iii) profitability: return on assets (ROA; %), return on equity (ROE; %), operating profit/actual receipt capital (%), income before tax/actual receipt capital (%), net interest rate after tax (%), and earnings per share (EPS; NT$); (iv) cash flow (Foerster et al., 2017; Jooste, 2006): cash flow coverage ratio (%), cash flow adequacy ratio (%), and cash reinvestment rate (%).
(3) Corporate governance (six indicators): This is based on the shareholding structure, board size, and membership (Paniagua et al., 2018). The variables, including equity and control, in, order are the total shareholding ratio of directors and supervisors (%), the total shareholding ratio of the top 10 shareholders (excluding directors and supervisors; %), the total shareholding ratio of managers (including concurrent directors and supervisors; %), the total number of directors (people), the number of independent directors (people), and the year of election of the board of directors and supervisors (Yes = 1 and Non = 0).
Decision Tree
This study used the CRT (Breiman et al., 1984) for modeling. In this classification method, the Gini index was used as a criterion for determining the branching variables, and the data in each branching node were classified to establish the structure of the decision tree with binary classification. The decision tree-splitting criteria determine the width and depth of the tree by selecting the branch variables using the Gini index to determine the variable for the optimum branching result. In the process of establishing the branching of the decision tree, branch variables can be used repeatedly to classify the branch variables in different layers.
Suppose that a tree structure pattern is established with S as the learning dataset. In the S learning dataset, there are k categories, and the subset in the i category is
In the CRT method, the problem of the binary branching of independent variables of category patterns and continuous arguments can be resolved. The Gini index is a measure of the learning dataset S for all categories of impurities and is defined the Gini index as

The candidate branch variable is V, and there are

The impurity of candidate branch variable V will be equal to the value of the attribute under all splits
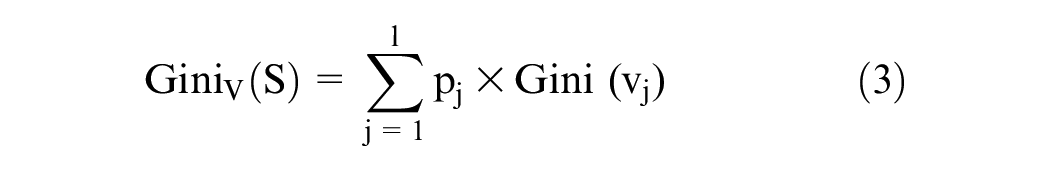
In equation (3), the variable is V as the impurity of the branching attribute. When a smaller

Given the condition of simplifying the problem and given node n, we consider calculating the Gini index and choosing whether to use the branch variable for binary classification. If it is assumed that node n is subject to a variable (attribute) that can be significantly used as a branching level under the condition c, the two sub-nodes left and right will be available:

In equation (5), if the ΔGini(n,c) the Δ 0, then the two sub-nodes on the left and right will be less than (equal to) the impurity of node n. Therefore, after adding the sub-nodes for the original tree in the impurity change, is increased (unchanged), and node n is not considered branching two sub-nodes. Conversely, if the impurity of the left and right nodes is greater than the impurity of node n, the branch sub-node that can be considered node n is considered. After the decision-tree structure pattern is modeled using a set of learning data, cost-complexity pruning methods can be used to trim unnecessary branching.
Results
Analysis of the Return Rate
Table 1 presents the stock return rate and mean difference analysis. The average return rate with a sample size of N = 193 is 1.411%, which is higher than the market index (proxy index is the Taiwan Capitalization Weighted Stock Index) return rate of −26.31% for the same period. This indicates that the investment performance of the sample is better than that of the stock market. From the perspective of the negative return rate of the market index, it is believed that the outbreak of the epidemic has a negative effect on stock prices and can affect a long time (6–9 months), consistent with that of Liu et al. (2020). There is a short-term negative effect on stock prices, which can be extended to the longer negative effect. Among the sample stocks (N = 193), based on the six variables of listing the market, sports industry, epidemic prevention, restaurants industry, biotechnology industry, and experienced crises (see the risk variable), the difference in the average return rate of different classes of stocks was analyzed using one-way analysis of variance (ANOVA). The results indicate that an average return rate of 6.712% for OTC is significantly higher than for SEM, with an average return rate of −4.058% (p = .016 < .05); the average return rate for epidemic prevention is −8.174% significantly lower than that of non-epidemic prevention of 4.672% (p = .012 < .05). COVID-19 did not benefit from the pandemic and showed a bear situation on epidemic prevention’s stock price. This investment performed well over the market index (−26.31%). In addition, compared to the same period in 2020 (2020Q1–2020Q3, early stage of the pandemic), the average return of epidemic prevention stocks/market index was 42.59%/4.23%. The investment performance of epidemic prevention stocks was also better than that of market index. From these results, whether it is in the early stage of the pandemic (anticipatory psychology) or in the later stage (the real outbreak of the epidemic in Taiwan), the stock price performance of epidemic prevention stocks is better than that of the stock market. This indicates that events occurred during the pandemic has a positive impact on epidemic prevention stocks. Finally, the prices of epidemic prevention stocks may have overreacted after a sharp rise in the early stages of the pandemic (anticipatory psychology). Consequently, when the pandemic broke out in the later period (2022Q1–2020Q3), stock price performance decreased slightly. Alternatively, it may be that the stock market reacts in advance to the end or ease of an epidemic in the future (the stock price retreats, ignoring good news).
Stock Return Rate and Mean Difference Analysis.

Represents significance at the 5% levels.
The average return rate of 5.182% for the biotechnology industry is significantly higher than the average return rate of the non-biotechnology industry of −5.521% (p = .022 < .05), which continues to reflect the positive news of the pandemic for the industry. Finally, companies that had experienced a major crisis in the past 5 years (risk variable = 1) had lower stock price performance (average return rate of −5.897%) than non-crisis stocks that did not experience a major crisis (average return rate of 4.551%) because the p = 0.032 < .05. Comparing the results for sports (M = −3.697%), restaurants (M = 9.737%), and biotechnology (M = 5.182%) in Table 1, the share price of the biotechnology industry rose, and that of the sports industry fell. These results are similar to those of Mazur et al. (2021), who argue that stock prices in healthcare and pharmaceutical-related industries are beneficial, whereas service industries, such as entertainment, are detrimental. However, the rise in the restaurant industry’s share price is different from the argument that the hotel industry’s stock price was harmful during the early COVID-19 period (Mazur et al., 2021). The reason for this difference may be that the industry’s stock price reflects this bearishness news in advance in the early stages of the epidemic or that the government has taken many relief measures and boosted policies for industries such as restaurants and hotels. The results of the mean difference analysis in Table 1 confirm the heterogeneity of the impact of the outbreak on the industrial stock price of the Taiwanese stock market during the late COVID-19 pandemic, thus supporting the views of Dharani et al. (2023) and Boldeanu et al. (2022).
Descriptive Statistics and Correlation Analysis
Table 2 presents the descriptive statistics and testing of the correlation coefficients between the candidate independent variables and the dependent variable (loser variable). Correlation analysis used Kendall’s and Spearman’s rank correlation coefficients in nonparametric statistics. Through these test results, the correlation between the candidate independent and dependent variables can be inferred. Specifically, the independent variables that are significantly related to the dependent variable can be found in advance. It can be used as an input variable for the next stage of decision-tree modeling. As presented in Table 2, the 11 indicators are epidemic prevention (correlation coefficient on the Kendall’s tau_b/Spearman’s rho: .188/.188), Tobin’s Q (0.159/0.194), PB (0.115/0.140), market value (0.173/0.212), risk variable (0.178/0.178), current ratio (0.126/0.154), debt ratio (−0.115/−0.140), ROA (0.108/0.131), ROE (0.099/0.122), cash flow adequacy ratio (−0.122/−0.150), and cash reinvestment rate (−0.132/−0.161). These indicators have a significant correlation with the dependent variable based on Kendall’s (or Spearman’s) correlation coefficient, which is significantly greater or less than zero (p < .05).
Descriptive Statistics of Candidate Independent Variables and Testing for Correlation Coefficient with their Dependent Variable (Loser).

and * represent significance at the 1% and 5% levels.
When the correlation coefficient is significantly positive, the indicator value (independent variable) and the loser variable (dependent variable) have a positive correlation. That is, the larger the indicator value (independent variable), the higher the potential to become a loser. Aggregating the results of Table 2, the epidemic prevention industry, high Tobin’s Q (average 1.8 > 1 is due to overinvestment concerns or the company’s future growth prospects are better based on Liu (2021)), high PB (average 2.74 is a growth stock based on Liu (2021)), large market value (M = 1244.801 million NT$), and past crisis (risk variable = 1), high current ratio (M = 461.60%), low debt ratio (M = 35.89%), high ROA (M = 4.42%), high ROE (M = 6.73%), low cash flow adequacy ratio (M = −157.04%), and cash reinvestment rate (M = 0.41%). In such cases, it is easy to incur a loss. Regarding why some financial institutions, such as debt ratio, ROA, and ROE, differ from the expected outcome (e.g., a high debt ratio is positively correlated with the loser variable). This may be because biotechnology industry stocks were used in the study sample. The products of this industry are in the R&D or a small number of trial production stages, and it is also a start-and-keen investment industry in Taiwan’s local markets. Tobin’s Q, PB, and debt ratio are often high and may not yet have a surplus, which may be the result of the characteristics of the financial structure of the industry.
Finally, it cannot be confirmed that the six indicators of corporate governance are related to the dependent variable based on Kendall’s (or Spearman’s) correlation coefficient and cannot be ruled out as equal to zero (p > .05). Therefore, a correlation between the dependent variable and corporate governance cannot be proven. This result differs from those of previous studies (Carvalhal & Nobili, 2011; Clark & Wójcik, 2005; Wang et al., 2021). For example, Carvalhal and Nobili (2011) argue that governance factors explain the average return on stocks more strongly than firm size and financial accounting factors. The difference in results from the literature may be because the literature confirms the contemporaneous relationship between corporate governance (variables) and stock prices or the relationship across one period (lagged time difference does not exceed one quarter). However, this study explored the lagged time difference over three quarters. If information on corporate governance (2021Q4) is fully reflected before the period in which returns are estimated (2022Q1–2022Q3), no significant correlation exists between corporate governance and stock-based returns (the next three quarters).
Tree Structure Model
The tree structure model (N = 193) established in this study is a growing method using CRT, where the dependent variable is the loser variable and the independent variables are epidemic prevention, Tobin’s Q, PB, market value, risk variable, current ratio, debt ratio, ROA, ROE, cash flow adequacy ratio, and cash reinvestment rate. Using cross-validation and setting the maximum tree depth to 5, minimum cases in the parent node to 30, significance level of .05, and minimum cases in the child node to 10, prior probabilities are given as .554 for loser = 1 (priors are obtained from the training sample). The results obtained are as follows. Independent variables in the tree model included ROA, ROE, cash reinvestment rate, market value, PB, Tobin’s Q, cash flow adequacy ratio, current ratio, debt ratio, and risk variable; the number of nodes was 11; the number of terminal nodes was 6; and the depth was 3. The established tree model had a risk (substitution method) of 0.280 and SE 0.032. The accuracy was 72.0%, and the precision was 79.4% for the loser (Table 3).
Results of Classification Using the CRT Method.

Figure 1 illustrates the importance of independent variables in the CRT model, in order: market value (importance = 0.041, normalized importance = 100.0%), cash flow adequacy ratio (importance = 0.039, normalized importance = 94.0%), ROA (importance = 0.034, normalized importance = 82.8%), Tobin’s Q (importance = 0.034, normalized importance = 81.6%), PB (importance = 0.032, normalized importance = 77.7%%), ROE (importance = 0.023, normalized importance = 57.1%), current ratio (importance = 0.022, normalized importance = 53.3%), debt ratio (importance = 0.021, normalized importance = 51.9%), risk variable (importance = 0.015, normalized importance = 36.1%), and cash reinvestment rate (importance = 0.013, normalized importance = 32.3%). Similar to the results of Sun et al.’s (2021) study of Chinese stock markets in the early stages of the pandemic, they confirmed that market value and PB have a significant impact on stock returns in the short term. However, this study confirms that these effects persist in the later stages of the Taiwanese market and can last for at least to 6 to 9 months.

The importance of independent variables in the CRT model.
Figure 2 shows the tree structure model. Four important investment paths (strategies) are identified in the model (Table 4). These strategies or rules can be used as a reference for future losses or profits when investing in industrial stocks in response to the COVID-19 pandemic. These investment guidelines had a correctness rate (72.0%) of more than 70%. In Table 4, three rules of loss of investment return are provided, focusing on what happens to the loser (stock return rate ≤0.0%). This is an investment strategy or risk management countermeasure for the loss of stock prices in the event of the COVID-19 pandemic (infectious disease). Additionally, to provide a rule for investment profits, we focused on the winner (stock return rate>0.0%). These rules were derived from firm characteristics, the basic state of individual stocks, and the status of financial indicators. This confirms that the information formed using past financial indicators and firm characteristics can still explain stock losses and profits. Therefore, it can be inferred that Taiwanese stock market prices will be inefficient in the late COVID-19 period. This result is similar to those of Chakraborty (2023) and Adnan and Johani (2023), confirming the inefficiency of equity markets such as India and Dhaka during the COVID-19 pandemic.
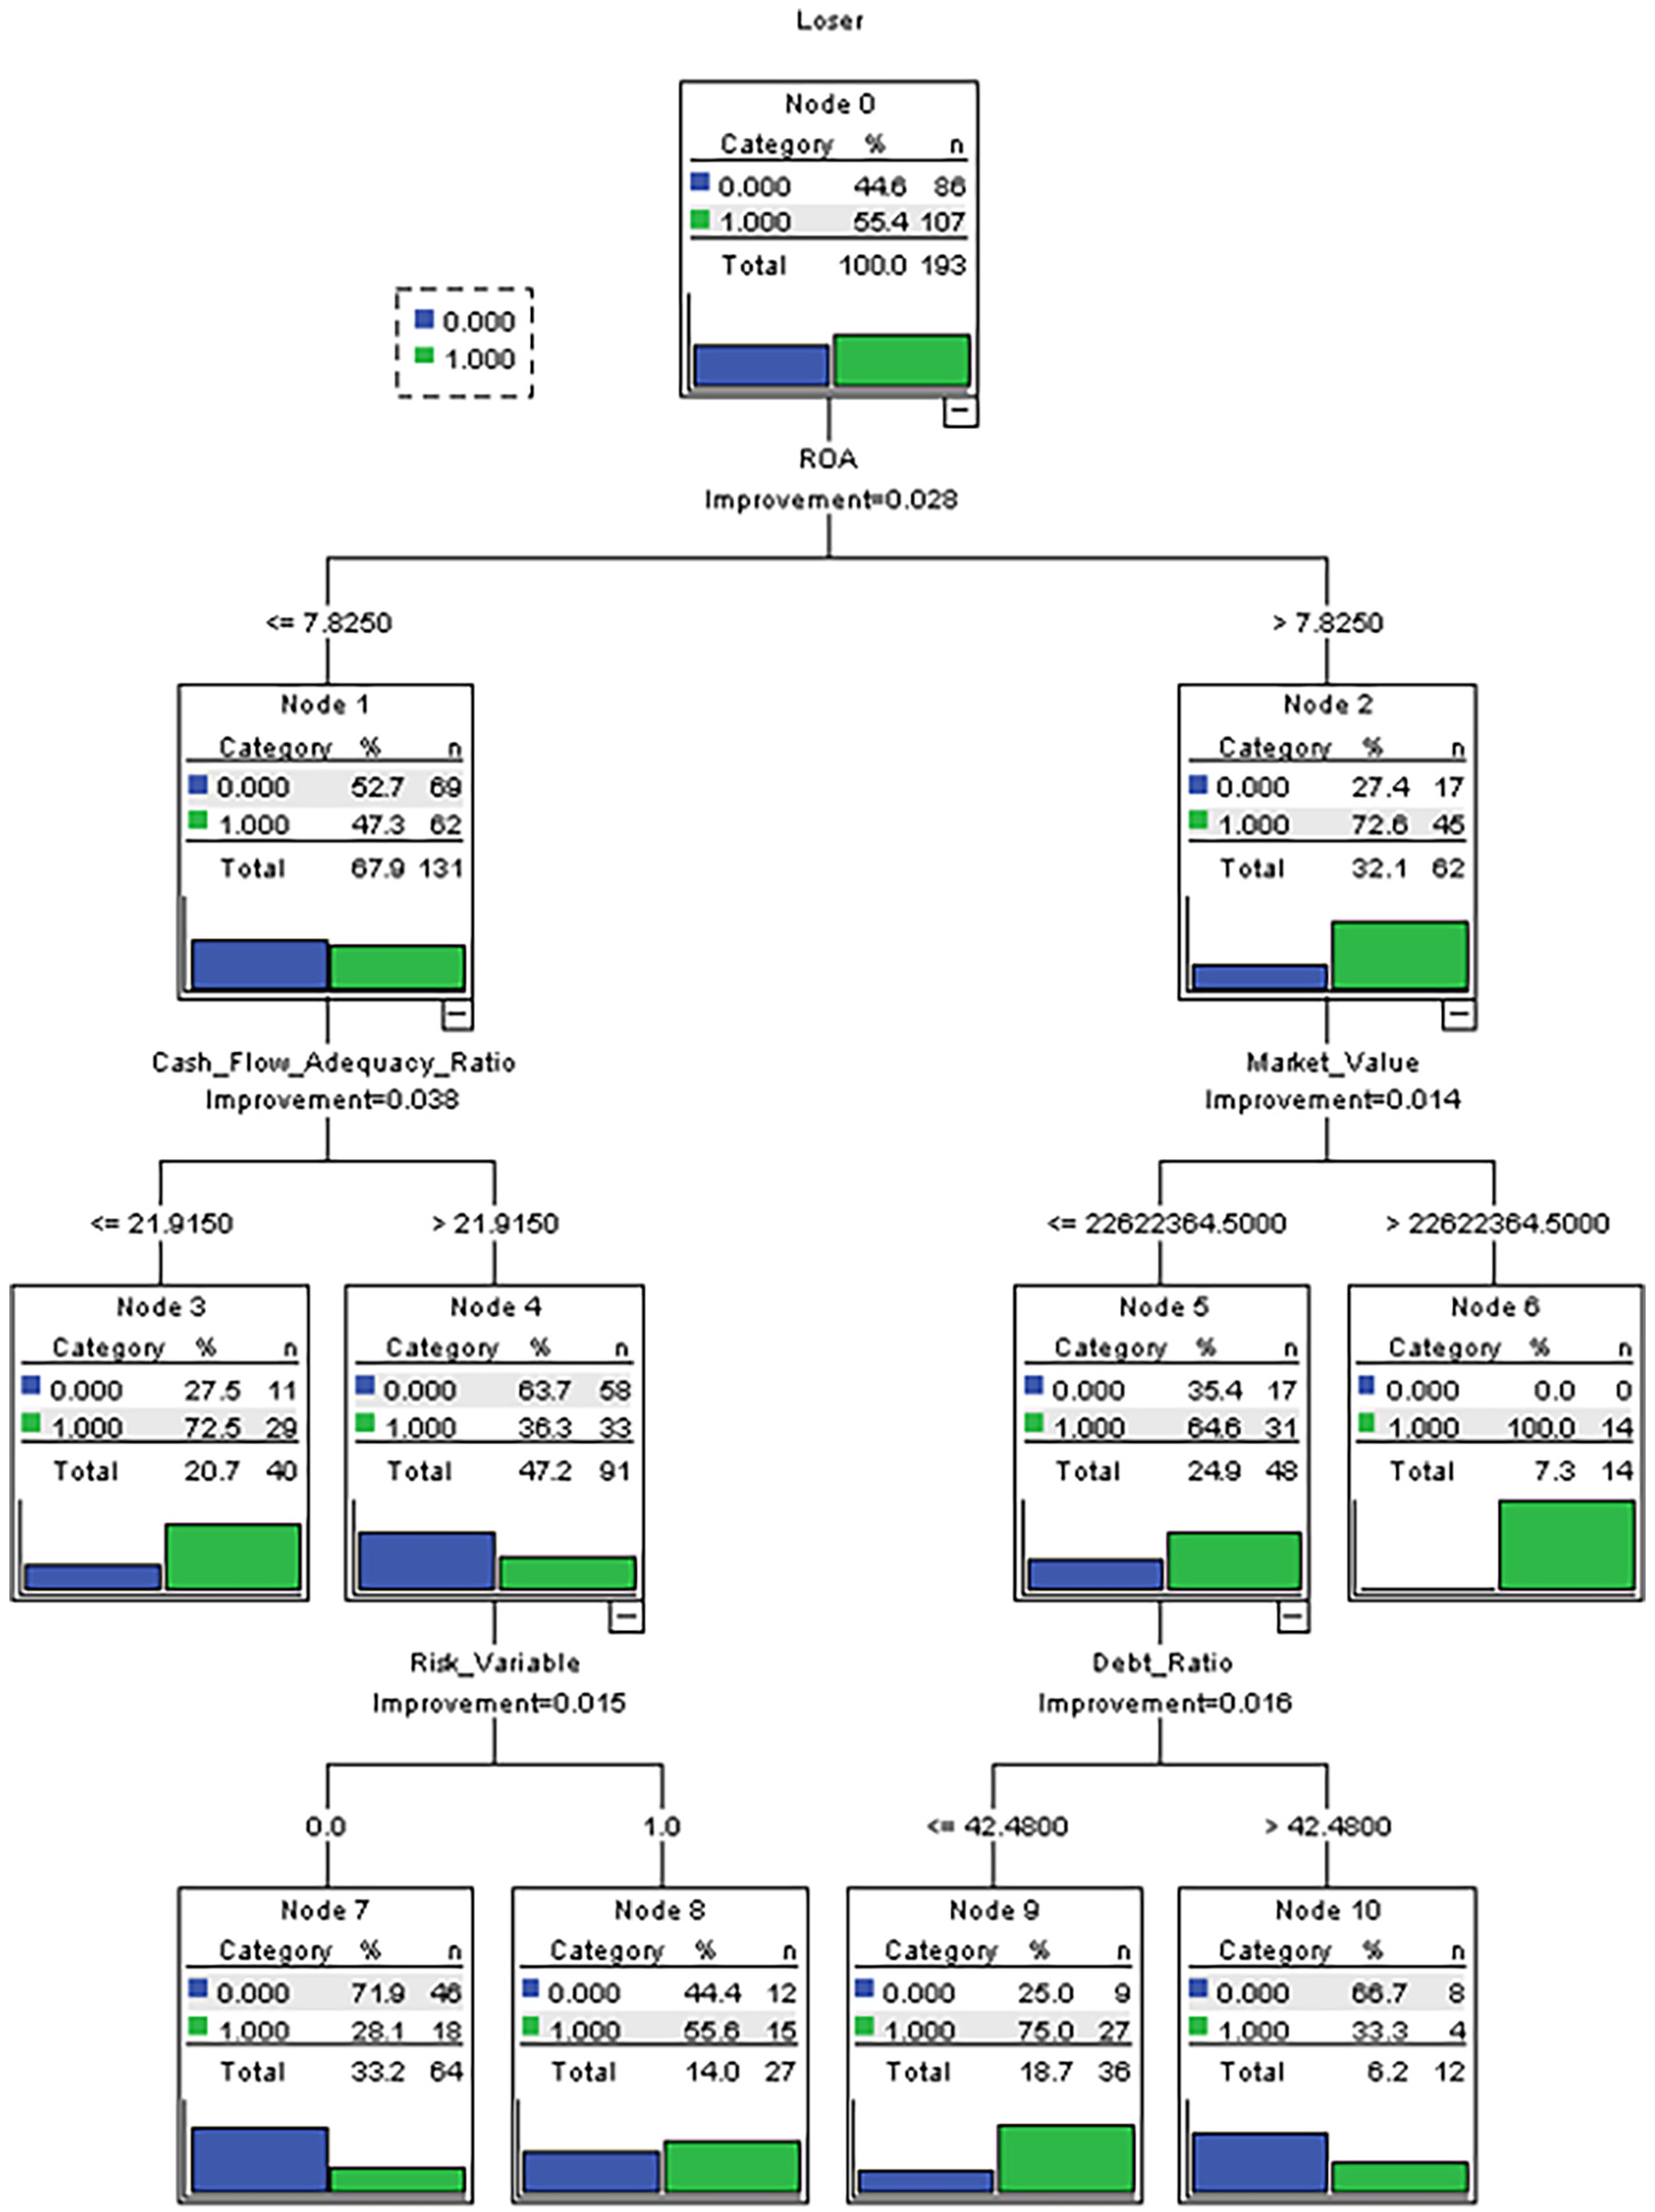
A CRT tree structure model.
Important Rules from the CRT Decision Tree.

Conclusions
This study explored the impact of the COVID-19 pandemic on Taiwan’s industrial stock returns during 2022Q1 to 2022Q3. From the perspective of investors’ loss aversion, past information sets based on three dimensions—firm characteristics, financial indicators, and corporate governance—were used to model and analyze the stock returns of industries expected to have a direct impact through statistical methods and CRT decision trees. To evaluate the stock selection rules, we provided a reference for investment strategies and risk management. According to the results of this study, there were evident investment advantages in OTC and biotechnology stocks during the large-scale pandemic. However, the stock price returns of pandemic prevention stocks during the COVID-19 pandemic in Taiwan were negative, and the investment advantage was not as favorable as expected. It is possible that the prices of these stocks reacted during the early stages of the pandemic (global pandemic). In addition, it cannot be inferred that the sports industry and multinational chain restaurants are affected by the epidemic and have significantly lower stock returns. This indicates that the negative impact of COVID-19 on the stock prices of these industries has been weak after 2 years of vaccine popularization and global epidemic prevention experience. Stocks that experienced financial crises had proven to face a negative impact on the pandemic, with relatively poor investment performance and a high loss of returns. This study did not find evidence supporting a correlation between corporate governance and stock return rates. This confirms that this information may have been reflected in the stock prices earlier.
According to the established tree structure model, the precision for predicting the loss was 79.4%, and the accuracy of the model was 72.0%. In the event of the COVID-19 pandemic, the top five important factors used to explain the loss of stock investments are in the following order: market value, cash flow adequacy ratio, ROA, Tobin’s Q, and PB. From the model, three important rules for avoiding investment losses (losers) and one for investment profits (winners) were summarized for investors. This study is purely an empirical analysis of the binary variable (loser and winner) of stock prices and the independent variables considered during the study period. It did not consider transaction costs and excluded some external interference factors (e.g., the implementation of important policies and new trading measures on stock exchanges), more potential explanatory variables, other empirical methods that may be effective, and even flexible short-term investment operation strategies. Therefore, the results of this study may be limited. Future studies should incorporate indicators of technical analysis, investors’ trading behavior, short-term stock trading operation strategies, general economic factors, international stock market performance, and other effective modeling methods (e.g., artificial neural networks or genetic algorithms) that may improve the accuracy of the model. Second, changing the target variable of the binary variable to classify the magnitude of the stock price’s rise and fall and defining it as an ordered categorical variable can further extend a pure discussion of stock investment loss/gains to the study of important factors affecting the strong and weak groups of stock returns and the problem of providing decision-making rules.
Based on the modeling results, it is confirmed that the rise and fall of stock prices can be estimated using past information sets. Thus, it is found that the stock price adjustment (2020Q1–2022Q3) of these industries was inefficient during the epidemic. The question is whether this is related to investors’ overreactions to stock prices in these industries early in the pandemic (over-anticipated irrational behavior) Alternatively, it may be due to the impact of major policies and other factors (e.g., new measures in stock trading regimes). These factors include policies to expropriate and control epidemic prevention materials (e.g., medical devices, such as masks and respirators), vaccine policies, border controls, travel restrictions or flight controls, personnel controls in high-risk locations, social distancing, home isolation, medical response, and some remedial measures in the economy. Future studies should further clarify these causes.
Footnotes
Declaration of Conflicting Interests
The author(s) declared no potential conflicts of interest with respect to the research, authorship, and/or publication of this article.
Funding
The author(s) received no financial support for the research, authorship, and/or publication of this article.
Ethical Approval
This article does not include any studies involving human participants or animals performed by the authors.
Informed Consent
This article does not contain any studies with human participants performed by any of the authors.
Data Availability
Data sharing does not apply to this study because no data were generated or analyzed.