
Abstract
In the context of the COVID-19, it is very significant to explore the dynamic fluctuation of China’s export growth to the international market and examine the causes of this fluctuation in a multi-dimensional way. The dynamic fluctuation level is measured in the short and medium-long cycle respectively based on monthly data. Factor decomposition of the dynamic fluctuation is made from the growth effect, the structure effect and the competitiveness effect by the improved CMS model, which results show that the growth effect has decreased first and then increased; The structure effects include market structure effects and commodity structure effects, and the former effect basically fluctuates around the X-axis while there is a negative commodity structure effect; There are different specific competitiveness effects on 21 categories of goods. China should rely on the RCEP agreement to strengthen and stabilize trade cooperation other countries, and strengthen its core position in the industry chain and value chain in the Asia Pacific region. The current paper creatively introduce the trade expansion margin including the ternary margin and product structure into the CMS model, explaining the internal relationship between the trade expansion margin analysis at the product- market level and the CMS analysis at the overall level; meanwhile, this paper analyses the dynamic fluctuation structure of China’s export growth to Japan and South Korea through a CMS factor decomposition from the perspective of technological structure and factor ladder, and studies the source and dynamic distribution evolution of this growth pattern.
Keywords
Introduction
As an international public health emergency, the outbreak and spread of the pandemic caused by the Corona Virus Disease in 2019 (hereinafter referred to as the COVID-19 pandemic) has significantly impacted a country’s foreign exports trade, and has also seriously affected the development of international trade in the world. With uncontrollable and unpredictable characteristics, such public health emergencies as the COVID-19 involve public health and safety, which has very different impact mechanism on international trade from general affairs such as trade war, that is, it is no longer just a matter of tax costs. Therefore, it is of great significance to consider the impact of such public health emergencies on trade between major economies, explore the fluctuation of trade growth and decompose its influencing factors from the perspective of market share, and this will help to put forward governmental policies and measures to make the present international market share stable, to give factual evidence for further assessing the governmental policies, and to provide experience for similar international public health emergencies in the future.
As the three important economies in Northeast Asia, the gross domestic product (GDP) and total import and export of goods of China, Japan and South Korea account for around 20% of the global total, showing an important position in the international division of labor system. Meanwhile, in 2020, the total bilateral trade volume between China and Japan and South Korea reached 527.6 billion US dollars (including 279 billion US dollars in import and export trade between China and Japan and 248.5 billion US dollars between China and South Korea). Since 2013, the proportion of China’s total bilateral trade volume with Japan and South Korea in China’s foreign trade has maintained by 13% to 14% (Note: The figure is calculated by the author based on relevant data in the “China Statistical Yearbook” for the past 5 years), which is roughly equivalent to the level of important trade partners such as China-ASEAN, China-EU and China-US, indicating that the change of exports to Japan and South Korea will directly affect the stability of China’s foreign exports. After a decline in GDP of 3.3% in the second quarter, the South Korean economy finished the year only down 1%, the smallest drop of any member of the Organisation for Economic Co-operation and Development(OECD). Weaknesses still remain in the services sector and future mutations of COVID-19 could affect economic growth in 2021, but the strong second half export performance in goods, and the corresponding investment it spurred, helped South Korea avoid a deeper recession in 2020 (Stangarone, 2021). Japan and South Korea, which have maintained long-term and close trade partnerships with China, have also been hit by the pandemic. In such a situation where the prospect of foreign trade is full of uncertainty, “Stabilizing foreign trade and foreign capital market” has become one of the important tasks of “six guarantees and six stability” policy of China’s economic development. In 2021, “promoting and accelerating the negotiation process of the China-Japan-South Korea Free Trade Agreement” has become the key focus of China’s government work report on implementing the “high-level opening up” policy. It is of great significance for China to identify the fluctuations and characteristics of export trade growth in the context of COVID-19 pandemic and eliminate unreasonable factors that affect the smooth development of bilateral trade on the basis of maximizing own trade gains, so as to further improve the quality level of regional trade in East Asia.
The pandemic has significantly impacted global trade and Japan and South Korea has been no exception. Exports began to decline rapidly in the first quarter of 2020 as countries implemented lockdowns to prevent the spread of COVID-19. But as countries adjusted to the pandemic in the second half of the year, trade began to recover and South Korea was well placed to meet some of the global needs for dealing with the pandemic. In addition, South Korean and Japan exports deteriorated quickly as the pandemic spread beyond China. In April 2020, exports fell by 24.3% (Stangarone, 2021), marking the largest single month drop in exports since the Global Financial Crisis 11 years earlier. For the full second quarter, exports of goods would decline 11.5% and services by 22.1% (Stangarone, 2021). In addition, exports of goods began to improve in the second half as key export markets started to recover. In the third quarter exports to the United States rebounded by 10.1%, with similar or stronger growth to Taiwan, Germany, and Canada. In the fourth quarter, exports returned to growth with key partners in South and Southeast Asia such as India, Vietnam, Malaysia, Indonesia, and Thailand. Despite China’s own quick recovery, exports from South Korea and Japan to China were relatively stable for most of the year. In the third quarter they only grew by 2.2% and then declined by 0.5% in the fourth quarter (Stangarone, 2021). China’s enhanced aggregate position in global trade is accredited to the “reform and opening up,” initiated in the earlier 1970s. In 2001, China became a member of WTO, signaling its profound integration into the world economy. Furthermore, WTO accession required alteration in China’s institutional structure framework and a host of new trade-related laws and regulations, consequently in enhanced stability and transparency in its business dealings (Lenka, 2018)
This paper firstly measures the dynamic fluctuation of China’s export growth to Japan and South Korea in the context of the COVID-19 pandemic based on monthly data. Secondly, the classical constant market share model is improved by introducing H-K index and A-F thought respectively from the market product level; Based on the improved CMS model, the dynamic fluctuation of China’s export growth to Japan and South Korea is decomposed into multidimensional factors. Then, the growth effect, structure effect and competition effect are analyzed from the three aspects of total volume, supply and demand respectively; Finally, we draw some research implications on the geographical direction of export trade and the structure of export commodities.
The marginal contributions of the current study are as follows: first, we comprehensively measured the inter-temporal trend of China’s exports to Japan and South Korea under the impact of the COVID-19 using the short and medium cycle trade fluctuation level measurement system. Second, we creatively introduce the trade expansion margin including the ternary margin and product structure into the CMS model, exploring the internal relationship between the trade expansion margin at the product-market level and the CMS model at the overall level. Third, the present study analyses the dynamic fluctuation structure of China’s export growth to Japan and South Korea through a CMS factor decomposition from the perspective of technological structure and factor ladder, and analyses the source and dynamic distribution evolution of this growth pattern.
The rest of the paper is structured as follows: Section 2 is literature review where the authors conclude existing research literatures, especially focus on reviewing that of CMS model. Section 3 is about the overview of dynamic fluctuation of export growth to Japan and South Korea, and the measurement of the short-cycle and long-term dynamic fluctuation respectively. Section 4 illustrates improvement of CMS model by introducing H-K index and A-F thought respectively from the market product level. Section 5 presents the factor decomposition of the dynamic fluctuation with the growth effect, structure effect and competition effect based on improved CMS model. Finally, section 6 puts forward the conclusions and implications.
Literature Review
On the one hand, we summarized the research on export trade growth from the perspective of research content. China’s trade export has expanded due to continuous economic globalization, from seafood to mechanical and electrical products, and from agricultural products to high-tech products attracting extensive interest (Chen et al., 2018; Crona et al., 2015; Geetha et al., 2020; Gephart & Pace, 2015; Sabau & Boksh, 2017; Sun et al., 2016; Yang et al., 2017; Yang & &Chen, 2016; Yang & Li, 2017; Yu & Ma, 2020; J. Zhu et al., 2017). Numerous studies have concentrated primarily on China’s exports as the country has grown to be one of the world’s top exporters of various products. Based on the business cycle theory, Yan and Su (2009) and Yan et al. (2009) analyzed China’s export growth fluctuations from both the overall and structural perspectives using HP filtering method. The first quarter’s economic and trade relations among China, Japan, and South Korea were significantly impacted by the pandemic, but it also highlights the fact that the experience of cooperation against the pandemic, the willingness of China, Japan, and South Korea to recover their economies, and the swift recovery of the Chinese economy will create more new opportunities for the recovery and development of those relationships (Wei et al., 2021). Opportunities for collaboration against the pandemic, the three nations’ readiness to work in trade and economics, the need for development in high-tech industries, and the stability of the situation in northeast Asia are some examples of post-pandemic China, Japan, and South Korea opportunities. Racist rhetoric, anti-globalization ideology, tense bilateral relations, industrial homogenization competition, deteriorating Sino-US relations, and the North/South Korean nuclear issue are listed as the main obstacles to collaboration among the three nations. Leibovici and Santacreu (2020) discovered that trade imbalances in countries’ critical goods have a significant impact on the effects of international trade during the pandemic. For instance, during a pandemic, net importers of these items fare considerably worse than net exporters. In an environment with high trade barriers, net importers experience smaller welfare losses whereas net exporters experience the opposite. However, once a pandemic strike, trade barriers are increased in favor of net exporters of necessities while they are lowered in favor of net importers. McKibbin and Fernando (2020) found that the impact on South Korean exports is anticipated to be minimal given the tiny proportion of Hubei exports in South Korea’s purchases from China (1.0% in 2018). The value chain between South Korea and China has, however, become even more intricate since the outbreak of Severe Acute Respiratory Syndromes (SARS) in 2003, and if China’s exports and consumption continue to be muted for an extended length of time, the impact on South Korea’s economy would worsen.
On the other hand, the research on fixed market share (CMS) model is reviewed from the perspective of research methods. Significant progress has been made in the study of the constant market share (CMS) model and its applications. Exploring the causes of export trade fluctuations is one of the most widely used for CMS models, which is often used to quantitatively analyze the factors affecting export trade and their degree of impact. The model posits that if the export competitiveness of one or more items from a country (area) does not change, the global market share will remain constant. In actuality, product export and market share are shifting, which must be a result of shifting global demand, the organization of the importing nation’s demand, and the competitiveness of the exporter’s goods. The study of Tyszynski (1951) for the first time introduced the constant share market (CSM) model. After that, researchers such as Milana (1988), Jepma (1986) and Ahmadi-Esfahani (2006) have further improved, expanded and revised the CMS model. In addition, constant share model (CMS) is now extensively utilized to analyze industrial competitiveness and international trade fluctuations as well as to provide empirical evidence for designing policy recommendations. For example, Widodo (2010) utilized CMS model to examine the dynamic markets of the North Americans Free Trade agreement (NAFTA), the EU, ASEAN, and Northeast Asian countries between 1980 to 2006. Li (2015) analyzed the influencing factors of the dynamic fluctuation of China’s export trade to the BRICS countries from 2000 to 2013 using CMS model. L. P. Zhu et al. (2018) used CMS model to study the growth effect of agricultural product export trade in the five Central Asian countries. Tong (2017) used the revised one country-multiproduct CMS model to decompose the growth factors of China’s aquatic product export trade from 2001 to 2014. Khan et al. (2019) analyze the fluctuation of Pakistan’s agriculture export trade from 1985 to 2018.Meanwhile, Wang et al. (2017) employed a CMS model to decompose the various factors that affects export fluctuations in the case of China’s new energy industries; they found that import demand of the foreign market for China’s new energy industry dominated fluctuations in exports. Moreover, Capobianco-Uriarte et al. (2017) utilized CMS model in the case of Spain’s competitiveness in the European tomato market. In addition to this, the study proposed by Cao et al. (2018) explored the different factors influencing China’s forest product exports; their study found that the competitive effect had the substantial impact on export growth, in terms of the market-size effects, with the effects of product structure and market distribution both considering small in size. Liu et al. (2020) investigated the dynamic export performance of Australia’s liquefied natural gas (LNG) for four sub-periods between 1989 and 2017 employing constant market share (CMS) model and United Nation(UN) Comtrade data.
Furthermore, the gravity models widely used by Lin et al. (2020); Nasrullah et al. (2020), Natale et al. (2015). In contrast, the constant market share (CMS) models are generally utilized to analyze the factors of export performance. Additionally, numerous variables can influence export volatility, including distance between countries/regions, trading partner’s economic growth, financial market development, the macroeconomic indicators, and infrastructure. It is important to understand that it is difficult to make a comprehensive and accurate assessment for all these variables. Moreover, constant market share (CMS) model is able to evaluate precise hypotheses and, therefore, indicates the clear direction for further studies (Ahmadi-Esfahani, 2006). A macroscopic framework makes up a significant supplement to the other empirical models, and a viable method of analyzing as well as examining the variables involved (Wang et al., 2017).
In summary, although there are a large number of literatures on export trade growth and its factor decomposition, the current study is significantly different from the above-mentioned literatures. First, from the perspective of measurement methods, the short-term and medium-term trade fluctuation level measurement system is used to comprehensively measure the inter-temporal trend of China’s export fluctuations to Japan and South Korea under the impact of the pandemic; Secondly, from a theoretical perspective, the trade expansion margin method, which includes a ternary margin and product structure, is innovatively introduced into the CMS model, and the present study interprets the inherent relationship between the trade expansion margin analysis at the product-market level and the CMS analysis at the overall level, which can be seen as an extension and synthesis of the traditional trade growth quantitative measurement and effect analysis methods in terms of perspectives and dimensions; Thirdly, from the perspective of factor decomposition, CMS method is conducted on the structure of China’s export trade growth to Japan and South Korea in the context of pandemic based on technological structure and factor ladder, and then analyze the origin and dynamic distribution evolution of this growth pattern.
Overview
Dynamic Fluctuation of Export Growth
China has experienced the rapid development of export trade in recent years. However, it faces many immense challenges and has seen unstable growth, which have affected its foreign market share and sustainable development. Mankiw (2016) defined dynamics as being related to vitality or moving objects and characterized by continuous changes. As an important part of the macro-economy, export trade implied the hypothesis that “export fluctuation is the deviation of export revenue from its own cyclical trend” in the relevant time series analysis based on the business cycle theory. Although this contributes to understand the evolution of export trade from a long-term perspective, the non-stationary nature of major public emergencies such as the COVID-19 pandemic may come from the endogenous cyclical and trend components in the growth process or may be caused by the exogenous random shocks of the economic system, resulting in permanent or temporary impacts. The current study points out that the dynamic fluctuation of trade growth is the changing state of trade movement formed by a point-by-point spatiotemporal transfer for the action of internal and external non-stationary factors in the economic system, which emphasizes the disturbance of the export caused by the economic actors with different characteristics.
A Measure of the Short-Cycle Dynamic Fluctuation
In order to eliminate seasonal change factors before measuring the fluctuation level of export trade for the use of monthly time series, a series of seasonal adjustment methods developed jointly by the National Situation Survey Bureau of the U.S. Department of Commerce and the Bank of Spain are used, that is, pre and post prediction is conducted through the Regression and Autoregressive Integrated Moving Average Model (RegARIMA) to supplement data, and seats program is called to adjust the export data seasonally; Second, China’s exports to Japan and South Korea in 2016-2020 are selected as the benchmark series, with a total of 5 years and 60 months (Note: The data is sourced from the UN Comtrade International Trade Statistics Database, UNCTAD); Then, based on the principle of multiplication model, the time series is decomposed into the product of trend cycle elements, seasonal elements, and irregular elements. The adjusted growth rate of China’s exports to Japan and South Korea is shown in Figure 1.

Growth rate of China’s export to Japan and South Korea after seasonally adjusted.
Figure 1 shows that before the outbreak of the domestic pandemic in January 2020, China’s export growth rate to Japan and South Korea fluctuates slightly, but from the outbreak of the pandemic to the effective control of the pandemic in February to May 2020, the growth rates fluctuated significantly. Due to the outbreak of the domestic pandemic at the end of January, China began to adopt seven regulatory policies, namely, city closure, household by household inspection, centralized isolation of close contacts, initiation of a national emergency response state, prohibition of clustering, closure of schools, and border restrictions, resulting in supply side downtime and production stoppage. Meanwhile, Japan adopted four regulatory policies including city closure, initiation of a national emergency response state, closure of schools, and border restrictions, while South Korea adopted five regulatory policies including centralized isolation of close contacts, initiation of a national emergency response, prohibition of concentration, closure of schools, and border restrictions, has led to a sharp decrease in demand, which led to the bottom of exports in February. The outbreak of the international pandemic in March led to a large number of exports of medical products such as masks and protective clothing, and the growth rate of exports to Japan and South Korea rose to 80.5% and 43.8% respectively. The short-term fluctuations of China’s export growth to Japan and South Korea are measured by the real growth rate for comparison, as shown in Tables 1 and 2 respectively.
Short Cycle Characteristics of Dynamic Fluctuation of China’s Export to Japan.

Short Cycle Characteristics of Dynamic Fluctuation of China’s Export to South Korea.

As shown in Table 1, there were seven fluctuations in the growth of China’s exports to Japan from 2019 to 2020, with each wavelength lasting about 3 months on average. The waveform was mainly classical, and the only growth type fluctuation occurred from September to November 2020. The highest average potential of China’s exports to Japan occurred from February to June 2020, with an average growth rate of 16.44%. In the same period, the growth of China’s exports to South Korea fluctuated nine times, with each wavelength lasting for nearly 3 months on average, and there were two growth waveforms at the beginning of summer in each year. The highest peak occurred in February May 2020, with an average growth rate of 35.72%, as shown in Table 2.
In general, except for the months when the epidemic started to break out in China, the growth rate of China’s export trade to Japan and South Korea is similar, and the growth rate fluctuates around the mean range of the same stable level. The difference is that the fluctuation of export volatility in both countries occurred in the early stage of the spread of COVID-19, but the valley value of the fluctuation depth of Japanese exports was significantly higher than that of the exports to Korea. This may be due to the fact that compared to Japan, South Korea has adopted two stricter regulatory policies, namely, centralized isolation and prohibition of gathering of close contacts, which directly reduces the import of many commodities. From the dispersion of the fluctuation of the growth rate of trade volume in the cycle, the instability of China’s exports to Japan during the epidemic period is mainly concentrated from February to April 2020, while the exports to South Korea are concentrated in the early stage of the spread of the epidemic that is from November 2019 to February 2020. In the rest of the period, China’s exports to the markets of the two countries are relatively stable. This is because although the first case of the COVID-19 in South Korea (January 20, 2020) was confirmed later than that in Japan (January 17, 2020), by the end of February 2020, the number of confirmed cases in Japan was 178 (Note: The data is sourced from the COVID-19 data repository of the Center for System Science and Engineering of Johns Hopkins University), and the number in South Korea was 763 (Note: The data is sourced from the COVID-19 data repository of the Center for System Science and Engineering of Johns Hopkins University). At this time, the Korean government raised the alert level of the Korean pandemic from the third level of “orange” to the fourth level of “red,” which is the highest level of “serious” early warning of the pandemic, and set up the Central Disaster Security Countermeasures Headquarters, Intensify pandemic prevention and control efforts. At the same time, due to the small number of confirmed cases in Japan, the pandemic prevention and control efforts are weak, which led to the occurrence of the above different situation in two countries.
A Measure of the Medium-Long Period Dynamic Fluctuation
The power spectrum analysis method is used to observe the long-period characteristics. Based on the principle of Christiano and Fitzgerald (2003) filter, asymmetric filtering with full sample length is selected to decompose the export into trends and cycles. In order to meet the requirements of the stationarity assumption, based on seasonal adjustment, the Augmented Dickey-Fuller (ADF) unit root test was conducted on the trend cycle series of China’s exports to Japan and South Korea from 2019 to 2020. The results are shown in Table 3. The t-statistic of the Japan_ TC sequence rejects the original hypothesis at the 1% significance level and considers that the sequence is stable, while the Korean sequence passed the test at the 5% significance level. Meanwhile, according to the duration of the average wavelength divided in the above growth rate periodic fluctuation analysis, it is shown as the Kitchin short cycle of the monthly time series, so the cycle interval is set as (3, 5), and the weight series of the filtered frequency response function are 0.33 and 0.2.
Stability Test Results of Trend-Cyclic Series.

Note. c represents the constant term, t represents the trend term, and k represents lag order (determined by SIC criterion).
The results of export growth after trend-cycle decomposition are shown in Figure 2. The two groups of serial data have been trend eliminated. Because asymmetric filtering is time-varying, the weight sequence matrix of the filtering frequency response function is not shown.

Filter of China’s export growth to Japan and South Korea.
It can be seen from Figure 2 that the growth trend of China’s exports to Japan and South Korea from 2019 to 2020 is highly similar, and the growth performance of trade volume continues to be low. The long-term process includes at least three short cycles, belonging to the Juglar medium cycle; During the period, there were many periodic filtering fluctuations, however, the fluctuation amplitude was small and kept the bottoming stable.
Improvement of Constant Market Share Model
The classic Constant Market Share (CMS) method is often used to examine changes in trade flows. At present, scholars have made three important decompositions of the CMS model, namely, the single-level decomposition that assumes the export commodities have no difference in destination (Tyszynski, 1951), the two-level decomposition that regards exports as a large heterogeneous product set (Baldwin, 1958; Leamer, 1974; Richardson, 1976), and the three-level decomposition that introduces the geographical direction of foreign trade (Jepma, 1986 ), and finally establish the identity of “ Changes in export growth = growth effect from world trade impact + commodity effect from commodity composition impact + market effect from market distribution impact + second-order effect from competitiveness residual.” The basic meaning of the dualistic division of export margin is the distinction between diversity and unity of trade; Its general dimensions mainly include product level, enterprise level, national level, market level, and various new combinations and definitions derived from the above levels. This paper selects to improve the classical CMS model by introducing the H-K index and A-F thought respectively from the market product level under the framework of export margin analysis, and further decomposes the dynamic fluctuation of China’s export growth to Japan and South Korea by building an improved CMS model.
The first step is to introduce the constant market share (CMS) model with the H-K exponential decomposition method from the perspective of export mode. Based on the H-K index method and referring to the ternary decomposition framework of Shi (2011) trade growth, the traditional CMS model is decomposed at the market level in three levels:

Structure Effect Competitiveness Effect Second-Order Effect
In Equation 1, Δq represents the change of China’s export volume in the two periods, which has been measured above and treated for seasonal stability; 0 and t are the base period and the reporting period respectively; i represents the commodity category, j signifies the export target country, IMij, EMij, PMij, and XMij denote respectively the intensive margin, extensive margin, price margin and quantity margin of China’s exports of commodities i to country j, sij indicates the share of China’s commodity i exports in the total commodity i imports of country j from the international market, and Qij is the total commodity i imports of country j from the international market.


In Equations 2–5, r signifies the reference country (Note: To observe the export competitiveness of Chinese products to Japan and South Korea to a greater extent, it is assumed that China, Japan and South Korea form a relatively closed market, i.e., the model does not consider the trade outside China, Japan and South Korea, so the reference country refers to China and Japan or China and South Korea), pij denotes the price of goods i exported from China to country j, and pir refers to the price of goods i imported from country r by country j; xij represents the quantity of goods i exported by China to country j, and xir presents the quantity of goods i imported from country r by country j; Ij refers to the set of goods exported from China to country j, and I is the set of goods exported from country r to country j, that is, the complete set. Ij is a subset of I.
Equation 2 shows that China’s exports to Japan and South Korea account for the proportion of Japan’s imports from the reference country in the trade of similar goods. If a country exports a large number of similar goods, the value will be higher. Equation 3 shows that the trade volume of goods in the overlapping categories of China’s exports to Japan and South Korea and their imports from the reference countries accounts for the proportion of two countries’ imports from the reference countries. If a country exports more diversified goods, the value will be higher, that is, it measures the diversification of China’s exports to Japan and South Korea.
The formula for calculating the index weight is as follows:
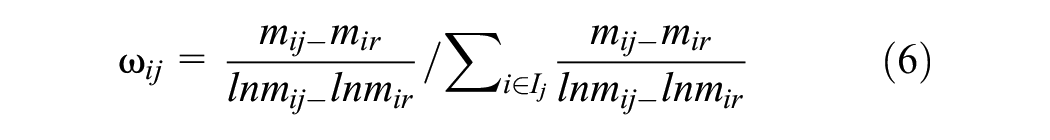
Where mij and mir respectively indicate the share of products i exported by China and country r to country j in their total exports under the set of products exported by China to country j.
The results of multiple marginal decompositions show that there are intensive marginal effects (including quantity effects and price effects) and extensive marginal effects originating from different periods in the structure effects, competitiveness effects, and second-order effects of export trade growth.
The second step is to introduce the CMS model with the A-F quantity decomposition method from the perspective of the product. Further on the thought of Amiti and Freund (2007) and the introduction of the dynamic concept, a country’s trade growth is divided into continuous products derived from intensive margin (products exported in T and T-1 periods), perishing products (products no longer exported in T period), and new products derived from extension margin (products newly exported in T period relative to T-1 period) according to the product structure margin. The economic significance of this method is to clarify that the changes in a country’s exports can be decomposed into: intensive marginal effect (connotation marginal growth effect), the negative effect of vanishing products, and the extensive marginal effect (extension marginal growth effect). Therefore, the right side of Equation 1 is added with positive and negative terms in line with the research reality, that is, the export growth is decomposed into four levels.Due to space limitations, some items only show the decomposition results after the introduction of binary margin, and actually still include quantity margin effect and price margin effect. The detailed process can be obtained from the authors.

In Equation 7, S represents the market share of the dying product, and the other symbols have the same meanings as above. In the above identities, in addition to dividing the proportion of China’s exports to country j in part of the items in the country j’s imports from the international market into multiple margins, the extinction effect is introduced after each decomposition item, that is, it corresponds to the negative effect of vanishing products in the A-F quantitative decomposition method, which means that the disappearance of products between the two periods in the effect has caused a certain negative effect, and the corresponding effect item can be called the “extinction effect item.” Explicitly, in constant market share (CMS) analysis, each effect may have a negative effect on product demise, which can be mainly divided into growth, market, commodity, competitiveness, and other demise effects. Similarly, in other items, there are still intensive marginal effects and extensive marginal effects originating from different periods.
It can be seen that at least four types of combinations can be drawn out by taking into account the dualistic distinction between market and product in the export margin analysis: firstly, whether the increase in exports of new products to the original market or the further export of original products to the new market are both caused by the increase in demand in the new and old markets, that is, the change in the export trade volume of the exporting country caused by the change in the import volume of the importing country’s market, which is the factor explanation of structure effect in CMS analysis. Secondly, whether new products expand exports to new markets or additional exports of original products to original markets indicate changes in export volume caused by changes in the export competition, which is the factor explanation of competition effect in CMS analysis.
By comparing the specific difference items in Equations 1 and 7, it can be seen that the export share of the exporting country in the world market is assumed unchanged in the factor explanations of growth effect and structure effect, that is, export competition remains unchanged, while the import volume of each importing country is assumed unchanged in the factor explanations of the competition effect, that is, the import structure in the world market remains unchanged. Thus we can derive the economic meaning of some decomposition items in the CMS Model with A-F Quantity Decomposition at the product-market level, which can be seen from Table 4 for details.
Main Decomposition Items in the Improved CMS Model.

Factor Decomposition
Based on the above identity, the dynamic fluctuation decomposition of China’s export growth to Japan and South Korea is calculated after the seasonal treatment with the data in the prior context.
Sample Selection and Data Sources
Fan (2020) showed that the COVID-19 actually spread in Wuhan and other regions on a small scale in early December 2019. By the end of January 2020, the epidemic spread has been expanding and began to be known to the public. From March to April 2020, the epidemic situation in the mainland has been significantly curbed. After May 2020, the international epidemic situation began to deteriorate unevenly in time and space. Local sporadic confirmed cases in China entered a period of normalization of epidemic prevention and control. Considering the time characteristics of the COVID-19 pandemic spreading in China, this paper will decompose the dynamic fluctuations of China’s export growth to Japan and South Korea month by month during the study period. When exploring the effects of commodity structure and specific competitiveness, we select to divide the year of 2020 into four periods: January to March, April to June, July to September, and October to December based on the results of the export fluctuation wavelength calculated above.
The data about China’s imports and export are from the foreign trade database of the development research centre of the State Council (2020), the data about Japan’s imports and export are from the Trade Statistics MoFJ (2019), and the data about Korea’s import and export are from the Korea International Trade Association (KITA, 2020). The data of confirmed cases of COVID-19 comes from the COVID-19 data repository of the Center for System Science and Engineering of Johns Hopkins University. Meanwhile, the current study uses the four-digit code data of Harmonized System (HS) code to further examine the impact of perishable goods and new goods under different economic nature categories on the export fluctuation.
Growth Effect at the Aggregate Level
The growth effect indicates that China’s exports change with the expansion of the import scale of Japan and South Korea’s trading partners, as shown in Figure 3, since the outbreak of COVID-19 in early 2020, China’s contribution to export growth has been reduced first and then increased. Specifically, the contribution rate of the growth effect lowered to the bottom in April 2020, then recovered in May 2000, and then lowered to the bottom in June, and its peak appeared in October 2020.
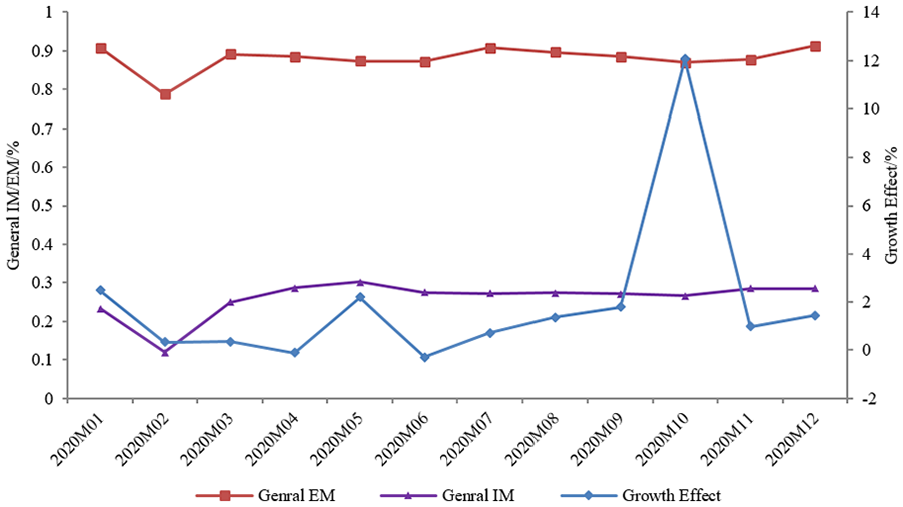
Growth effects.
The reason why the export growth effect has begun to decrease is due to the decrease in export supply caused by the adoption of seven regulatory policies from Chinese government since late January, as well as the decrease in import demand caused by the adoption of four regulatory policies from Japanese government and five policies from Korean government; However, as the number of people diagnosed with the COVID-19 in Japan and South Korea continues to surge, the demand for protective clothing, masks and other medical and health supplies has increased, making China’s exports to Japan and South Korea grow to a higher point in May; After this wave of medical stockpiling by Japan and South Korea, the export growth in June to September returned to normal levels. However, with the significant increase in confirmed cases in both countries, the demand for medical protective goods led to the highest export growth in October.
In addition, the value of expansion margin has been at a high level while that of the intensive margin has been very low, and both effects have not fluctuated significantly indicating that the increase of China’s export share to Japan and South Korea during the period is mainly due to the change of the types of export commodities.
Structure Effect on the Demand Side
The fluctuation of trade growth may be caused by the demand side, that is, the role of weak market consumption in Japan and South Korea is embodied in the market structure effect and the commodity structure effect.
Market Structure Effect
This effect reflects whether China’s export growth is more concentrated in the market with rapid growth in demand or the market with relatively slow growth in demand. In this section, the number of confirmed cases of COVID-19 is taken as an indicator to reflect the change in the regional pandemic situation, and the comparison of China’s exports to Japan and Korea’s market under the background of the pandemic is carried out in the same framework.
It can be seen from Figure 4 that the market structure effect of China’s exports to Japan and South Korea is highly similar on the whole, indicating that China has been focusing on exporting to the two markets with slow growth in demand in 2020. Specifically, in the early days of the COVID-19 outbreak in Japan and South Korea, the contribution rate of market structure effect changed steadily, indicating that its role in export growth was stable; However, during the period of pandemic spreading, with the increase of the number of people infected in Japan and South Korea, the governments of the two countries have adopted various regulatory policies to start influencing their market demand, so the market structure effect for the corresponding month or the month that lags behind has become negative. At the same time, due to the surge in the number from1,209 confirmed cases at the end of February to 15968 cases at the beginning of May in Japan (Note: The data is sourced from the COVID-19 data repository of the Center for System Science and Engineering of Johns Hopkins University), the Japanese government has upgraded the pandemic level from the cluster stage to the community stage, and the regulatory policy has also been upgraded from preventing crowd aggregation to more stringent measures with combining prevention into control, which caused the market structure effect of China’s exports to Japan to fall to the lowest point in May 2020. However, as the number of confirmed cases in Japan continues to rise steadily, the increase in demand for medical supplies has led to a rapid rebound in the contribution rate of its export market structure effect, while the market structure effect of China’s exports to South Korea fluctuated around the X-axis throughout the year.

Changes in the market structure effects.
Commodity Structure Effect
This effect reflects whether China’s export growth is more concentrated in the types of commodities with rapid growth in demand or those with slow growth in demand during the reporting period. In other words, this section of the paper will further study the correlation between China’s exports and the specific industry demand structure of Japan and South Korea. The decomposition results of the commodity structure effect of China’s export growth to Japan and South Korea during the reporting period are shown in Table 5.
Decomposition Results of the Commodity Structure Effects.

It can be seen from Table 5 that after the outbreak of the pandemic in China from January to February 2020 and its widespread, due to the adoption of seven strict regulatory policies by the Chinese government, such as centralized isolation of close contacts, initiation of a national emergency response, prohibition of agglomeration, and border restrictions, the contribution rate of the commodity structure effect of China’s export growth to Japan and South Korea almost all turned into negative values, indicating that China’s commodity exports to Japan and South Korea can no longer form a positive complementary relationship with the markets of two countries at this time. However, after COVID-19 was significantly controlled from March to April 2020 in China, the contribution rate of the commodity structure effect to China’s export growth was still mostly negative. From July to September 2020, with the deterioration of the pandemic in Japan and South Korea, the contribution rate of some commodities continued to turn from positive to negative.
Furthermore, analysis by commodity categories shows that except for weapons, ammunition, and their parts and accessories (T19) which are greatly influenced by geopolitics, the contribution rates of commodity structure effect of the rest commodities are all negative in the four phases, including animal products (T01), raw hides, leather, fur, and their products (T08), ceramic products, glass and its products (T13), precious metal and its products (T14), base metal and its products (T15), machinery, mechanical appliances, electrical equipment, and its parts (T16), miscellaneous products (T20). The average contribution rate of commodity structure effect of plant products (T02) to export growth in 2020 is the highest at 3.73%. In addition, the average contribution rate of commodity structure effect of food, beverages, wine, vinegar, tobacco, and tobacco substitute products (T04) accounted for –5.73%, while that of plastics and their products, rubber and its products (T07) and that of textile raw materials and textile products (T11) are –6.99% and –0.57% respectively, indicating that the target market demand for such goods is relatively strong, with insignificant effect from the COVID-19 pandemic.
The decomposition results of the extinction effect of the commodity structure effect of China’s export growth to Japan and South Korea are shown in Table 6. From the perspective of the overall development trend, during the period of January to March 2020 as well as July to September 2020, the perishing effect of the commodity structure effect of China’s export growth to Japan and South Korea is the most comprehendible, which corresponds to the two peaks of the pandemic spreading in Japan and South Korea respectively, indicating that the outbreak of the pandemic has impacted the product structure of bilateral trade.
Decomposition Results of the Disappearing Effect of the Commodity Structure Effects.

In terms of the categories of perishable products, the average extinction rates of mineral products (T05) and vehicles, aircraft, ships, related transport equipment (T17) exported to Japan were reported at 8.51‰ and 8.17‰ respectively, while the extinction rate of mineral products (T05) exported to South Korea was reported at 37.75‰. In addition, the extinction effect of plant products (T02) exported to South Korea is also significant by 71.29‰, indicating that Japan and South Korea’s demand for such goods imported from China are easily affected by emergencies. On the whole, the bilateral trade links of the above goods are not stable. The export of plastics and its products, rubber and its products (T07), shoes, hats, umbrellas, sticks, whips and their parts (T12), ceramic products, glass, and its products (T13) to Japan did not die out in the fourth phase, while the export of ceramic products, glass and its products (T13), machinery, mechanical appliances, electrical equipment and its parts (T16) to South Korea seldom disappeared in the same period. Additionally, most of the other commodities have a slight effect of the extinction, and even nearly half of the export commodities have no phenomenon of annihilation, which indicates that the probability of the extinction of international trade between China, Japan, and South Korea is relatively small, and the overall performance of trade ties is moderately close.
The decomposition results of the new effects of the commodity structure on China’s export growth to Japan and South Korea during the reporting period are shown in Table 7. The new progressive effects of the commodity structure effect of China’s export growth to Japan and South Korea are also accompanied by the fluctuation of the domestic pandemic situation in the target market. Specifically, the new progressive effect of animal and vegetable oils, fats and their decomposition products, refined edible oil, animal and plant wax (T03) exported to Japan is 7.04‰, and the new progressive effects of plant products (T02) and mineral products” (T05) exported to South Korea are 18.84‰ and 7.04‰ and 39.93‰,respectively. Combined with the above analysis on the extinction effect, we can see that the product structure of China’s export of mineral products (T05) to South Korea has a largest fluctuation amplitude during the reporting period.
Decomposition Results of the New Progressive Effects (‰).

Competitiveness Effect on the Supply Side
The fluctuation of China’s export growth to Japan and South Korea is also affected by the change of China’s domestic supply capacity, which is called the competitiveness effect on the supply side. The competitiveness effect includes the general competitiveness effect and the specific competitiveness effect.
The general competitiveness effect of China’s export to Japan and South Korea is shown in Figure 5. In the early stage of the outbreak from January to February 2020, the seriousness of the pandemic situation did have a certain impact on the general competitiveness effect of China’s export to the two countries, but the contribution rate of the general competitiveness effect in the later period did not fluctuate with the change of the pandemic situation. By May 2020, the contribution rate of the general competitiveness effect was found negative again. In October 2020, its contribution rate of the general competitiveness effect declined sharply. It is further found that the evolution trend of the general competitiveness effect is basically opposite to that of the growth effect in Figure 3, that is, the factors that promote the growth effect are instead factors that hinder the general competitiveness effect, and vice versa. For example, China, Japan, and South Korea all adopted stricter regulatory policies during the outbreak and spread of the pandemic, which directly reduced the growth effect of China’s exports to Japan and South Korea. However, in the context of substantial reduction in import demand caused by the COVID-19 pandemic, export enterprises would strictly comply with the regulations of the importing country and strive to improve the quality of export products while reducing production costs, so as to enhance export competitiveness as much as possible. The above findings show that the existing problems of China’s domestic supply side plays a very important role on the general competitiveness of China’s export growth to Japan and South Korea.

General competitiveness effects.
The specific competitiveness effect of China’s export growth to Japan and South Korea is shown in Table 8. China’s export of animal and vegetable oils and their decomposition products, refined edible oils, animal and vegetable waxes (T03) to Japan and precious metals and their products (T14) to South Korea have the strongest competitiveness enhancement effect in the fourth phase, and with specific competitiveness effects of1,649.83% and 927.55% respectively. China’s specific competitiveness of artworks, collectibles and antiques (T21) to Japan and South Korea substantially decreased with the contribution rates of –1233.80% and –111.42% respectively.
Decomposition Results of Specific Competitiveness Effects (%).
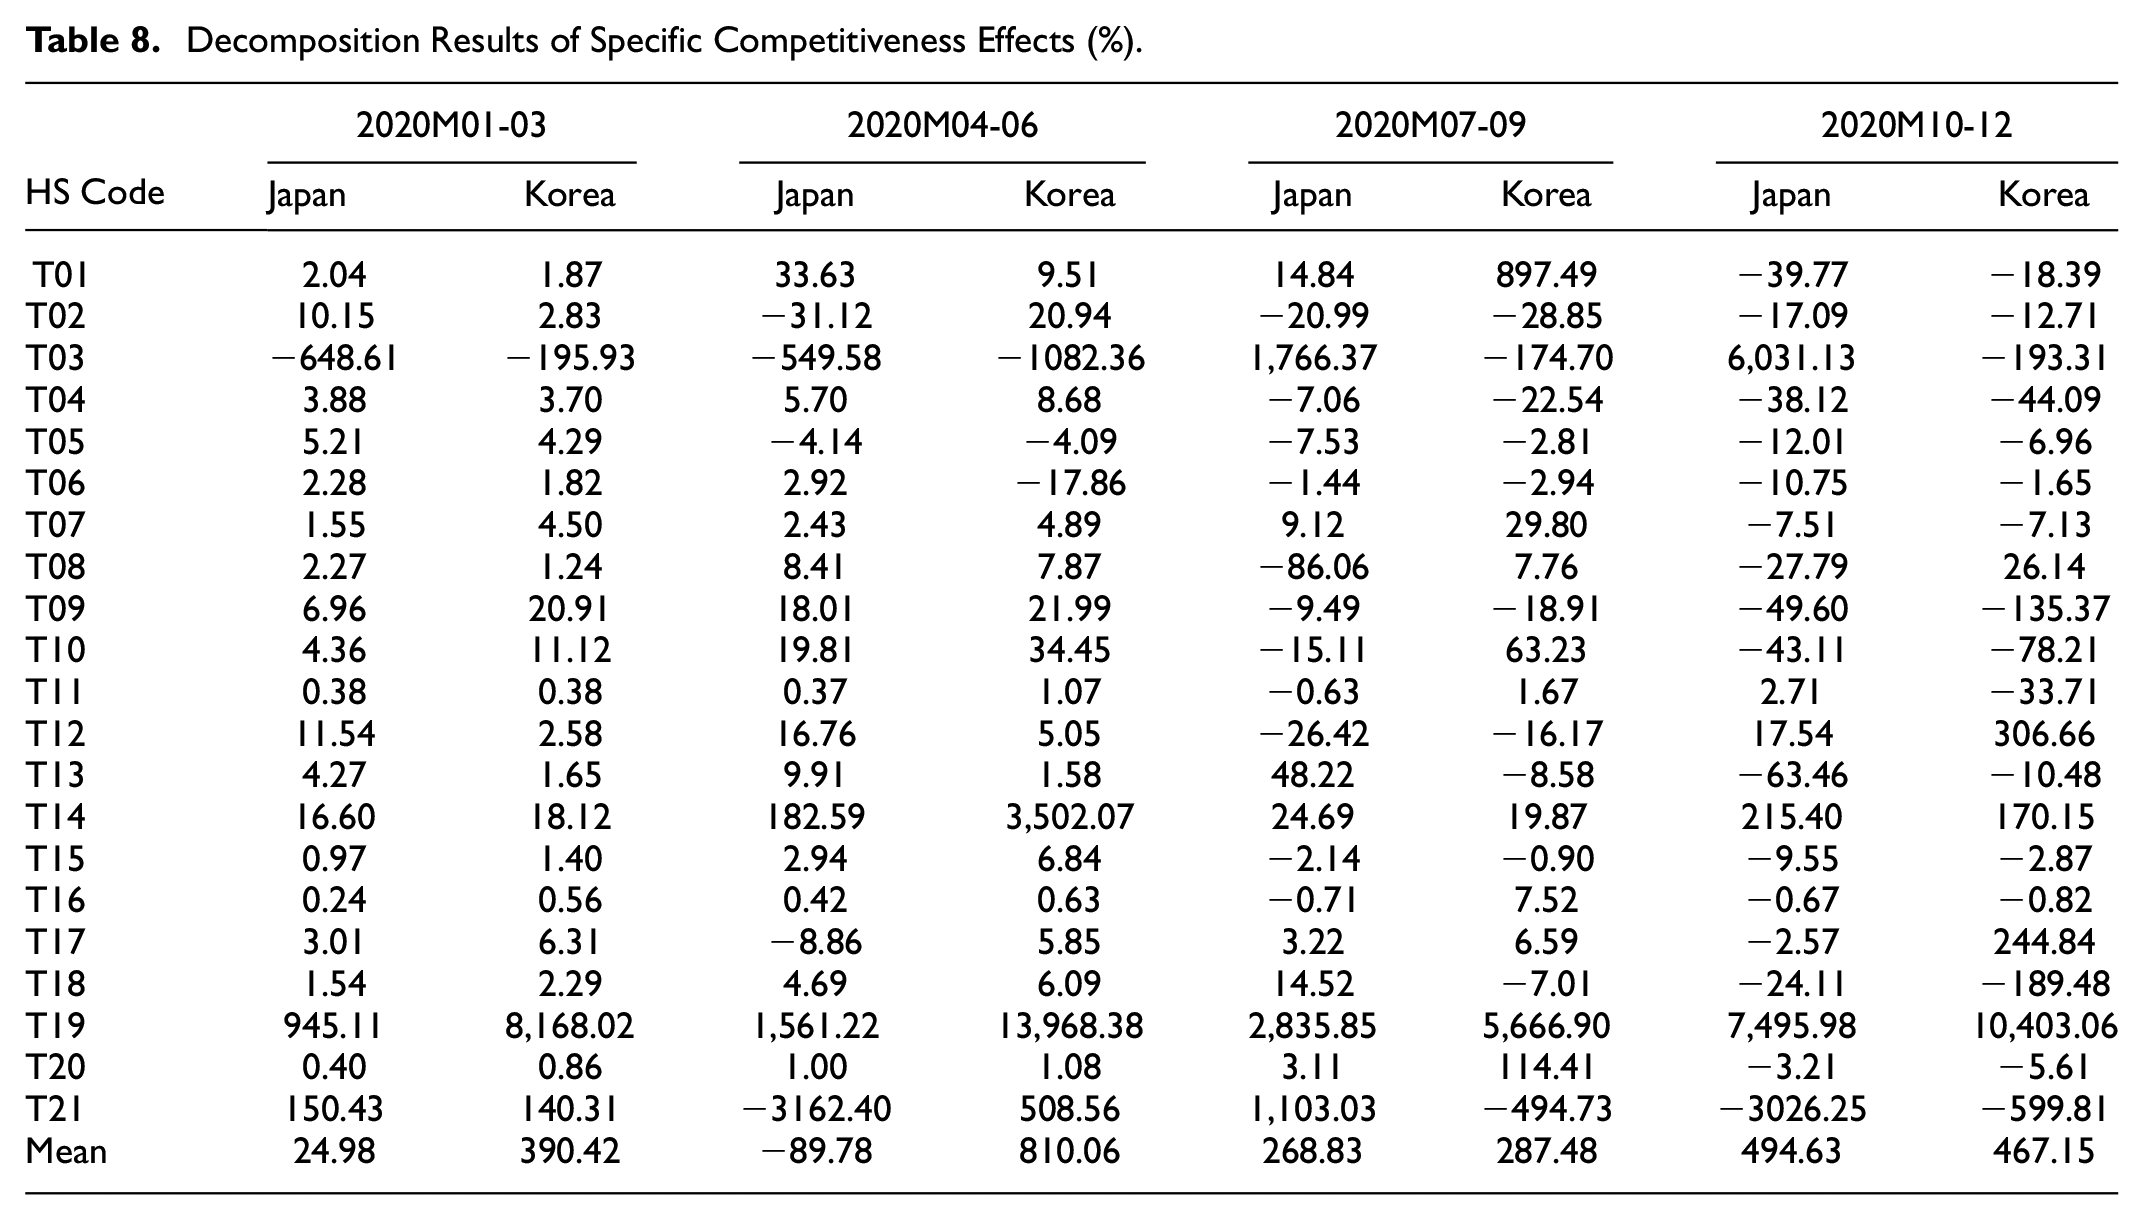
In addition, China’s export to Japan of animal products (T01), plastics and their products, rubber and their products (T07), shoes, hats, umbrellas, sticks, whips and their parts, processed feathers, and their products (T12), all showed positive promoting effects in the four phases, with the average specific competitiveness effects of 2.69%, 1.40%, and 4.86% respectively. Meanwhile China’s export to South Korea of plastics and their products, rubber and their products (T07) (8.01%), hides, leather, furs, and their products (T08) (10.75%), shoes, hats, umbrellas, sticks, whips and their parts, processed feathers and their products (T12) (74.53%), vehicles, aircraft, ships and related transport equipment (T17) (65.90%) also had positive effects in the four phases, with the average specific competitiveness effects of 8.01%,10.75%, 74.53%, and 65.90% respectively.
The average contribution rate of various commodities to export growth in the four periods is in the range of –9% to 5%, that is, the adverse specific competitiveness effect of China’s exports before and after the pandemic has not improved substantially. Thus, the impact of COVID-19 in the short term is indeed not conducive to the improvement of the specific competitiveness effect of China’s exports to Japan and South Korea on the contribution to export growth. After all, as an exogenous factor, the COVID-19 pandemic and its regulatory policies can promote the competitiveness of export products in the short term. In the long term, the competitiveness of export products depends on endogenous factors such as innovation ability, technology level, and production efficiency.
To further visualize the dynamic distribution and evolution characteristics of the specific competitiveness effect of China’s export growth to Japan and South Korea, nonparametric kernel density estimation (KDE) was conducted on the ternary marginal level, as shown in Figure 6.

Dynamic distribution evolution of the ternary margin.
The ternary margin shows different dynamic evolutions: About extension margin(EM): The EM level has always been in a high potential, since the main peaks of the four periods are all on the right. The kurtosis gradually rose and the span became larger, indicating that the EM level was stable, and the categories of export commodities continued to be rich.
There is a main peak and a side peak from January to March 2020, and the small side peak will disappear from July to September, then there is a main peak and a side peak again from October to December, indicating that the growth of various commodities appeared weak polarization at the initial stage, and the phenomenon would gradually fade away in the middle stage; it appears again after the peak of international pandemic. The curve of density function in the pre-pandemic and mid-pandemic periods is relatively left, indicating that the intensive margin(IM) level is relatively low, while the curve continues to move to the right with the kurtosis gradually declining and the span becoming larger in the late period in China, indicating that the IM level has been improved, but with the slower development speed of some products. IM includes quantity margin(XM) and price margin (PM).
About quantity margin(XM): The four curves almost overlap in the four periods, and there is no obvious change. Meanwhile, the indexes are all distributed on the right side of 1, indicating that the XM level of China’s export growth to Japan and South Korea is high.
About price margin(PM): The four curves have a slight downward and left shift trend in the time series, and the peak value does not move significantly, indicating that the PM level does not decline significantly; The wave crest pattern is similar to the dynamic evolution of the intensive margin, which indicates that the IM is mainly determined by the PM, and the curves are almost all distributed on the left side of 1, indicating that the PM level is lower than the world average.
Conclusions, Implications and Limitations
Conclusions
The current study starts with the scale indicators such as the trade flow of China’s export growth to Japan and South Korea in the context of the spread of COVID-19, measures the dynamic fluctuation level of China’s export to Japan and South Korea by stages, examines the characteristics of the wavelength, peak valley and position of China’s export to Japan and South Korea in the context of the impact of the COVID-19, and decomposes the factors of the periodic fluctuations at different time points by using the improved constant market share (CMS) analysis framework. The results show that China’s export growth to Japan and South Korea fluctuated more violently than usual, and the classical fluctuations dominated during the epidemic period; The growth rate of China’s exports to the two countries were highly resembling in shape, with multiple fluctuations lasting for 3 months each during the 2 years.
Implications
The results of factor decomposition show: First, as for the growth effect at the aggregate level, the expansion margin of China’s exports to Japan and South Korea has always been at a high level, while the intensive margin is low, and both effects have not fluctuated significantly, indicating that the growth of China’s exports to Japan and South Korea is mainly due to changes in the types of export commodities during the epidemic period. Second, as for the structure effect on the demand side, the market structure effect of China’s exports to Japan and South Korea is highly similar, and its contribution rate has declined significantly during the epidemic, indicating that China is concentrating on exporting to the market with slow demand growth. Meanwhile, China’s export commodities can no longer form a benign complementary trend with the Japanese and Korean markets, but bilateral trade ties remain close, and Japan and South Korea’s demand for some commodities imported from China are not stable. Lastly, as for the competitiveness effect on the supply side, China’s domestic supply-side problem is the main factor of the overall competitiveness effect of China’s export growth to Japan and South Korea. the specific competitiveness effect of China’s exports to Japan and South Korea contributed a high negative value to China’s export growth during the four periods. The expansion margin level showed a steady trend, the types of export commodities continued to be rich, the intensive margin level rose, the quantity margin level was high, and the price margin level was lower than the world average level.
From the perspective of multi-period export performance, the COVID-19 epidemic has impacted China’s export growth with different effects. But in the long run, the export dynamic trend has been adjusted rapidly and gradually converged to the original average level after the outbreak of the epidemic. It shows that China’s policy of “stabilizing foreign trade” has achieved good results and should continue to be implemented. Thus China should rely on the Regional Comprehensive Economic Partnership (RCEP) agreement to strengthen and stabilize the import and export trade cooperation with Japan, South Korea, Association of Southeast Asian Nations (ASEAN), and other countries in the Asia Pacific region in the context of the spread of COVID-19 so that the driving force of China’s export growth will be shifted from structure effect to competitive effect and structural effect, and the core position in the Asia Pacific industry chain and value chain will be strengthened.
In terms of export geography, both Japan and South Korea are important target markets of China before and after the outbreak of the epidemic, and their industry markets are closely linked. Therefore, it is reasonable to strengthen cooperation in the economic and trade field and deepen the regional epidemic prevention and control coordination mechanism among the three countries in the short term, to ease the supply and demand pressure of bilateral trade. In the long run, we must unswervingly support the early implementation of the signing of the East Asia Free Trade Area Agreement, to reduce the regional tariff level as much as possible, expand commodity export channels, and enhance the stability of foreign trade in an uncertain international environment.
From the export commodities point of view, Japan and South Korea, based on their technical level and manufacturing strength have relatively slow growth in demand for machines, mechanical appliances, electrical equipment and parts (T16) imported from China. Likewise, they benefit from the deepening of the international division of labor, animal products (T01), hides, leathers, furs and their products (T08), glass and its products (T13), precious metals and their products (T14), base metals and their products (T15) also have a low contribution to export growth. Therefore, the Chinese manufacturing industries should not export such commodities to the two countries in large quantities. Thus, it is utmost necessary to adjust the geographical direction of trade exports such as the disappearance and new development of mineral products (T05) fluctuating substantially, Therefore, China’s policymakers should pay attention to the export shock of the relevant industry. However, the net effect of plant products (T02) is evident in the four phases; Beverages, wine, and vinegar; Tobacco, and tobacco substitutes products (T04), plastics and its products; Rubber and its products (T07) and encourage exports to both countries because they are now largely catering to the needs of the markets of Japan and South Korea.
In conclusion, as an international public health emergency, the outbreak and spread of COVID-19 pandemic has a profound impact on a country’s import and export trade and even global international trade; Compared with the generally controllable and predictable trade war, since such public health emergencies as the COVID-19 involve public health and safety, their impact on international trade is very different, which is no longer just a matter of tax costs. It is necessary to pay attention to the impact of such public health emergencies on trade between major economies, investigate the fluctuation of trade growth and decompose its influencing factors from the perspective of market share, which contributes to propose corresponding policies and measures to stabilize the existing international market share, to provide a factual basis for further evaluating the relevant policies issued by the government, and to provide experience for reference when similar international public health emergencies occur in the future. Therefore, the conclusions and implications can be generalized to similar international public health emergencies after we have complemented and improved the policy implications.
Limitations and Future Research
The limitations of the present study and directions for future research are also addressed. One of the limitations of the current study is that it doesn’t consider the dynamic fluctuation of China’s export growth to Japan and South Korea and its factor decomposition in the whole cycle from the outbreak of the COVID-19 to the normalization of pandemic prevention and control in December 2022; The second limitations is that it has not been able to target more main China’s trade parties. As an international public health emergency, the COVID-19 pandemic has a different theoretical mechanism from other events in terms of impact on international trade, which is also an aspect that we will pay attention to in future research.
Footnotes
Declaration of Conflicting Interests
The author(s) declared no potential conflicts of interest with respect to the research, authorship, and/or publication of this article.
Funding
The author(s) disclosed receipt of the following financial support for the research, authorship, and/or publication of this article: This study was supported by the social sciences and humanities research program project, Ministry of Higher Education P.R China, grant number (21YJA790081).
Ethics Statement
This is not applicable, since no animal or human but economy and trade was conducted in this study.