
Abstract
In recent years, with economic development, urbanization has been accelerating. In the past 100 years, the global average temperature has increased by 0.5°C, and according to the predictions of most global climate models, the temperature will continue to increase by 1.5°C to 3.0°C in the next 100 years. Under the influence of global warming, the urban heat island effect problem is becoming more and more serious, bringing much harm. Studying the thermal effect and its influencing factors is of great significance for sustainable urban development. In this study, the seasonal and interannual surface temperature changes of the study area are inverted based on the SW-TES algorithm, and the LST inversion of the algorithm is simply verified. At the same time, a cell dichotomous model was established to explore the influencing factors of the urban heat island effect and the influence of different land use types and normalized vegetation indices in the Hangzhou metropolitan area was analyzed. The results showed that the overall heating trend of the study area showed a heating trend, the expansion rate of regional construction land was relatively fast, and the scale of urban land was increasing. Based on the results of surface temperature changes of areas with different land types, we obtained the temperature trends of each land type [from 2005 to 2018] and found that there was a negative correlation between surface temperature and normalized vegetation index. This study provides a theoretical basis to evaluate the urban heat island effect and analyze factors that impact it and would promote sustainable urban development.
Keywords
Highlights
The surface temperature changes of the study area were inverted by SW-TES algorithm.
A cell dichotomous model for influencing factors of heat island was established.
The influence of different land use types in the study area was analyzed.
The influence of normalized vegetation indices in the study area was calculated.
A theoretical basis is provided to evaluate the heat-island effect and the factors.
Introduction
In recent years, with the development of the world economy, urbanization has been accelerating, while global warming, and many urban problems have occurred accordingly, such as changes in urban precipitation characteristics (M. Yan et al., 2020), In other respects, it is more likely to cause fire (Carnicer et al., 2022). Among them is the growing problem of urban heat island effect, which has a deeper impact compared to other issues. The heat island effect, first introduced by Manley in 1958, is a phenomenon in which urban centers are significantly warmer than suburban areas due to the nature of the urban substrate and other factors such as lack of vegetation, creating a “heat island” (Rizwan et al., 2008). It directly affects urban ecology, air quality, etc., affects people’s productive life, and is likely to increase the risk of UHI to health, especially heat exposure (Yardley et al., 2011).
As a result, many studies have been conducted on the formation of the heat island effect: Zou et al. (2021) experimentally found that increasing the natural subsurface cover can reduce the intensity and warming potential of the UHI effect; Li, Zhang et al. (2020) attributed the formation of the heat island effect to structural changes in the subsurface due to urbanization and found through their study that aerosols affect the UHI; Liang et al. (2021) simulated the effect of fine-scale urban subsurface on the urban heat island effect in Beijing and found that near-surface temperature was negatively correlated with emissivity/albedo and that near-surface temperature was positively correlated with urban fraction; The correlation between subsurface transformation and heat island effect was established by analytical and statistical methods by Li, Zhang et al. (2020). In terms of general trends, the urban heat island effect is positively correlated with the expansion of hard surfaces and the deterioration of green surfaces and water bodies (Li, Zhang et al., 2020). Various studies now show that the subsurface factor is the main reason for the formation of the heat island effect.
In the context of rapid urbanization and global climate change. Factors related to surface temperature (LST) and how to mitigate the UHI effect have been extensively studied. Wei and Wang (2022) analyzed the spatial distribution of LST and its relationship with the bottom surface through classification and intersection and found that the underlying surface was closely related to the surface temperature. Wu et al. (2022) used Pearson correlation analysis and geographic and temporal weighted regression (GTWR) analysis to explore the impact of potential land surface changes caused by urban renewal on the spatiotemporal heterogeneity of LST, the results showed that the renewal of urban undersurface had a positive impact on LST changes in all regions. Mathew et al. (2018) used surface temperature as a key parameter for urban surface heat island research. Studies have shown that vegetation cover has the lowest temperature throughout the observation period. Observation time is very important for analyzing the effectiveness of remote sensing data on surface temperature changes under different land cover and the effectiveness of urban surface heat island studies.
Researchers try to simulate the surface temperature through various methods, explore urban development trends, and mitigate the heat island effect. Sekertekin and Zadbagher (2021) used the Normalized Difference Establishment Index (NDBI) and Normalized Difference Vegetation Index (NDVI) to project LST images of the study area for 2021 and simulate surface temperature by the Markov chain method, which showed a Kappa value of 0.73, indicating a reasonable simulation for the future. Wang et al. (2015) proposed an improved single window (IMW) algorithm for LST retrieval from Landsat 8 TIRS Band 10 data. Hu et al. (2014) proposed and evaluated the use of 10 years of Moderate Resolution Imaging Spectroradiometer (MODIS) data and the simulated High-Resolution Land Data Assimilation System (HRLDAS) for surface temperature simulation.
However, there is still little research on the influence of urban morphology and spatial distribution on land surface temperature (LST), especially from the perspective of urban planning. Estoque et al. (2017) explored the relationship between surface temperature and impervious surfaces and spatial patterns and found that the average LST of impervious surfaces was on average about 3°C higher than that of green spaces; Bokaie et al. (2016) studied the relationship between surface temperature and land use/land cover (LULC) in Tehran metropolitan area as an example and the results showed a negative correlation between land cover and surface temperature; Mohammad Harmay et al. (2021) used the Community Land Model (CLM) to assess the intensity of the urban heat island (UHI) in relation to surface temperature and compositional attributes, and the analysis showed that UHI intensity and its compositional attributes were correlated with local LULC and climate change; Nastran et al. (2019) found a consistency of change between the two by comparing the change in floor area and the change in heat island effect as a percentage of total area in Jakarta; Zou et al. (2021) conducted a moving sample strip experiment in Shenzhen and found that increasing the natural potential ground cover could reduce the intensity and warming potential of the heat island effect; J. Ren et al. (2023) studied the land use/land cover type in each region, and the results reflected the LULC thermal environment in the context of new urbanization in China; In order to reveal the influence of urban spatial morphology on land surface temperature, J. Yang et al. (2021) and X. C. Yang et al. (2010) analyzed the spatial distribution of LST and five urban morphological indicators in Dalian as an example, and the results showed that LST has a strong spatial positive correlation. Fuladlu (2022) studied the effects of land cover (LULC) on thermal response and changes in land surface temperature (LST). The results showed that agricultural intensification increased LST, while wetlands and woodlands decreased LST, and there was an inverse correlation between LST and normalized poor vegetation index (r = −.082, p < .01), degree of university (r = −.711, <.01, p < .01) and humidity (r = −.702, p < .01).In summary, land use and vegetation cover are considered to be the most important factors influencing the heat island effect.
Although there are many studies on the urban heat island effect, most of them start from a large city and statically analyze the urban heat island effect, and there are few long-term trend studies. At the same time, the influence of land surface temperature and vegetation cover change on urban heat islands is mainly studied, and the trend of urban heat islands is explored. Based on the SW-TES algorithm, this paper discusses the influencing factors of land surface temperature inversion on the urban heat island effect, and not only analyzes the influence of normalized vegetation index on the heat island effect in the study area but also explores the urban development trend in depth based on the temporal and spatial variation characteristics of land cover in Hangzhou metropolitan area, the results of land use type transfer and land utilization change, fill the gaps in the relevant fields of the current research field of spatial distribution on the influence of land surface temperature. To provide a scientific basis for urban construction ecology and sustainable urban development, provide theoretical support for scientific planning and improvement of ecological environment, and have important reference significance for urban thermal environment-related research. The study of the urban heat island effect is a global topic that requires cooperation and exchange among scientists from all over the world. Through the data, methods and experience of this study, we hope to contribute to the research process of the urban heat island effect and promote the development and implementation of solutions. The paper is organized as follows: Section 2 describes the location of the study area and its basic information as well as the data used in this paper. Section 3 reviews the SW-TES algorithm and the like-element dichotomous model. Section 4 focuses on the effects of different land use types and normalized vegetation indices on surface temperature in the Hangzhou metropolitan area. Section 5 summarizes the main findings.
Study Area and Data
Study Area
The Hangzhou metropolitan area is centered on Hangzhou, with Shaoxing, Jinhua, Huzhou, Jiaxing, Xuancheng, Huangshan, and Quzhou as the eight prefecture-level cities. It is located on the southern flank of the Yangtze River Delta economic circle and reaches the economic level of upper-middle-income countries as classified by the World Bank (J. Ren et al., 2023). The urban expansion of the Hangzhou metropolitan area has grown by leaps and bounds, between 1994 and 2015, the annual growth rate of land expansion in built-up areas in Hangzhou and Shaoxing exceeded 12.1%, and the annual population growth rate of Jiaxing and Shaoxing exceeded 1.5% (Xiao et al., 2019).
Currently, the Hangzhou metropolitan area gathers more than 76% of the total digital economy scale in Zhejiang and more than 70% of the cloud computing capacity in China and cultivates several leading digital economy benchmark enterprises (Zhu & Chen, 2022). By 2022, the Hangzhou metropolitan area has made significant progress in the development of homogeneity and integration and has built a modern metropolitan area with a high level of urbanization. However, with the accelerated urbanization and the impact of global warming, the Hangzhou metropolitan area has experienced a more serious heat island effect. The ensuing hazards have impeded the sustainable development of economies and cities. Therefore, this study selects Hangzhou metropolitan area as the research area to provide some reference for the ecological and sustainable development of urban construction. The location of the study area is shown in Figure 1.

Location of the study area.
Data Sources
The data collected and used in this study include LULC maps from 2005, 2010, 2015, and 2018, as well as raw remote sensing data from the Landsat series of satellites, including MODIS surface temperature products. As shown in Table 1.
Data Sources.

Methods
First, specific infrared channel pairs are selected based on thermal infrared channels to recover the surface brightness temperature accurately, and then the TES algorithm is added to separate the LST and LSE from the surface brightness temperature. MODIS surface temperature data are obtained, bringing in the thermal emissivity and atmospheric water vapor content of the surface, and the SW-TES algorithm is used to perform the surface temperature of the study area in Arcmap 10.7 The interannual and seasonal variation results of Hangzhou metropolitan area are obtained by inversion, and the LST inversion of the algorithm is simply validated, and the LST retrieval results of the extended SW-TES method are cross-validated in stages to prove the advancement and accuracy of the adopted method. Secondly, an image dichotomous model was established to collect satellite raw remote sensing image data, and data pre-processing was carried out using ENVI 5.3 and Arcmap 10.7, including data reading and calibration, image mosaic and cropping, atmospheric correction, etc. The processed data were then subjected to vegetation index inversion to obtain NDVI data of the study area and analyze the effects of different land use types and normalized vegetation index in the Hangzhou metropolitan area. The effects of different land use types and NDVI in the Hangzhou metropolitan area were analyzed. Finally, the land cover types in the study area were interpreted and analyzed by using GIS and LULC raster data, and the direction of land use type changes and their quantitative structure characteristics were studied by the dynamic land use transfer matrix method.
SW-TES Algorithm
Based on thermal infrared channels, the study designs a procedure to select specific infrared channel pairs that use only satellite measurements based on sw-like equations to recover accurate ground brightness temperatures. Then the TES algorithm is introduced to separate LST and LSE from the recovered ground brightness temperature. Finally, depending on the carefully chosen channel configuration, the LST can be retrieved directly from satellite TIR measurements without knowledge of atmospheric information and LSE.
The surface temperature is first inverted using a single-channel algorithm and thermal infrared to bring in the thermal emissivity of the surface combined with the atmospheric water vapor content to be able to invert the surface air temperature. The equations are as follows (Zheng et al., 2022):


The formula

Secondly, using the angle-dependent sw-like equation (Equation 1), the temperature at different local observed zenith angles can be obtained, and the LST and LSE are separated using the ground brightness temperature (Zheng et al., 2022).

where
Like the Elementary Dichotomous Model
In this study, the acquired data were firstly read and calibrated, image mosaic and cropping, and atmospheric correction in ENVI software for image pre-processing. After that, an image dichotomous model was used for vegetation cover inversion, the steps are shown in Figure 2.

Cell binary model flowchart.
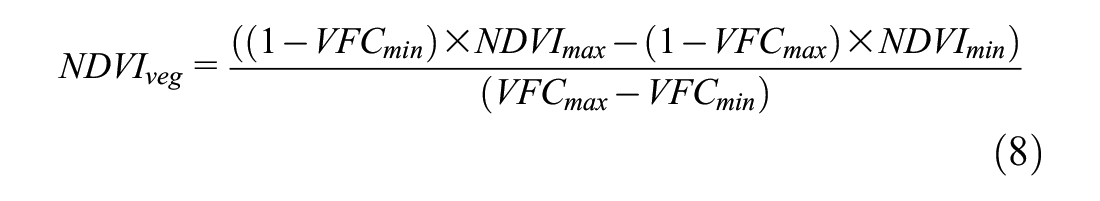
The image dichotomous model assumes that the surface of an image element consists of two parts, which are the surface with vegetation cover part and the surface without vegetation cover part, and is a simple and practical model for remote sensing estimation. And the spectral information observed by the remote sensing sensor is also synthesized by the linear weighting of these two component factors, and the weight of each factor is the ratio of the respective area in the image element. The calculation formula is shown in (6) (K. Yan et al., 2022).

where

Results
Results of Surface Temperature (LST) Inversion
Results of Inversion of Interannual Variation in Hangzhou Metropolitan Area
The inversion of the surface temperature was performed using a single-channel algorithm and thermal infrared, and the thermal emissivity was brought to the surface with the atmospheric water vapor content to obtain the inversion results (Figure 3). The results show that the overall temperature of the study area gradually increases from northwest to southeast, in which the areas with higher surface temperatures are mainly located in Quzhou, Jinhua and Jiaxing. In addition, from 2005 to 2018, the maximum temperature in the study area increased from 18.4°C to 19.1°C, an increase of 0.7°C; the minimum temperature increased from 14.5°C to 15.1°C, an increase of 0.6°C, and the study area showed an overall warming trend. Sheng et al. (2017) compared urban land (UHI) intensity in Hangzhou, China, using air temperature at 1.5 m height (Tair) and Landsat surface temperature (LST), and found an increasing trend in annual temperature in the study area; Gohain et al. (2021) studied the effect of different types of land use on the heat island effect and found that the difference in mean surface temperature (LST) between the original impervious surface and the newly added impervious surface between 1996 and 2017 was 1.43°C, indicating an overall warming trend in the study area, which is consistent with the findings of this paper.

Inversion results of land surface temperature: (a) inversion results in 2005, (b) inversion results in 2010, (c) inversion results in 2015, and (d) inversion results in 2018.
Results of Inversion of Seasonal Changes in Hangzhou Metropolitan Area
The results of the inversion of seasonal changes in the Hangzhou metropolitan area from 2005 to 2018 are shown in Figure 4, which shows that the urban surface temperatures in the study area have obvious seasonal differences, strongest in July-September, followed by April-June and October-December, and weakest in January-March. Surface temperatures were above 3.3°C in all seasons, with surface temperatures above 24.0ᾶ in July-September and a maximum surface temperature of 28.4ᾶ in 2018. The maximum surface temperature from 2005 to 2018 increased by 0.2°C to 2.2°C in each season, respectively. Xie et al. (2010) took the Yangtze River Delta as an example to study the spatial pattern changes of surface air temperature (SAT) and found that with the serious global warming and heat island effect, the surface air temperature in the Yangtze River Delta region continued to increase at a rate of 0.11°C to 0.15°C every decade, and there were seasonal variations, which further verified the accuracy of this study.

Seasonal variation of surface temperature in the Hangzhou metropolitan area.
Simple Verification of SW-TES Algorithm LST Inversion
CRU TS is one of the most widely used climate datasets today, including a variety of meteorological element data, of which surface temperature is one of the important meteorological elements. Produced by the UK’s National Centre for Atmospheric Science (NCAS). The surface temperature dataset obtained from NCAS was processed to obtain the annual average surface temperature of the study area in 2005, 2010, 2015, and 2018. Cross-validation with LST retrieval using the extended SW-TES method was performed, mainly achieved by correlation analysis. The specific results are shown in Table 2. The results show that the LST retrieval using the extended SW-TES method is comparable to the CRU TS LST product with high accuracy. The SW-TES hybrid algorithm was investigated using the Chinese Gaofen 5 satellite data by H. Ren et al. (2018). The results show that the algorithm is less sensitive to instrument noise and atmospheric data errors, and obtains an error-small LST and emissivity of 1 K and 0.015, respectively, which are better than the single TES or SW algorithms. Finally, the hybrid algorithm was tested in simulated images and ground measurement data and accurate results were obtained, verifying that the SW-TES algorithm has a high accuracy (H. Ren et al., 2018).
SW-TES Algorithm Inversion LST and CRU TS Correlation Analysis.

Normalized Vegetation Index (NDVI) Inversion Results
Based on the image dichotomous model, vegetation cover index inversion was performed on the obtained raw remote sensing image data to obtain NDVI data of the study area. The results are shown in Figure 5. Normalized vegetation index (NDVI) is a standardized measure of healthy vegetation. When the NDVI value is high, the vegetation is healthier. When the NDVI is low, there is less or no vegetation. In general, the vegetation in the study area shows the distribution characteristics of “more in the west and less in the east, more in the north and less in the south.”

NDVI inversion results: (a) 2005 inversion results, (b) 2010 inversion results, (c) 2015 inversion results, and (d) 2018 inversion results.
Spatial and Temporal Characteristics of Ground Cover in Hangzhou Metropolitan Area
Temporal and Spatial Changes of Land Cover Types in Hangzhou Metropolitan Area
Based on GIS and LULC raster data, the land cover types in the study area were interpreted and analyzed. In this paper, the land cover types in the study area were classified into seven categories, namely, Grass, Deciduous Forest, Farmland, Urban Land, Bare Land, Waters, and Evergreen Forest. The specific distribution results are shown in Figure 6. The various types of land cover types were counted and processed (Figure 7), and the changes in the area of each land use type in the study area in adjacent years were analyzed (Figure 8), and the growth rate of each land cover type in the study area between 2005 and 2018 was explored (Figure 9). The results of the analysis showed that the main land cover types in the study area were dominated by forest land, followed by agricultural land. At the same time, it can be seen that urban land use is on a rising trend year by year, and agricultural land and evergreen forest land use is on a decreasing trend year by year. Secondly urban land in the study area from 2005 to 2018 has been built up rapidly in recent years, with an area growth rate of 53.79%, while a relatively large decrease in the area of agricultural land and bare land can also be observed, probably due to the conversion of this part of the land cover type into urban land.

Results of land use interpretation: (a) land use interpretation in 2005, (b) land use interpretation in 2010, (c) land use interpretation in 2015, and (d) land use interpretation in 2018.

Area statistics of different land use types in the study area.

Area changes of different land use types in the Hangzhou metropolitan area at different time periods.

Growth rates of land use types in the study area from 2005 to 2018.
Results of Land Use Type Transfer in Hangzhou Metropolitan Area
The study and analysis of the dynamic transformation of land use are conducive to promoting the rational development and utilization of limited land resources and is beneficial to the realization of coordinated land use and socio-economic development. In studying the direction of land use type change and the structural characteristics of its quantity, this study uses the dynamic land use transfer matrix method.
(1) Analysis of the dynamic transformation of land use in the Hangzhou metropolitan area from 2005 to 2010
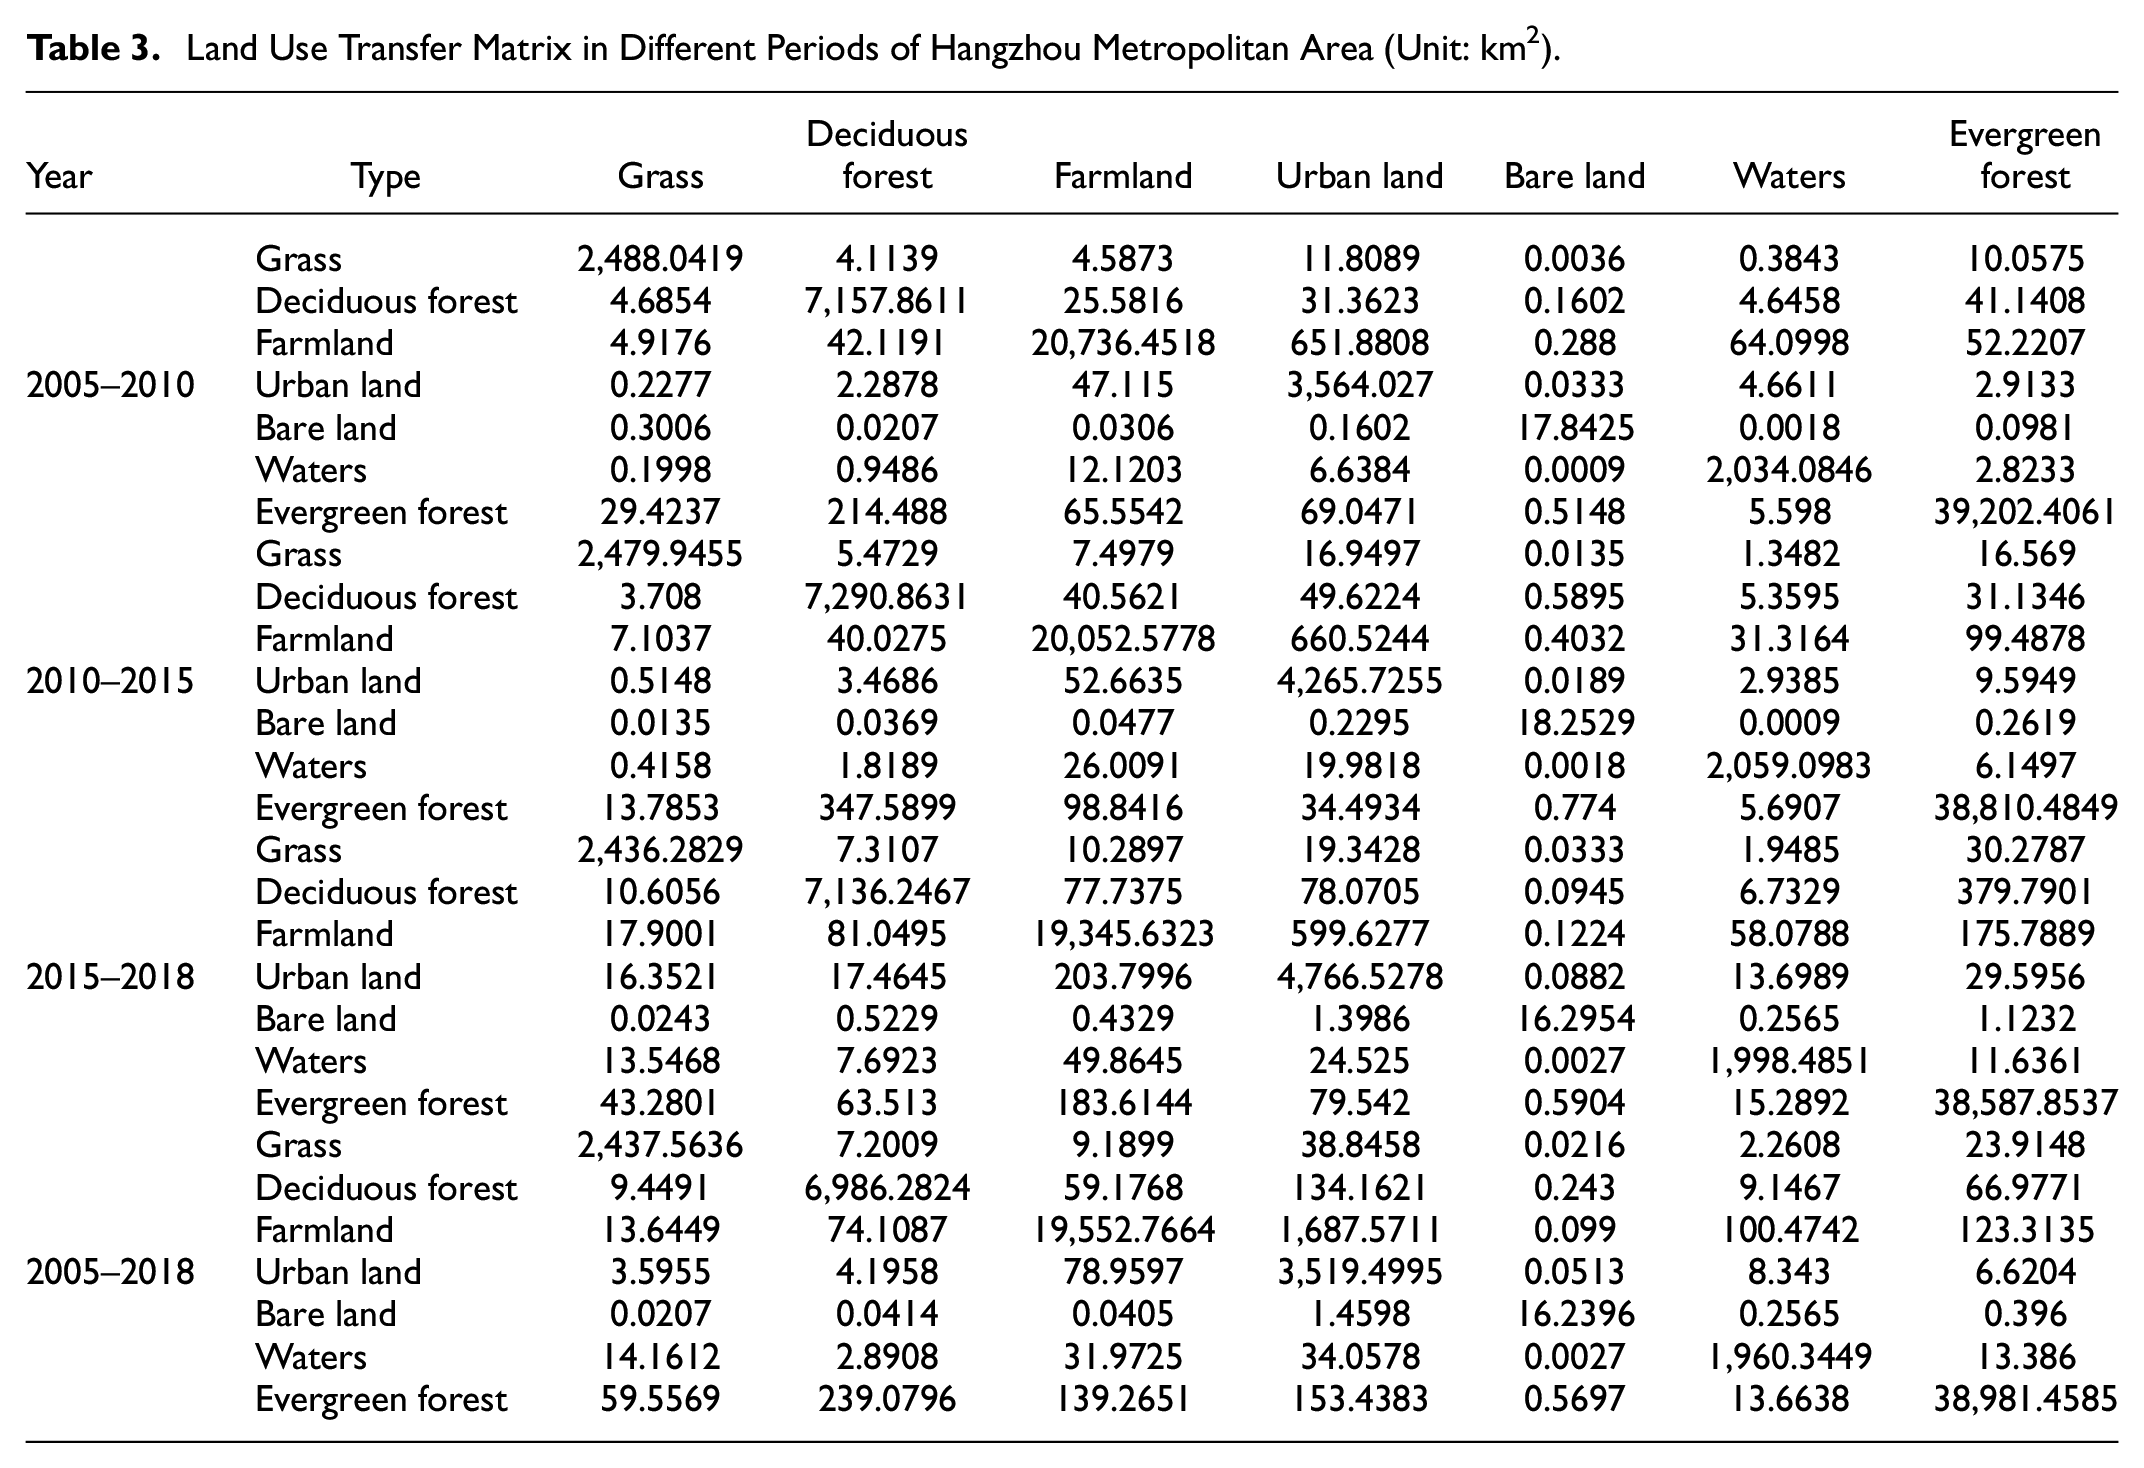
From Table 3 and Figure 10, it can be seen that the area of urban construction land transferred to 770.89 km2 in this phase, which is the land type with the largest number of area changes. It is mainly transferred from agricultural land to 651.88 km2, accounting for 84.56% of the area transferred from urban construction land, followed by 100.41 km2 transferred from forest land. At the same time, 47.12 km2 of construction land was also transferred out to agricultural land. The second highest number of changes in land area is forest land, where the area transferred out (492.20 km2) is higher than the area transferred in (389.68 km2), of which 51.94% is used for the interconversion of the two types of forest land, the number of areas transferred out as urban construction land and farmland accounted for 20.40% and 18.52% of the total area transferred out, respectively, and the land transferred in was mainly farmland, with an area of 94.24 km2 transferred in. It can be seen that the land use transfer at this stage is dominated by the partial transfer of farmland and forest land to urban construction land, which is related to the Hangzhou Metropolitan Economic Circle Development Plan released by the state to promote the economic development of the Hangzhou metropolitan area.
(2) Analysis of the dynamic transformation of land use in the Hangzhou metropolitan area from 2010 to 2015
Land Use Transfer Matrix in Different Periods of Hangzhou Metropolitan Area (Unit: km2).
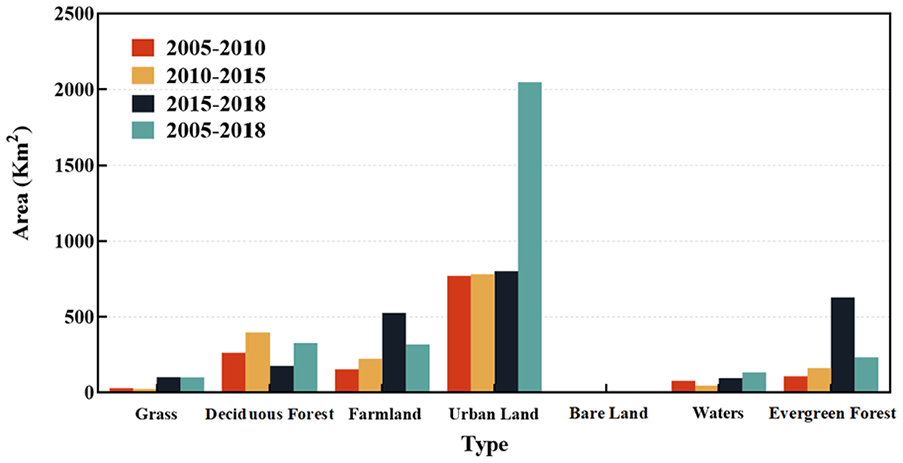
Changes in the area of land use transfer in different periods of time in the Hangzhou metropolitan area.
From Table 3 and Figure 10, it can be seen that the largest change in land area in the study area during 2010 to 2015 is urban construction land, followed by forest land, agricultural land, water and grassland in that order. The transferred area of urban construction land in this phase (781.80 km2) is 11 times larger than its transferred area (69.20 km2), and most of it is transferred to agricultural land, whose transferred area accounts for 84.49 of the total transferred area, followed by forest land with 10.76% of the total transferred area. The area of forest land transferred in at this stage was 561.61 and 632.15 km2 was transferred out, with a net decrease of 70.54 km2, of which 139.52 km2 was transferred in from farmland accounting for about 24.84% of the total transfer, and the transfer out was still dominated by the conversion of two types of forest land into each other, accounting for about 59.91%. In summary, the conversion of forest land and agricultural land into urban construction land is still dominant in this stage, which is related to the further deepening of urbanization in the Hangzhou metropolitan area.
(3) Analysis of the dynamic transformation of land use in the Hangzhou metropolitan area from 2015 to 2018
Based on the data in Table 3 and Figure 10, it can be concluded that: from 2015 to 2018, in order of magnitude, the net change in land area is urban construction land, agricultural land, forest land, grassland, water area and bare land. Among them, the transferred-in area of urban construction land (802.51 km2) is much larger than the transferred-out area (281.00 km2), and the main transferred-in land type of urban construction land is still farmland, with a transferred-in area of 599.63 km2, accounting for 74.72% of the total transferred-in area. Meanwhile, 72.53% of urban construction land was transferred out to farmland, but there was a net increase of 521.51 km2 of urban construction land, indicating that more other land was converted to urban construction land than it was transferred out. In this phase, the land transferred from farmland was 525.74 km2 and the land transferred out was 932.57 km2, with a net decrease of 406.83 km2. The types of land transferred out were mainly urban construction land, forest land and water area, which accounted for 64.30%, 27.54%, and 6.23% of the total transferred land area in that order.
(4) Analysis of dynamic transformation of land use in the Hangzhou metropolitan area from 2005 to 2018
The land use transfer matrix for the Hangzhou metropolitan area from 2005 to 2018 is shown in Table 3, and the land use transfer map for the study years is shown in Figure 10. The table shows the transfer of various types of land use in the study area over 15 years. During the study period, a total of 101.77 urban building sites were transferred out and 2049.53 km2 were transferred in, resulting in a total increase of 1947.77 km2 in the final area. A total of 1999.21 km2 of agricultural land was transferred out and 318.60 km2 was transferred in, resulting in a final area reduction of 1680.61 km2; a total of 687.01 km2 of forest land was transferred out and 562.125 km2 was transferred in, resulting in a final area reduction of 124.88 km2. A total of 96.47 km2 of water area was transferred out and 134.15 Km2 was transferred in, resulting in a final area increase of 37.67 km2. A total of 81.43 km2 of grassland was transferred out and 100.43 km2 was transferred in, resulting in a final area increase of 19.00 km2.
The comprehensive land transfer data of the overall study period shows that the increase of urban construction land area in the Hangzhou metropolitan area from 2005 to 2018 mainly relies on the transfer of two types of land: agricultural land and forest land, and the rapid expansion of construction land in the study area is achieved by the massive occupation of agricultural land resources and forest land resources. In addition, a certain proportion of forested land was converted into grassland and water, indicating a high frequency of interconversion between various types of land in the Hangzhou metropolitan area throughout the study period, although there are problems of unreasonable use of land resources such as expanding urban construction and occupying arable land in its development, it focuses on the protection of forest resources in the region, which to a certain extent alleviates the problem of declining quality of the regional ecological environment.
Land Use Change Rate Results
The rate of land use change is an important element in the study of land use change, which is generally reflected by the dynamic attitude of land use. The rate of land use type change was obtained by calculating the dynamic attitude of land use in the study area, and the future land use of the area was reasonably predicted based on the current land use situation. For a single type of land, the rate of land use change, that is, the quantitative change status of that type of land over the study period, is expressed as:

Where
The land use change rates of the six land use categories in the study area were calculated according to Equation 9 and are shown in Figure 11. From this figure, it can be seen that, among the six types of land use in the study area during the period 2005 to 2010, urban construction land is at the highest level of change, followed by water, whose rate of change in use is 0.73, and the rest are below 0.5; During 2010 to 2015, the absolute values of the rate of change in the use of various types of land in the study area were urban construction land, bare land, forest land, agricultural land, grassland and water area in order of magnitude, indicating that the change in the use of urban construction land was the most obvious during this period, with a rate of change value of 3.29, while the use of water area changed the most slowly, with only 0.07; The rate of change in utilization of bare land jumped to the first place in absolute value during 2015 to 2018, and the absolute value of change in utilization of forest land also increased in this period, with the smallest absolute change of 0.11% for watershed; During the whole study period of 2005 to 2018, the rate of change in the use of construction land in Hangzhou metropolitan area was the largest, 3.59% and positive, and the rate of change in the use of agricultural land, forest land and bare land was negative, it shows that during this period, the construction land in Hangzhou metropolitan area expanded at a faster rate and the scale of land use increased continuously, and the increase of its area mainly came from the occupation of agricultural land, forest land and bare land. This is related to the rapid development of urbanization in the study area.

Rate of land use change for the six land use categories in the study area.
Surface Temperature Variation and Correlation Analysis of Different Land Use Types
Changes in Surface Temperature of Different Land Use Types in the Hangzhou Metropolitan Area
The surface temperature statistics of each site type in the study area from 2005 to 2018 are shown in Figure 12, which shows that different site types exhibit different thermal properties and temperature distributions due to the different subsurface bedding surfaces. In terms of minimum variation, it has the highest value in the waters with a surface temperature of 16.43°C and the lowest value in the woodlands with a surface temperature of 14.46°C, while the overall minimum temperature in the study area shows an increasing trend with time. In terms of maximum variation, it has the highest value in the woodlands with a surface temperature of 18.02°C and the lowest value in the waters with a surface temperature of 17.37°C. The overall maximum temperature in the study area also showed an increasing trend with time. This may be due to the large specific heat capacity of water, so the temperature change is small, and the range of cooling and heating is smaller compared to other land types. Woolway et al. (2016) quantified the pattern and magnitude of temperature changes in surface waters by analyzing high-frequency data from 100 lakes, noting that temperature magnitude changes in waters significantly decrease with increasing lake area. In terms of average variation, the highest average temperature was found in urban building sites, up to 17.18°C, and the lowest average temperature was found in grassland, at 15.89°C. The overall average temperature of each site type shows an increasing trend. This indicates a very strong relationship between urban construction sites and surface temperature. Tran et al. (2017) proposed a model applying a nonparametric regression in which the study area showed significant changes in LULC due to urbanization and industrialization, with a large increase in urban construction land, resulting in a significant upward trend in surface temperature.

Temperature statistics by land use type in the Hangzhou Metropolitan Area: (a) in 2005, (b) in 2010, (c) in 2015, and (d) in 2018.
The temperature trend of each site type from 2005 to 2018 showed the same pattern, with the highest surface temperature in the built-up area. The reason for this is that the urbanization process has transformed a large number of natural surfaces into impermeable surfaces such as concrete pavements and buildings, which have good heat absorption and tend to absorb a lot of heat during the day, resulting in the highest surface temperatures in built-up areas. Morabito et al. (2016) studied the relationship between urban building coverage and surface temperature change in four cities and found a significant linear relationship between built-up area surface and LST; The surface temperature of forest land is the lowest, followed by water bodies and wetlands. The reason for this is that the transpiration of vegetation can take away a lot of heat and has a cooling effect, and water bodies and wetlands contain high moisture, and their evaporation can also cool the temperature, so the surface temperature of these land types is relatively low. Richards et al. (2020) concluded by exploring the relationship between different types of vegetation and cooling that vegetation can significantly improve temperatures in cities with hot and humid climates, with secondary forests having the most pronounced effect; Karakuş (2019) investigated the relationship between land use/land cover change (LULC) and surface temperature (LST) in and around Sivas city center using Landsat imagery from 1989 to 2015 and justified the urban heat island intensity (UHI). The results show that urban construction land and agricultural land increased and bare land decreased during the study period. The urban built-up area increases with its highest surface temperature, while the surface temperature of woodland shows a decreasing trend and the urban heat island intensity is positive. Consistent with the results of this study.
Correlation Analysis Between LST and Normalized Vegetation Index
From the graph of correlation analysis between surface temperature and normalized vegetation index in the study area in 2005, 2010, 2015, and 2018 (Figure 13);

Results of the correlation analysis between LST and NDVI (a) to (d): in 2005, in 2010, in 2015, and in 2018.
There was a significant negative correlation between normalized vegetation index and surface temperature, which reached a significant difference (p < .01), and the correlation coefficient between surface temperature and normalized vegetation index tends to be more toward 1 in 2015 and 2018, it indicates that the correlation between surface temperature and normalized vegetation index is more significant. This is because vegetation has transpiration, shadow effect, evapotranspiration cooling, water accumulation and many mechanisms, which can absorb the surrounding heat into chemical energy, store water and gradually release it into the surrounding environment, increase the wetness of the surface, thereby reducing the surface temperature. X. C. Yang et al. (2010) used NOAA/AVHRR normalized differential vegetation index (NDVI) data to study the influence of vegetation cover on surface temperature change by subtracting reanalysis from observations, and the results also showed that the trend of surface temperature change was negatively correlated with the surface vegetation index (X. C. Yang et al., 2010). In the process of urbanization, the increase of green vegetation cover contributes to the improvement of the urban thermal environment, which is in line with the general perception of the society. Tepanosyan et al. (2021) studied changes in land cover area (LC) and 19 surface urban heat islands (SUH) and showed that the expansion of floor area and reduction of vegetation cover are the main factors contributing to the increase in LST in Yerevan.
Discussion
During 2005 to 2018, the study area showed an overall warming trend. Q. Huang & Lu (2015) studied the temperature changes of the Yangtze River Delta urban agglomeration since 1978 and found that the average temperature increase rate caused by urbanization in the Yangtze River Region was 0.124 ± 0.074 °C/decade, which was consistent with the results of this study. At the same time, the study area is located in the eastern coastal area of China, which belongs to the subtropical monsoon climate zone, which has obvious impact on wind characteristics, resulting in obvious seasonal differences in the study area. H. Du et al. (2016) evaluated the surface UHI of the Yangtze River Delta urban agglomeration (YRDUA) and its relationship with land type, meteorological conditions, artificial heat sources and urban areas, and the results showed that the UHI intensity of YRDUA was strongest in summer (0.84°C), followed by 0.81°C in autumn, 0.78°C in spring and 0.53°C in winter, which verified that there were indeed obvious seasonal differences in this study area. Yao et al. (2017) studied the temporal trends of urban heat islands and their related determinants in major cities in China and found that the intensity and area of heat island effects in most cities in urbanized areas increased significantly in summer. The correlation analysis shows that the decrease in vegetation leads to an increase in the intensity of the summer day and night heat island effect in urbanized areas.
Niu et al. (2022) measured the spatiotemporal characteristics of land use transition in the Yangtze River Delta region from 1990 to 2018 by geographic information mapping method and explored the driving mechanism of land use transformation under the background of urban-rural transformation and development by using spatial regression analysis. The results show that land use transition in the transformation and development of urban and rural areas in the Yangtze River Delta region is the two main types of transition from arable land and bare land to urban construction land and rural residential land to urban construction land in the Yangtze River Delta. From the results of the spatial and temporal distribution characteristics of land cover and land circulation in the study area, it can be seen that the urban land in the study area has been built rapidly in recent years, and the scale of land use has been expanding, mainly from agricultural land and bare land. The consistency of the results indicates the accuracy and reliability of the experimental results of this study. In addition, from 2005 to 2018, the frequency of mutual conversion of various land use types in the Hangzhou metropolitan area was high, but the temperature change trend of each land use type showed the same pattern during the same period, and the surface temperature was the highest in urban built-up areas. The results show that different land use types have different impacts on the urban heat island effect. Among them, urban land use is still the main factor affecting the formation of the urban heat island effect. P. Du et al. (2022) studied the dynamic expansion of urban land use in China’s coastal areas since 2000 and found that the urbanization of China’s coastal areas was relatively rapid from 2000 to 2020, and the average annual growth rate of new urban land use was 17,979.72 km2 and 4.83%. By studying the changes in urban construction land in Hangzhou Metropolitan Area from 2005 to 2018, this paper shows that the growth rate of urban construction land exceeds 53%, which is more accurate, and has valuable reference suggestions for urban development trends and planning in future research areas. At the same time, reflecting the urban heat island effect, Peng et al. (2018) studied and compared the temporal and spatial changes in surface temperature in 285 cities in China. It is found that from 2001 to 2010, most urban nighttime LST increased faster than rural areas, and the difference between urban and rural LST showed an increasing trend. The difference in the change rate of urban and rural LST between 68.0% of cities in winter and 70.8% of cities in summer was concentrated in the range of 0 to 0.1°C/year. The results of this paper show that the annual minimum temperature of LST in the Hangzhou metropolitan area increases by 0.5°C and the maximum temperature by 0.7°C, which has a more obvious numerical change, reflecting the influence of the urban heat island effect on surface temperature. At the same time, there was a significant negative correlation between NDVI and LST. Yao et al. (2019) studied the relationship between greening in rural areas and the intensity of urban surface heat islands, emphasizing that the impact of greening in rural areas is an important and extensive driver of the increase in the intensity of the diurnal heat island effect. The increase in the intensity of the heat island effect is mainly due to anthropogenic heat emissions and an increase in building area, as well as a decrease in vegetation in urban areas. This shows that the urban heat island effect can be effectively alleviated by protecting and increasing the area of urban green space and rationally planning urban layout. Therefore, given the development status and planning of the Hangzhou Metropolitan Area, the following suggestions are put forward to alleviate the heat island effect of the Hangzhou Metropolitan Area.
(1) Protect and increase the area of urbanized green space
Vegetation cover plays a key role in mitigating the urban heat island effect, and urban green spaces play an extremely important role in balancing urban heat, reducing urban temperature or increasing humidity. Odindi et al. (2015) used MODIS surface temperature (LST) and Landsat 8 data to assess the value of urban green spaces in multi-seasonal urban heat mitigation and found that urban green spaces have good operations for balancing urban heat; M. Huang et al. (2018) studied a group of urban green spaces in part or the whole city based on an assessment sample approach, conducted mainly through remote sensing and satellite maps. The results showed that the distance and intensity of the cooling effect were highest in large urban parks of more than 10 ha; Zhang et al. (2014) applied an empirical model to estimate the energy saving and emission reduction contribution of urban green spaces in Beijing, found that urban green spaces play an important role in reducing energy demand and increasing CO kJ of heat through evaporation. H. Du et al. (2021) conducted microclimate field measurements on 35 gas storage reservoirs in Shanghai, China, and investigated the effect of urban green space on temperature through data collection and statistical analysis, eventually found that the shape of the urban green space had a significant effect on the temperature and humidity index (THI). Kuang (2020) measured air temperature and relative humidity at 2 m height on the roofs of the Beijing Olympic Park and nearby buildings for more than 1 year. The results indicate that the cooling and humidifying effects of urban parks are an important component of urban ecosystems. Therefore, reasonable protection and an increase of urban green areas play an important role in mitigating the urban heat island effect.
(2) Rational planning of urban layout
The intensity of the urban heat island effect is also directly related to the density of urban buildings. The higher the density of the urban building layout, the stronger the inter-urban heat reflection and the higher the heat island intensity (Li, Schubert et al., 2020). Also, different land cover types have different effects on solar radiation, with land cover types such as green areas reflecting solar radiation less (Stroppiana et al., 2014). Therefore, there is a need to diversify land cover types, reduce urban building density and enhance urban self-regulation when laying out the city.
Taking Hangzhou Metropolitan Area as an example, this study comprehensively studies the dynamic changes of the heat island effect on the temporal and spatial scale, which is of great significance for alleviating the urban heat island effect and urban future planning and construction, but there are still certain limitations. While there is an association between changes in surface temperature and changes in land use patterns and the heat island effect, this does not mean that there is a causal relationship between them. Other factors such as air pollutants, building characteristics, population density, etc. may also have an impact on the heat island effect, Fuladlu and Altan (2021) studied land surface temperature and its relationship with major air pollutants and proved that CO and O2 positively correlated with LST, and PM2.5, SO2, NO2 were negatively correlated with altitude. These factors may not have been considered in this study, and more diverse influencing factor data should be studied in the future. Secondly, the data on land surface temperature and land use type change usually have a certain spatial resolution, but at the urban scale, it may not be possible to capture details due to microscale changes within the city. Yao et al. (2023) first developed a global seamless (no missing values) and high-resolution (30-arcsecond spatial resolution) temperature (Ts and Ta) dataset (GSHTD) from 2001 to 2020. Therefore, future research will use the GSHTD dataset to further improve the precision and accuracy of the data. Among other things, Yao et al. (2021) propose a gap-filling method called the Enhanced Hybrid (EH) method, comparing the accuracy of the EH method with the accuracy of three other gap filling methods that use only spatiotemporal information: remote sensing solar land surface temperature reconstruction (RSDAST), mean anomalous interpolation (IMAs), and gap filling. The results show that the correlation between the four LST products is strong, indicating that the accuracy of gap filling can be improved by using the information from other products. This has great implications for the improvement of experimental methods in the future.
Conclusion
(1) According to the results of land use interpretation, urban land in the study area has been expanding rapidly in recent years. During the period from 2005 to 2018, the rate of expansion of urban land area in the study area reached 53.79%. In terms of the inherent land area of the study area, the study area expands the urban land area to meet urban demand by developing unused land, that is, bare land, and reducing the area of evergreen forest land cover types. This may be related to the rapid economic development of the study area, which in 2017 accounted for more than 20% of the gross product compared to the gross product of the Yangtze River Delta. At the same time, the rapid economic development attracts a large influx of people. In Hangzhou, for example, the net inflow of population exceeded 280,000 in 2017 and 330,000 in 2018 (Pan & Lai, 2019). The influx of large numbers of people creates urban pressure and requires more urban land to relieve urban pressure.
(2) From the LST inversion results, the overall temperature in the study area gradually increases from northwest to southeast, which is significantly related to the land use and vegetation cover in the study area. The correlation analysis between LST and land use and normalized vegetation index shows that there is a significant relationship between LST and land use. Unnatural land cover types such as urban sites contribute significantly to regional temperature increases, and urban sites remain the center of the urban heat island effect. At the same time, there was a significant negative correlation between LST and NDVI. Mao et al. (2016) used the normalized vegetation index (NDVI) and the modified normalized impervious surface index (MNDISI) to determine the linear relationship between the surface temperature (LST) distribution and these remote sensing indices at different spatial resolutions. The results showed that LST established a moderate to strong negative correlation with NDVI at various spatial resolutions (30–960 m). By studying remotely sensed infrared spectra, Kikon et al. (2016) indicated that LST is comparable to NDVI, providing valuable results for the study area.
(3) At the same time, the expansion of urban construction land has an exacerbating effect on the elevation of the urban heat island effect. The growth rate of urban built-up land between 2005 and 2018 exceeds 53%, which is reflected in terms of the urban heat island effect, with an increase of 0.5°C in the minimum annual LST and 0.7°C in the maximum temperature in the study area between 2005 and 2018. Also in the study area LST seasonal variation intensifies the summer temperature. The distribution of urban land use in the study area and the distribution of high LST temperature zones in the study area have similarities.
(4) Also land use type changes affect surface temperature. Among them, the transfer of forest land, grassland, water and unused land as well as the transfer of cultivated land and construction land will have a positive effect on the mitigation of the heat island effect in the study area; The transfer out of the forest, grassland, water, and unused land and the transfer in of cropland and construction land can hurt the mitigation of the heat island effect in the study area. A significant shift in land use types such as agricultural land and forest land (evergreen and deciduous forest) to urban land use from 2005 to 2018. The large transfer out of forest land and the large transfer in of urban land are both detrimental to the mitigation of the heat island effect in the Hangzhou metropolitan area. At the same time, the large reduction in vegetation cover hurts soil and water conservation (Gu et al., 2013), soil fertility (Lukina et al., 2011), plant growth (Kunwar et al., 2020), biodiversity (Martin et al., 2021), and ecological balance (Fang et al., 2022), leading to a decrease in the quality of the ecological environment in the study area.
Footnotes
Author Contributions
Conceptualization, Wenfeng Zheng,Lirong Yin and Xuan Liu.; methodology, Kailin Shang and Zhengtong Yin.; software, Zhixin Liu and Xiaolu Li.; formal analysis, Linfeng Xu, and and Xiaolu Li.; data curation, Linfeng Xu and Kailin Shang; writing—original draft preparation, Kailin Shang, Zhixin Liu and Wenfeng Zheng; writing—review and editing, Lirong Yin, Zhixin Liu, and Wenfeng Zheng; funding acquisition, Zhixin Liu and Wenfeng Zheng. All authors have read and agreed to the published version of the manuscript.
Declaration of Conflicting Interests
The author(s) declared no potential conflicts of interest with respect to the research, authorship, and/or publication of this article.
Funding
The author(s) disclosed receipt of the following financial support for the research, authorship, and/or publication of this article: Supported by the Sichuan Science and Technology Program (2021YFQ0003, 2023YFSY0026, 2023YFH0004); Zhejiang Xinmiao Talents Program (2022R432A009, 2023R465008).
Data Availability Statement
The data are published open-source data available at https://earthexplorer.usgs.gov/; https://earthexplorer.usgs.gov/; http://webgis.de-phut.go.id:8080/kemenhut/in-dex.php/id/fitur/unduhan; https://earthexplorer.usgs.gov/; ![]() (accessed on 15 September 2022).
(accessed on 15 September 2022).