
Abstract
The comparative advantage theory perspective has been extended to the public innovation and trade openness of OECD and Non-OECD countries by focusing on the role of tariff and asymmetric effect of trade openness by comparing imports and exports growth with the causal relationship among the respective factors. The study’s findings indicate that trade openness, innovation, and tariffs are linked in developing countries more than in developed countries due to the difference in economic perspectives and policies, which disprove the idea of the tariff being ineffective for developed nations. The causality effectiveness in developed and underdeveloped countries has resulted among public innovation toward openness of trade and tariff but not in case of tariff to trade openness. Additionally, the results hold up to sub-indicators and measures of public innovation, evaluating that input sub-index is more impactful than output sub-index, and both are even stronger in developing countries than developed countries. Finally, this study implied the usefulness of monetary policy to encourage the governments to lower import tariffs, paved the way to increased investment in research and development and collaboration between foundations, businesses, and academia.
Introduction
It’s generally agreed that progressive thinking is good for economies. Our definition of innovation is the practical implementation of novel concepts. Hence, innovation includes both the creation of new ideas and the adoption of those ideas (Duggan, 1996). More creative nations also tend to have higher GDP per person (Cheung, 2014). To be totally transparent, there is a link between the Global Innovation Index and per capita income of 0.7 and 0.8. Nevertheless, how a country can encourage growth in its businesses is a mystery. It is still debatable what mix of public policies is best for boosting development.
In the same way that liberalizing trade policies improves access to new markets overseas, it also increases the amount of competition that exists within the domestic market. Both approaches are likely to have an effect, over the course of time, not only on the rate of technological advancement inside the economy but also on the rate of overall economic expansion. Unless the uncertainty is resolved or business conditions improve, corporations may be able to make a profit by postponing investment. As the initial outlay for the investment has already been made, this is the case. There has been much research into this theoretical process (Grossman & Helpman, 1989), and recent empirical literature (Dotta & Munyo, 2019; Pan et al., 2019), reveals that businesses’ investment behavior is compatible with this fundamental mechanism. The majority of empirical studies, however, have concentrated on employment, physical capital, and productivity or on specific economic sectors, paying little attention to investments in innovation or innovation across economic sectors. This is due to the fact that empirical research has been predominately performed in the United States.
The economic landscape is rapidly changing, and public policies regarding innovation are ambiguous, making it unclear what a country can do to foster business innovation. It is widely acknowledged that innovation benefits economies and that it necessitates both the generation and application of new ideas (Duggan, 1996). Public innovation and its credibility are inextricably linked to public policies relating to trade openness, including concentrated trade barriers and tariffs on imports and exports. Due to the literature’s emphasis on exporting, it has been challenging to demonstrate how international trade participation affects enterprise performance. As, the Melitz model with heterogeneous firms and randomly assigned productivities cannot account for why some firms begin “better,” enabling them to export (Melitz, 2003). 1 Amiti et al. (2017) investigate the effects of import liberalization on Indonesian plant productivity, focusing on the effects of increased import competition and cheaper intermediate inputs. Indeed, while trade’s beneficial learning effects may benefit only small and partially medium-sized businesses, they may have a tenfold effect on firm productivity improvements by increasing import competitiveness (Altomonte & Bekes, 2009; Damijan et al., 2003).
The macroeconomic policy was examined by focusing on trade openness and innovation as primary variables and adjusting for reverse causality using the geographical proximity index as an instrumental variable (Dotta & Munyo, 2019; Pan et al., 2019). Importing and exporting may have aided businesses in developing new manufacturing processes or products, thereby affecting long-term productivity growth and company survival. The structure and attributes of a firm’s products and the organization of its manufacturing processes should be examined to ascertain the effect of trade on productivity growth (Aw-Roberts et al., 2005). Srholec (2007) demonstrated that the high-tech export specialization does not correlate with indigenous technological capacity. According to an analysis of intra-product imports, most high-tech exports are the result of the fragmentation of the global electronic manufacturing system on trade statistics. While domestic technological capabilities are associated with electronic export performance, the proclivity for electronic component imports accounts for the vast majority of cross-country differences.
Few studies have examined whether financial development and trade liberalization foster creativity and discovered a statistically significant relationship between trade openness and financial development, with the relationship being different for developed and developing economies (Hsu et al., 2014; Jedidia, 2015; Nasreen & Anwar, 2020; Rivera-Batiz & Romer, 1991). Trade openness promotes financial development in developed countries but has the opposite effect in developing countries. Numerous studies, such as Bas et al. (2016), Böhringer et al. (2014), Eisen (2013) have identified trade openness as a critical determinant of innovation and demonstrated that trade openness promotes innovation in their Observatory empirical studies and theoretical models of intensified market competition. Additionally, endogenous models shed light on technological innovation fueled by imports or exports.
Endogenous models shed light on technological innovations fueled by imports and exports. Trade liberalization has accelerated growth, aided by increased competition and technological advancement (Grossman & Helpman, 1989). Additionally, free trade has varying effects on GDP growth and technological innovation in less developed countries (LDCs) and developed countries (DCs). A comparison of LDCs and DCs was conducted to determine whether their rates of technological advancement and GDP growth are less than or equal to those enjoyed during autarky. The LDCs suffer dynamic trade losses, whereas the DCs benefit from dynamic trade gains (Young, 1991). Neoclassical models incorporate endogenous growth in open economies and assert that trade liberalization advances knowledge collection, promoting economic growth in all economies (Ben-David & Loewy, 2000, 2003; Ma et al., 2022). Imports of advanced technology and intermediate goods enabled developing countries to benefit from industrialized countries’ economic growth. Imports provided them with access to advanced technology and intermediate goods (Mtar & Belazreg, 2023; Sakellaris & Spilimbergo, 2000).
The preceding work provides the rationale for making this paper’s following contribution. First, this study elucidates the causal relationship between trade openness, innovation, and tariffs (Instrumental Variable). Second, the robustness effect toward public innovation input sub-index and public innovation output sub-index in response to trade openness has been extended. Third, the asymmetric effects of openness were examined by comparing import and export growth to acquire high-tech equipment for developed and developing countries. Because different tools with different scenarios have varying effects, the extent to which imports and exports affect high-tech innovation in business is unknown. Finally, this work estimates both developed and developing economies separately to ensure comparability because estimating all countries in a single model benefits emerging economies.
The rest of the paper is divided into the following sections. Section 2 will discuss the literature review and hypothesis generation processes that assisted the authors in developing an empirical analysis. Section 3 discusses the study’s methodology, while Section 4 contains the findings and discussion of the study. The conclusions are discussed in Section 5, while policy implications, limitations, and future research directions elaborated in Section 6.
Literature Review and Hypothesis Development
In recent years, the significance of trade openness has increased, fostering specialization. Therefore, countries specialize in exporting goods and services, whilst others without such advantages import from them and specialize in other commodities and services; hence, resources are allocated more efficiently. Comparative advantage theory 2 ascribed the causes and benefits of international trade to differences in the relative opportunity costs of producing similar commodities across countries and deduced the relationship between innovation and trade policy in a globalized society (Curley & Salmelin, 2018).
Trade Openness and Public Innovation 3
The formation of possibilities, such as free trade agreements, is facilitated by a country’s degree of trade openness, which also leads to an increase in foreign direct investment. Countries that are more receptive to international business attract more significant foreign investment, fostering technology transfer, research development, and dynamic manufacturing methods (Büthe & Milner, 2008; MacDermott, 2007; Medvedev, 2012). In addition, the contemporary literature on heterogeneous firms and trade emphasizes the complementarity between increasing overseas market access and investment in productivity-enhancing activities (Atkeson & Burstein, 2010; Costantini & Melitz, 2009; Lileeva & Trefler, 2010). Another study considers the impact of exporting on productivity (Bernard & Jensen, 1999; Clerides et al., 1998; De Loecker, 2007; Van Biesebroeck, 2005). Instead of discussing export status and productivity, this article focuses on investment in trade and public innovation.
The research of public innovation practices in small businesses is still in its infancy. The same scenario was examined by Hinteregger et al. (2019) to ascertain the impact of inbound and connected open innovation on marketing, manufacturing process, and organizational innovation in small and medium enterprises (SMEs). The findings indicate significant disparities between small and medium-sized businesses, with medium-sized firms benefiting more from public innovation in terms of marketing, manufacturing processes, and organizational innovation. Suryanto et al. (2020) examined the impact of trade openness on public innovation, financial performance, and the level of competition in Indonesia’s insurance industries. The threshold regression analysis revealed a detrimental effect on low-premium companies but a beneficial effect on high-premium companies. These findings demonstrate that trade openness of the insurance business on a global scale has had a significant impact on the insurance industry’s development.
Mtar and Belazreg (2021) examined the connections between trade openness and public innovation in OECD nations. The panel vector auto-regressive model findings indicate that the relationship between trade openness and public innovation is neutral, as is the relationship between economic growth and public innovation. They suggested that policymakers should invest more in human capital, including entrepreneurial skills, education, and conditions that nurture economic creativity. These investments strengthen economies’ absorptive capabilities and enhance their capacity for innovation. Mtar and Belazreg (2023) explores the unidirectional relationships between public innovation, trade openness, financial development, and economic growth in 11 European nations using a panel-VAR technique. The findings documented a negative association between public innovation and economic growth. The same outcome was observed to address the relationship between trade openness and economic growth. The report finds that increased regulation of financial institutions and improved funding quality are critical components of economic development. The previously reviewed literature established that the direct effect of trade openness and public innovation has been overlooked for developed and developing countries, which face distinct geographical challenges and pursue distinct policies on innovation and free trade. As a result, the following hypothesis was developed, which will significantly contribute to this study.
Wipo (2014) 4 introduced the input sub-index (ISI) and output sub-index (OSI) as the primary efficiency ratio indicators. Institutions, human capital, infrastructure, market sophistication, and business sophistication comprised ISI, whereas OSI comprised scientifically (knowledge and technology) and creative output. The findings established a direct correlation between the tariff and the inputs and outputs of public innovation. Additionally, Dotta and Munyo (2019) estimated the ISI for trade openness to ascertain the reliability of the findings, as provided by Wipo (2014). The OLS estimate revealed that the coefficient for trade openness is significant; however, the coefficient becomes insignificant when IV estimation is used (GPI as Instrument). The coefficients obtained when the Input Sub-Index is used as a dependent variable are non-significant and significantly smaller than those obtained when the Output Sub-Index is used as a dependent variable.
Previously, Hsu et al. (2014) present more evidence that financial development hinders innovation in companies that are most dependent on external finance and in industries that rely heavily on technological advancement. Utilizing panel data from 74 nations over the period of 1970 to 2010, Ho et al. (2018), in a recent study employing data from 50 nations during the period of 1990 to 2016, demonstrated that countries with a higher level of financial development are related with a relatively low rate of innovation. The data for this analysis came from the period 1990 to 2016. Instrumental variables demonstrate that the results are skewed due to the omitted variable issue. While GPI is a valid IV, there are additional variables that have a direct effect on ISI and OSI that are being overlooked in the current literature. As a result, the current study used the Tariff as the IV with GPI to minimize result bias and pave the way for developing the following hypothesis.
Causal Relationship of Trade Openness With Other Factors (Including Tariff as an Instruments)
Historically, tariffs have resulted in higher prices, reduced employment, and slower economic growth. Generally, elected officials favor free trade and its benefits over erecting trade barriers that harm the economy. Böhringer et al. (2017) investigated the impact of the tariff on public innovation and demonstrate that photovoltaic technology, which has benefited from high feed-in tariffs under the EEG, does not generate creative output. The absence of empirical evidence of beneficial innovation effects, coupled with the high cost of the German EEG, raises concerns about evaluating the German feed-in tariff system solely based on innovation. York (2018) makes a case for the simultaneous impact of tariffs and trade on the United States of America, as well as the role of public policy. He established that public policy has shifted toward free and open trade since 1945, lowering several trade barriers. Additionally, he stated that tariffs and other restrictions prevent specific industries from benefiting from free trade and the competitive forces that accompany it. Finally, he demonstrated that the Trump administration has imposed new tariffs and threatened new trade restrictions rather than focusing on lowering trade barriers. Amidi and Fagheh Majidi (2020) used spatial econometrics to explain the relationship between trade and growth by considering the instrument vector’s geographic proximity. They contended that a country’s financial situation is strongly influenced by its neighbors’ and trading partners’ conduct. This conclusion implies that the geographical location and trading partners of a country have a significant impact on economic growth.
The conclusions that may be drawn from the evidence presented in this literature vary widely depending on the econometric approaches that were applied and the nations that were researched. The findings of the research conducted by Das and Paul (2011), Dollar and Kraay (2004), Frankel and Romer (1999), Hye et al. (2016), Kong et al. (2021), Marelli and Signorelli (2011), Were (2015), and Le (2020) all point to a positive relationship between economic openness and trade. Rahman (2017) discovered that there are correlations between economic growth and trade openness in both rich and developing countries, and that these relationships work in both directions. In contrast, the research conducted by Amadou (2013), Chang et al. (2009), Eriṣ and Ulṣaan (2013), Rodrik et al. (2004) discovered that trade does not have an effect on economic growth in the long run. On the other hand, Ali and Abdullah (2015a), Rigobon and Rodrik (2005), and Rahman et al. (2020) discovered that there is a negative relationship between international trade and economic growth in the long run.
We established that most of the literature focuses on the indirect relationship between public innovation and trade openness, utilizing economic or financial growth as a moderating factor. The neglect of control factors and the primary indicator of free trade or trade barriers, which is the tariff rate, paved the way to design the following hypothesis.
Imports and Exports Shocks on Public Innovation
Positive export shocks in terms of market size and competitiveness resulted in a more significant acceleration of innovation for growing firms. A larger market size increases overall incentives for innovation; however, increased rivalry created by a larger market significantly reduces incentives for innovation in minor productive firms (Aghion et al., 2005). Palangkaraya (2012) ratified the fact that process innovation leads toward export market activity, which results in additional process innovation. Additionally, there is a severe lack of evidence to suggest that current product innovation increases the probability of becoming a “new” exporter in the current era. The effectiveness of innovation on import flows was examined, and it was discovered that innovation had no noticeable effect on aggregated country imports (J. Liu, 2014). He concluded, however, that while innovation in importing countries has no effect on imports in low-technology sectors, innovation in high-technology sectors is extremely dependent on the characteristics of the trading countries. Additionally, he established that imports from countries with superior quality have a detrimental effect.
In addition, the contemporary literature on heterogeneous firms and trade emphasizes the complementarity between increasing overseas market access and investment in productivity-enhancing activities (Atkeson & Burstein, 2010; Costantini & Melitz, 2009; Lileeva & Trefler, 2010). Another study considers the impact of exporting on productivity (Bernard & Jensen, 1999; Clerides et al., 1998; De Loecker, 2007; Yan et al., 2022). Instead of discussing export status and productivity, this article focuses on investment in trade policy and innovation.
Tavassoli (2018) examine the impact of innovation on firms’ export behavior by evaluating the impact of firms’ innovation output and input on their export proclivity and intensity. Additionally, the findings indicated that firms’ innovation output had a positive and significant impact on export intensity. Finally, he stated that innovation has no direct effect on export behavior. When entering export markets, informal competition may be a big issue for enterprises, as they may commit a larger amount of their work to product innovation rather than process innovation. On the other hand, organizations that face a high level of perceived informality may place a greater emphasis on process innovation during learning through technology import (Wang et al., 2020). The previous research has overlooked the asymmetric effects of openness by distinguishing the growth of imports and exports, providing us with justification to develop the following hypothesis.
Research Methodology
Nature and Source of Data
The countries included in this study were chosen using the world intellectual property organization’s (WIPO) Global Innovation index. We initially selected 134 countries but narrowed it down to 127 due to the lack of comprehensive datasets for each selected country. Following that, for comparative purposes, these countries are divided into two categories: 49 developed and 78 underdeveloped. This classification of countries was made using the human development index (HDI) from the World Population Review (2020). From 2009 to 2020, the annual dataset of 127 OECD 5 and non- OECD nations for concern variables has been selected, making it the largest panel dataset in nature. Table 1 contains a detailed description, capacity, source, and expected impact of each variable in order to examine the relationship between a country’s tariff and its willingness to engage in commerce, innovation, and technological advancement.
Data Variables, Capacity, Description, and Expected Impacts.

Note. The data for the variable discussed in this table were derived from the GII annual reports, the WDI, and the CEPII, which are widely regarded as the most authoritative and reliable sources of geographical and economic data globally. The values assigned to respective variables as Global innovation index (GII), input sub-index (ISI), output sub-index (OSI), trade openness (TO), imports (IMP), exports (EXP), tariff rate (TARF), geographical proximity index (GPI), geographical area of countries (AREA), and population (POP).
Econometric Modeling
This section uses empirical modeling to discuss the relationship between innovation, tariffs, and trade openness. In this study, we refer to the global innovation index (GII) 6 as a measure of public innovation (Dotta & Munyo, 2019). To investigate the relationship between progress and government policies that promote trade transparency, we hypothesize that for each country, there is a direct linear relationship between public innovation and trade openness:

We can obtain a first approximation of the effect of trade openness on public innovation by estimating the value of parameter

By combining the Equations 1 and 2, the following equation is obtained.

We obtained the model for each country by further resolving it.

The basic OLS model determines the effect of trade openness, population growth, and public innovation on the outcome coefficient.

The correlation between geographic proximity and country size paved the way to describe the effect of commerce on a country. Therefore, we use each country’s area and population as independent variables, namely that larger countries have less trade openness due to diversions to domestic markets (Frankel & Romer, 1999).
Equations 6 and 7 have been advanced to examine the robustness effect of trade openness on the public innovation input sub-index (ISI) and public innovation output sub-index (OSI). Dotta and Munyo (2019) applied these models using the OLS method and an IV model with GPI as the IV. These models will demonstrate the robust effect of TO on the inputs and outputs of developed and developing country innovation efficiency ratios.


The impact of import-led and export-led innovation is described by separating imports and exports and by estimating Equation 1 using the instrumental variable (IV) method:

Data Estimation Methods
The current study’s estimation method comprises Equations 5 to 8 to ascertain the causal relationship between trade openness and public innovation. The LLC and IPS unit root tests were suitable for determining stationarity when secondary and panel data were available (Ali & Abdullah, 2015; Im et al., 2003; Levin et al., 2002). The variance inflation factor (VIF) has been adopted to examine the multicollinearity in the models (Perez-Melo & Kibria, 2020). Econometrically, when the explained and explanatory variables are stationary at the level in case of panel database, OLS is considered to be a more appropriate and reliable estimator than autoregressive distributed lag (ARDL) 7 or co-integration (Greene, 2003). For the initial analysis of instrument quality, the OLS method was used, which minimizes the sum of the squares of the differences between the observed dependent variable and those predicted by the linear function by choosing the parameters of a linear function of a set of explanatory variables using the principle of least squares (Dotta & Munyo, 2019). Additionally, the IV estimation method was used in this study to account for potential endogeneity, allowing for consistent estimation when explanatory variables are correlated with error terms in a regression model (Dotta & Munyo, 2019; Wright, 1930).
We examine the existence of Granger causality (GC) between explanatory (trade openness & tariff) and dependent variables (global innovation index), using heterogeneous panel data (Granger, 1969, 1980). Our panel causality tests are based on pooling the results of time-series analyses to manipulate the panel nature of the data and allow for cross-sectional variation in coefficients. As part of this broad framework, we employ panel GC tests, which allow for the differentiation of coefficients across test sections (Hanck, 2013; Hurlin, 2004). When considering slopes and intercepts with heterogeneous values, we evaluate the most generic case possible to avoid drawing erroneous generalized inferences across the entire cross-section that may hold only for some nations (Hood et al., 2008).
The following equation represents the empirical estimation, developed as an extension of the GC test when dealing with panel data models with fixed coefficients (Granger, 1969; Venet & Hurlin, 2001).

Although we assume that the parameters
Empirical Results
Descriptive Statistics
Table 2 contains descriptive statistics in terms of mean, median, minimum, maximum, and standard deviation. It is critical to note that the mean value of the global innovation index (GII) as a measure of public innovation is approximately 31.8. The mean value of the public innovation input sub-index (ISI) is greater than the mean value of the public innovation output sub-index (OSI), indicating that the majority of countries prioritize input innovation over output innovation (Wipo, 2014). Additionally, the trade openness (TO) have a high standard deviation, indicating a gap between developed and developing country trade patterns (Q. Liu et al., 2015).
Descriptive Statistics.

Source. Authors estimations and carried out from Stata-16.
Note. This table summarized descriptive statistics for all selected explained and explanatory variables for 127 countries from 2009 to 2020, allowing for 1,524 observations.
Correlation Analysis
Correlation analysis is used to determine the relationship between the dependent and independent variables, as demonstrated in Table 3. The results indicate that the global innovation index (GII) as a measure of public innovation has a 99% positive confidence interval when compared to the trade openness (TO) and a negative confidence interval when compared to tariff. Notably, the trade openness has a significant positive correlation with input sub-index and output sub-index, with coefficient values of .25 and .28, respectively, and a negative correlation with tariff, with a coefficient value of −.41 in the prospect of comparative advantage trade theory (Dotta & Munyo, 2019; Koczan & Plekhanov, 2013). The area and population as a control variable negatively correlate with trade openness with coefficient values of −.62 and −.47, respectively. Additionally, the geographical proximity index (GPI) 8 as an instrumental variable also documented a negatively significant correlation with the trade openness, having a coefficient value of −.15.
Pearson Correlation Matrix.

Source. Authors estimations and carried out from Stata-16.
Note. This table presents the correlation matrix among the dependent, independent, instrumental and control variables. It indicates the direction in which the variables are related. This correlation is among the Global innovation index (GII), input sub-index (ISI), output sub-index (OSI), trade openness (TO), imports (IMP), exports (EXP), tariff rate (TARF), geographical proximity index (GPI), geographical area of countries (AREA), and population (POP).
p < .05. **p < .01. ***p < .001.
Multicollinearity Test
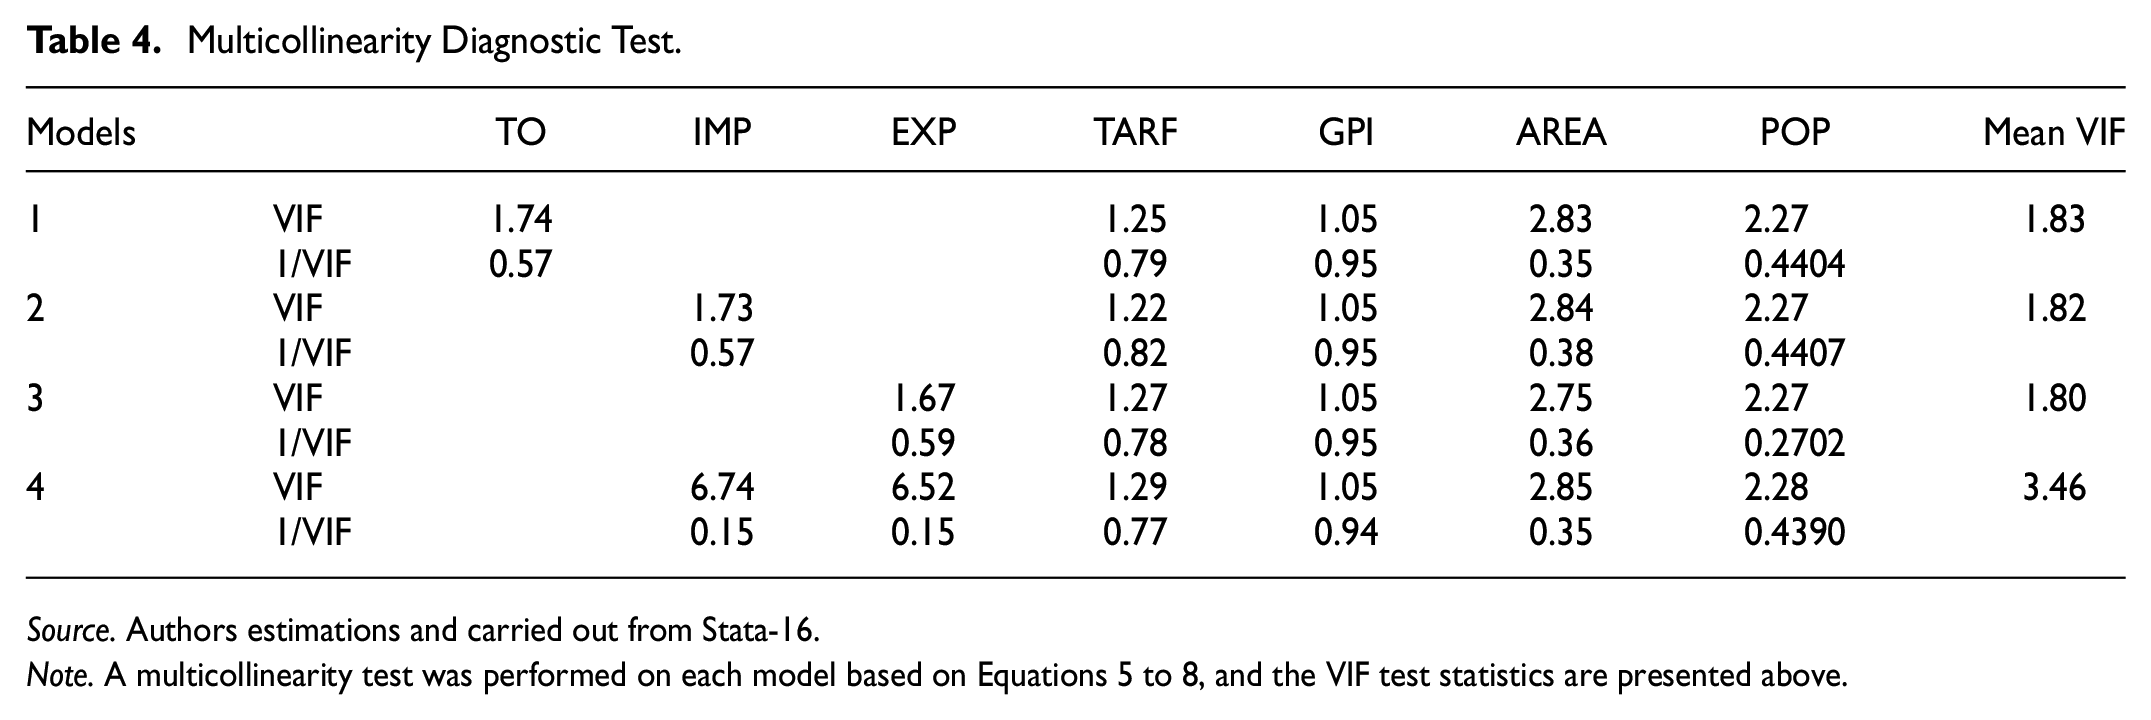
Table 4 employs the variance inflation factor (VIF) test to ascertain the presence of multicollinearity in multivariate models for each explanatory variable. Perez-Melo and Kibria (2020) described the multicollinearity as the absence of correlation between explanatory variables when VIF equals one; nevertheless, when VIF surpasses eight, multicollinearity exists.
Multicollinearity Diagnostic Test.
Source. Authors estimations and carried out from Stata-16.
Note. A multicollinearity test was performed on each model based on Equations 5 to 8, and the VIF test statistics are presented above.
Individual and aggregate findings for the VIF test are reported in Table 4, showing the lack of multicollinearity across all explanatory factors employed in the study. Multicollinearity affects the accuracy of the predicted coefficients, diminishing the regression model’s statistical power; consequently, the lack of collinearity refers to the consistency and reliability of panel regression models.
Unit Root Testing
Table 5 details a unit root test based on Levin et al. (2002), L.L.C, and Im et al. (2003), to ensure that our linear econometric models are stationaries prior to estimation. The findings demonstrated that all factors integrated to order zero paved the way for using an OLS-based estimation model (Greene, 2003).
Unit Root Tests.

Source. Authors estimations and carried out from Stata-16.
Note. We used two-panel unit root tests as L.L.C and I.P.S to confirm the stationarity of the dependent, independent and instrument factors in our models. The test values for Area and GPI are missing because both variables exhibit identical values in their respective cross-sections, preventing the unit root diagnostic test from applying these two variables.
Significance at 1% level.
Significance at 5% level.
Significance at 10% level.
Results and Discussions
Quality of Instruments
The first step in constructing two-stage OLS gages is to ascertain the instrument’s characteristics. First, we evaluate those characteristics and examine the relationship between instrument characteristics and geological proximity. Due to the correlation between a country’s size and its proximity to topographical features, we use geographic zones and populations to isolate and account for missing data for influence and commerce that shifted overseas due to the majority of enterprises in the country concentrating on their home market (Frankel & Romer, 1999).
The findings in Table 6 demonstrate that all instruments are highly significant at 1% for developed and developing countries, with the exception of the GPI, which is significant at 5%. It implies that tariffs are also a legitimate instrument for promoting trade openness and detrimental effects on free trade (Ezell et al., 2013). Trade openness and open competition ensure the efficient use of global resources, resulting in a global output at the cutting edge of global efficiency. Tariffs maintain competition, but they may result in inefficient resource allocation.
Quality of Instruments.

Source. Authors estimations and carried out from Stata-16.
Note. This table summarizes the fundamental regression analysis for the quality of instruments under trade theory using the area of countries (AREA), population of countries (POP), tariff rates (TARF), and geographical proximity index (GPI) on trade openness (TO) for developed, developing and the entire sample of 127 selected economies.
Significance at 1% level.
Significance at 5% level.
Significance at 10% level.
Trade Openness and Public Innovation
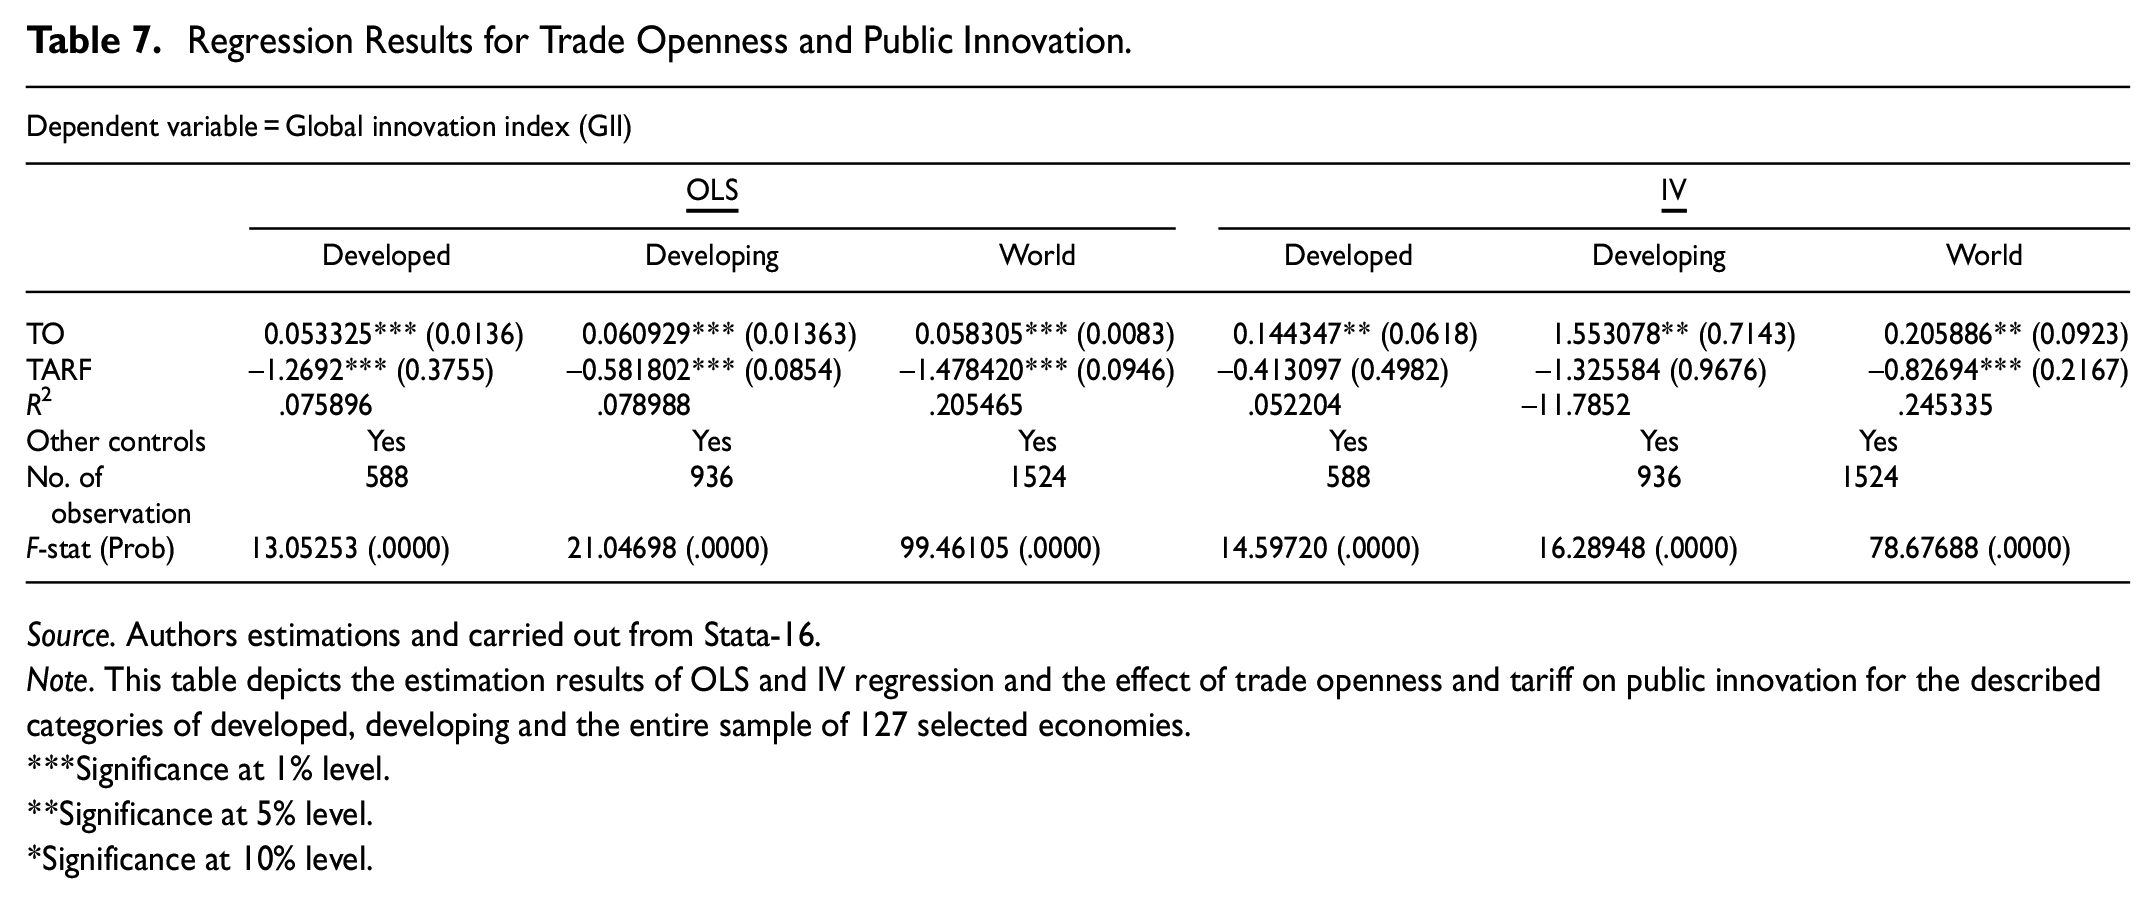
Table 7 summarizes the OLS and IV regression analysis findings of the relationship between trade openness (TO) and the global innovation index (GII) as a proxy for public innovation. In the case of IV regression, the tariff, country area, and population were used as instruments. Public innovation has a significant positive correlation with trade openness and negatively significant with tariff in the case of OLS estimation, indicating that there is a difference in the volume of public innovation affecting developed and developing countries (Eisen, 2013; Waldron & Zhang, 2021). The volume has been the opposite in IV regression after including the tariff and GPI as the IV. According to Ricardian trade theory, developing countries affect more than developed nations by imposing trade barriers (Jones, 2017).
Regression Results for Trade Openness and Public Innovation.
Source. Authors estimations and carried out from Stata-16.
Note. This table depicts the estimation results of OLS and IV regression and the effect of trade openness and tariff on public innovation for the described categories of developed, developing and the entire sample of 127 selected economies.
Significance at 1% level.
Significance at 5% level.
Significance at 10% level.
The effect is magnified when a country’s level of public innovation increases due to increased trade openness, particularly in the case of emerging economies. The findings indicated that developing countries that rely heavily on foreign inventions and have a limited capacity for innovation benefit the most from introducing innovative products (Soubbotina, 2004). Apart from determination, a country’s size, whether the geographical region or population, has a significant but unstimulating effect on its level of innovation. This result conveys an air of intuitiveness, which is consistent with (Fischer-Kowalski et al., 2014). Additionally, the findings indicated that specific technological innovations, products, and techniques are incompatible with low-density environments.
Public Innovation Input Sub-index (ISI) and Output Sub-index (OSI)
Tables 8 and 9 depicts the estimation results of OLS and IV regression and the effect of trade openness and tariff on the public innovation input sub-index (ISI) and output sub-index (OSI) for the developed, developing and the entire sample of 127 selected economies. The trade openness (TO) have been estimated for both ISI and OSI to examine their impact, following the theoretical framework. Both OLS and IV regression results indicate a positive and significant impact of trade openness on the input and output sub-indexes at the 1% significance level. The findings revealed that trade openness has a more significant effect on technological innovation when we only consider the developing economies (Dotta & Munyo, 2019).
Regression Results for Trade Openness and Public Innovation Input Sub-Index (ISI).

Source. Authors estimations and carried out from Stata-16.
Note. This table depicts the estimation results of OLS and IV regression and the effect of trade openness and tariff on the public innovation input sub-index (ISI) for the described categories of developed, developing and the entire sample of 127 selected economies. The ISI comprises institutions, human capital, infrastructure, market sophistication, and business sophistication.
Significance at 1% level.
Significance at 5% level.
Significance at 10% level.
Regression Results for Trade Openness and Public Innovation Output Sub-Index (OSI).

Source. Authors estimations and carried out from Stata-16.
Note. This table depicts the estimation results of OLS and IV regression and the effect of trade openness and tariff on the public innovation output sub-index (OSI) for the described categories of developed, developing and the entire sample of 127 selected economies. The OSI comprises scientifically (knowledge and technology) and creative output.
Significance at 1% level.
Significance at 5% level.
Significance at 10% level.
An essential consideration while estimating any sub-indexes is determining the situation in which any sub-index becomes more robust. We changed the input sub-index to assess the robustness of these findings in the presence of trade openness. The rate at which developing countries accept, adapt to, and successfully use current technology dictates the pace of technological development in most of these countries. The same results are shown in Tables 8 and 9, indicating that the input sub-index is more widely accepted than the output sub-index for accelerating innovation.
Heterogeneous Effect of Imports and Exports on Public Innovation
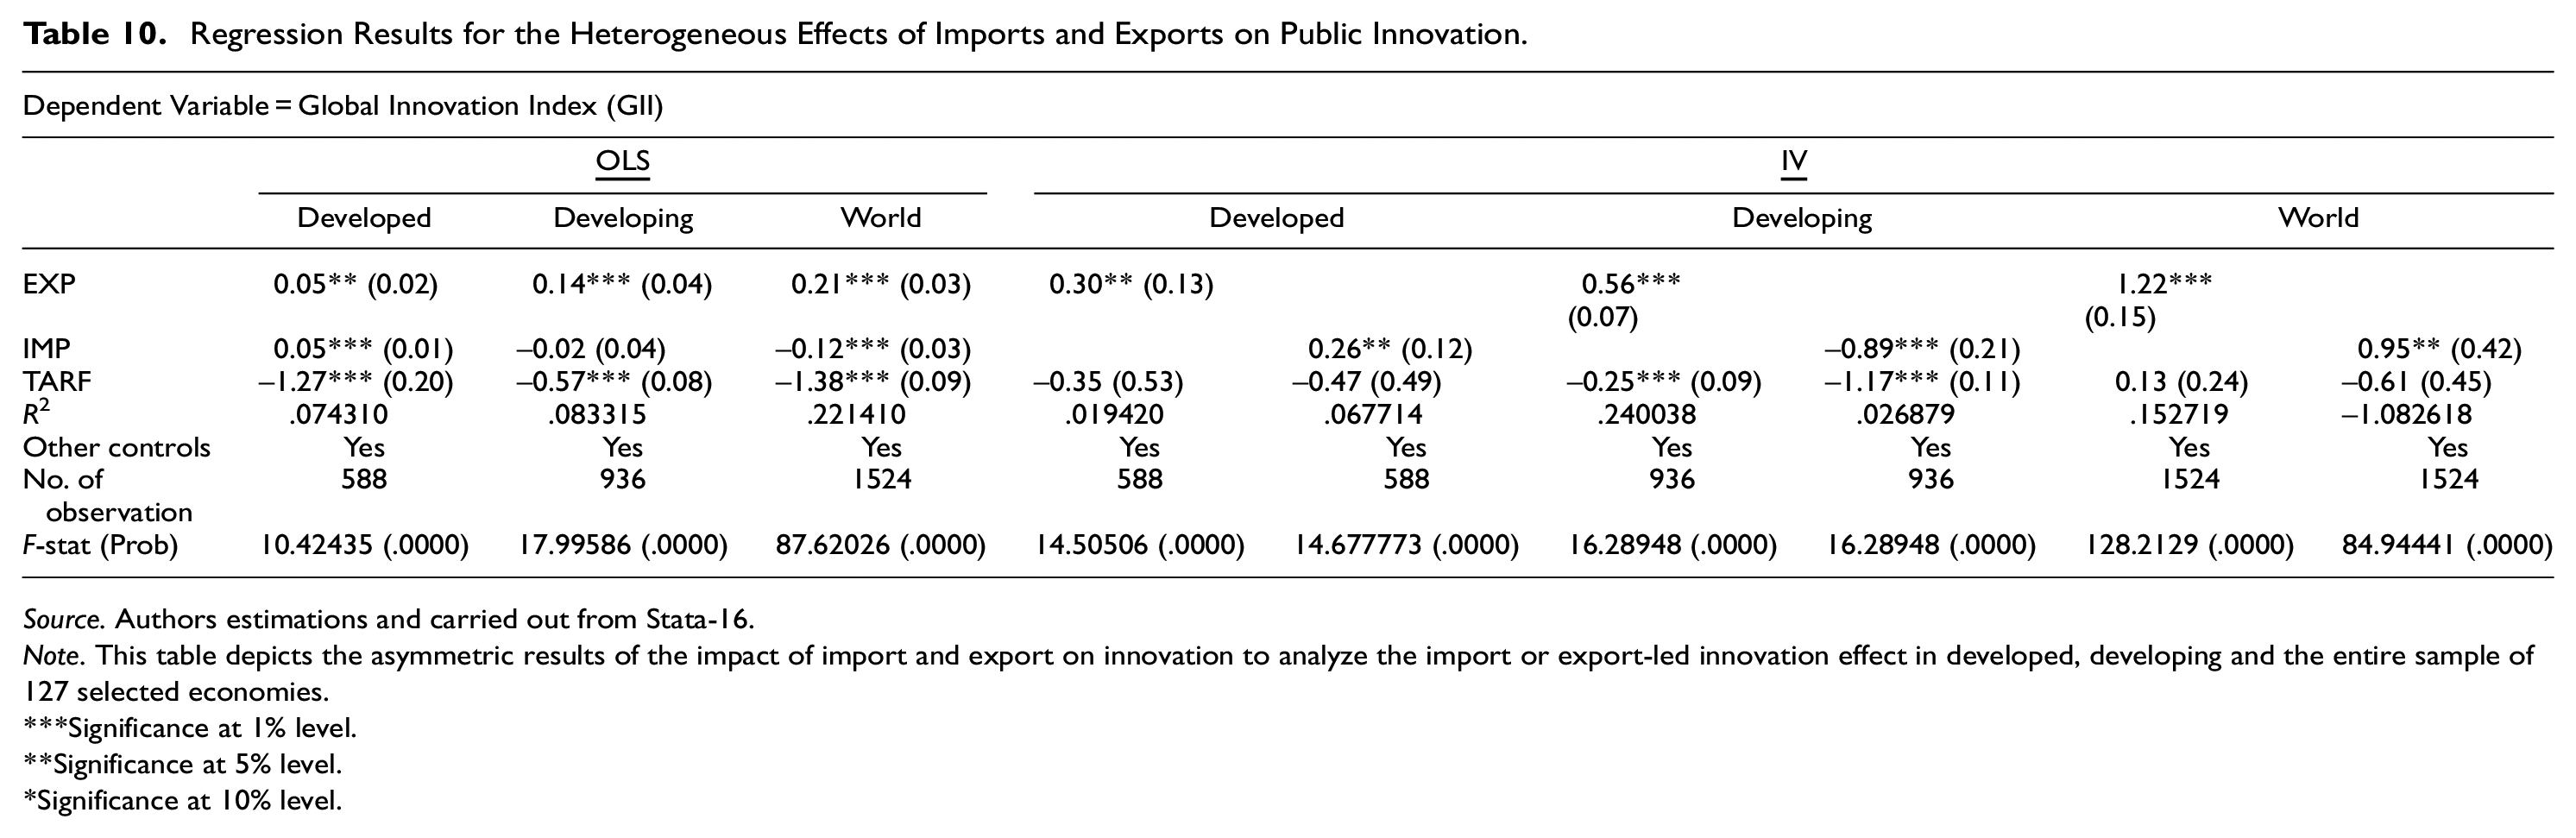
The difference between economies that innovate through exports and those that innovate through imports is illustrated in Table 10. The results for the major regressor variables are significant when both OLS and IV techniques are used. Additionally, the results are identical to those discussed by (Boddin, 2018). This effect results from the positive correlation between import exposure and innovation, but not of export exposure. Surprisingly, the findings vary according to the source of exposure (Q. Liu et al., 2015; Panta et al., 2022). Compared to imports, the findings indicate that exports have a beneficial effect on innovation. Additionally, the effects of exports and imports are more pronounced in the IV specification than in the previous model. As a result, tariffs are critical for regulating imports and exports and the growth of inventions in emerging economies (Perusic & Zhang, 2019; Song et al., 2022). Additionally, the findings indicated that the relationship between importing and exporting activities and innovation outcomes could be more precisely explained by examining the destinations of imports and exports, which act as significant moderators when examining the relationship between imports and their effects on developing countries. As a result, exporting firms in wealthy countries that can expand their innovative capacity while importing firms in developing countries that cannot do so may benefit from this fact.
Regression Results for the Heterogeneous Effects of Imports and Exports on Public Innovation.
Source. Authors estimations and carried out from Stata-16.
Note. This table depicts the asymmetric results of the impact of import and export on innovation to analyze the import or export-led innovation effect in developed, developing and the entire sample of 127 selected economies.
Significance at 1% level.
Significance at 5% level.
Significance at 10% level.
Relationship of Causality
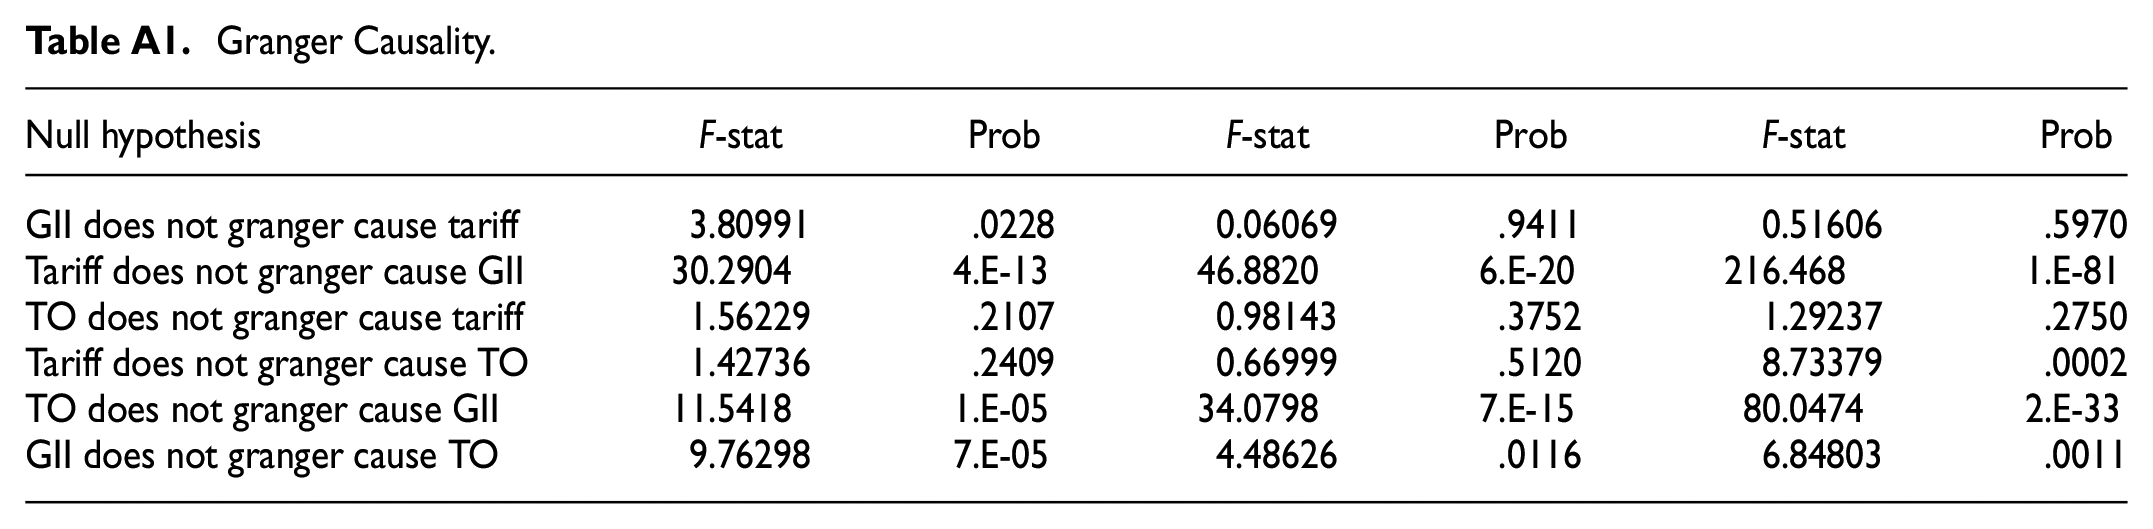
Table 11 explains the causal relationship among the global innovation index (GII) as a proxy of public innovation, trade openness (TO), and tariff (TARF). The causality test for panel data was expanded to account for causal homogeneity across panels when dealing with panel data models with fixed coefficients (Granger, 1969; Venet & Hurlin, 2001). There is no causal relationship between trade openness and tariffs in both developed and developing countries, having an F-stat of 1.5622 and 0.9814, respectively; nonetheless, tariffs have a unidirectional causal effect on trade openness in all countries regardless of wealth, having a value of 8.7337.
Results for Causality Relationship.

Note. This table explains the causal relationship among the global innovation index (GII) as a proxy of public innovation, trade openness (TO), and tariff (TARF). Hurlin (2004) and Granger (1969) suggested to develop an extension of the causality test while dealing with panel data models with fixed coefficients.
For developed countries, innovation is bidirectional concerning tariffs and trade openness, whereas it is unidirectional for developing and global economies (Belazreg & Mtar, 2020; Johnson & Van Wagoner, 2014). As a result, we concluded that tariffs are critical for technological advancement and virtually all countries’ imports and exports. For developed nations, bidirectional causation holds, like most developed nations, export innovation while developing nations import it (Damijan et al., 2010).
Conclusions
Openness to trade and public innovation were both examined in this study. Trade openness policies have been shown to benefit countries’ innovation levels when geographical proximity and tariffs are used as instrumental variables. Compared to developed countries, developing countries are disproportionately affected by trade openness. To promote public innovation, it appears as though opening the economy to foreign trade is the obvious solution, which does not disprove our hypothesis of a significant effect of trade openness on public innovation in international trade under the valuation of comparative advantage theory. The capacity of emerging economies to adopt, adapt to, and efficiently exploit new technology determines their rate of technological growth, which can be attributed to a country’s ability to attract investment via qualified individuals and a favorable business climate.
As the two fundamental pillars of public innovation, input and output sub-indexes also consider how much innovation output a given country receives for its inputs in developed and developing countries. The findings indicate that free trade or the removal of trade barriers positively affects the input and output sub-indexes of public innovation. Additionally, we concluded that the volume of input sub-index is greater than the volume of output sub-index, followed by trade openness, indicating that input innovation is more focused than output innovation, paving the way for acceptance of our hypothesis.
Additionally, the asymmetric effect of import and export on public innovation was examined in this study. The findings indicate that imports and exports have a significant and positive effect on public innovation, except for exports to developing countries, which have a negative effect. This is due to diverse geographical and economic circumstances and the influence of government policies that are either focused on technology development or on meeting national needs and economic growth. These findings support our hypothesis that trade openness has a significant asymmetric effect on imports and exports. Finally, we established a causal relationship between trade openness and public innovation, but not between trade openness and tariffs, thereby strengthening the theoretical concept of free trade.
Practical Implications, Limitations, and Future Study Directions
Practical Implications
It is critical that monetary policies emphasize innovation rather than merely limiting it. A well-coordinated and transparent structure that includes all nations is sought to implement these objectives. Governments should lower import tariffs to encourage increased investment in research and development (R&D) and collaboration between foundations, businesses, and academia. Population growth is a significant driver of economic growth in developing countries, and governments must invest more in entrepreneurial skill development and the creation of a creative environment conducive to the blooming of new ideas.
Limitations and Future Study Directions
Concerning the limitation, this study focused exclusively on public innovations, analyzing 127 countries from 2009 to 2020. As a result, this study is limited in scope and sample size to public based innovations. The authors suggest that prospective researchers conduct relevant studies on another sector’s innovation with an updated period or by selecting all sectors in a single country and investigating the cross-sectional impact on innovation in that country.
Footnotes
Appendix A: Granger Causality
Granger Causality.
| Null hypothesis | F-stat | Prob | F-stat | Prob | F-stat | Prob |
|---|---|---|---|---|---|---|
| GII does not granger cause tariff | 3.80991 | .0228 | 0.06069 | .9411 | 0.51606 | .5970 |
| Tariff does not granger cause GII | 30.2904 | 4.E-13 | 46.8820 | 6.E-20 | 216.468 | 1.E-81 |
| TO does not granger cause tariff | 1.56229 | .2107 | 0.98143 | .3752 | 1.29237 | .2750 |
| Tariff does not granger cause TO | 1.42736 | .2409 | 0.66999 | .5120 | 8.73379 | .0002 |
| TO does not granger cause GII | 11.5418 | 1.E-05 | 34.0798 | 7.E-15 | 80.0474 | 2.E-33 |
| GII does not granger cause TO | 9.76298 | 7.E-05 | 4.48626 | .0116 | 6.84803 | .0011 |
Acknowledgements
We thank all editorial board members and anonymous reviewers for reviewing and improving the paper through their valuable suggestions.
Authors Contributions
Declaration of Conflicting Interests
The author(s) declared no potential conflicts of interest with respect to the research, authorship, and/or publication of this article.
Funding
The author(s) received no financial support for the research, authorship, and/or publication of this article.
Ethics Statement
This material is the authors’ original work, which has not been previously published elsewhere. The paper is not currently being considered for publication elsewhere.
Availability of Data and Material
The datasets used and/or analyzed during the current study have been taken from the databases (WIPO, WDI, and CEPII), and made available from the corresponding author on reasonable request.