
Abstract
This study assesses the moderating role of institutions in the trade openness and inclusive growth nexus in Sub-Saharan Africa (SSA). Based on the System General Method of Moment estimation technique applied to data from 39 SSA countries from 1996 to 2017, the results offer support for the assertion that institutions strengthen the positive relationship between trade openness and inclusive growth in SSA. Economies in SSA should put in policies to strengthen their institutions to improve the positive link between trade openness and inclusive growth.
Introduction
Global effort toward reducing poverty is thwarted by its outcome in Sub-Saharan Africa (SSA). Even though the World has made significant progress in reducing poverty levels from 36% (1990) to 10% (2015), SSA has retrogressed. A greater portion of the poor people in the world live in this region and the projection for 2030 is alarming. According to the World Bank (2019), if the current situation persists, about 90% of the extremely poor population around the universe will be living in this region. Income disparity, on the other hand, has risen globally in recent decades. According to Dollar and Kraay (2002), growth is beneficial to the poor (see also Dollar et al., 2013; Hadhek & Mrad, 2015). Subsequent studies have shown that not all growth benefits the poor especially when there is income inequality, low employment generation for the youth and women, and pursuant of growth in sectors that have weak linkages with the general economy. Ngepah (2017) further contends that economic expansion has not resulted in poverty alleviation in SSA. Probably, the way to reaping the optimal benefits of growth for a continent bedeviled with poverty is to pursue inclusive growth, which will ensure the simultaneous benefits of poverty reduction, job creation, youth and women’s employment and development, and equitable wealth distribution, if SSA wants to end poverty by 2030 (Ortiz & Cummins, 2011).
The concept of inclusive growth is operationally hard to define (Ramos et al., 2013), but its potential to assist in ending poverty in all its forms everywhere and promoting social welfare justifies its recent attention. The OECD (2014, p. 80) explained “Inclusive growth is economic growth that creates opportunity for all segments of the population and distributes the dividends of increased prosperity, both in monetary and non-monetary terms, fairly across society.” At the heart of inclusive growth is growth for all. Unfortunately, however, the World Economic Forum (WEF, 2018) identified SSA as the region with the worst growth for all. Doumbia (2019) argues that additions to inclusive growth could be conditioned primarily on financial innovation, quality institutions, low inflation, liberalized trade, and foreign direct investments but the WEF (2018) opines that for SSA countries, emphasis should be on trade openness. Trade could improve economic growth and inequality concurrently depending on what is exported. The extent of the complexity of export (an indicator of economic complexity) could influence the degree of inequality in an economy because economic complexity reflects economic development (Hartman et al., 2017). So, even though trade could propel inclusive growth, it could also damage it through the export-inequality relationship channel.
The inconclusive relationship between trade and economic growth is reflected in the trade and inclusive growth nexus. Free trade opponents doubt trade as a driver of inclusive growth. They argue that trade poses a threat to domestic employment, firm economic output, and earnings growth (Chang, 2010; Irwin, 2015; Ulasan, 2012). Some countries (e.g., the USA, South Africa, Nigeria, Kenya, Zimbabwe, and others) have responded by implementing inward-looking or protectionist policies to protect home employment and businesses (Asante, 2016). Proponents of free trade, on the other hand, claim that trade is a critical condition for everyone’s economic progress, prosperity, and long-term development (Bendell, 2017; Gilpin, 2018; Rodrik, 2014).
Institutions (economic, political, or social), can be considered the fundamental rules for human coexistence. Institutions conserve, facilitate the redistribution, and promotion of wealth maximization as well as ensure the preservation of property rights. Greif and Mokyr (2017) suggest that institutions emanate from evolving cognitive rules which are not independent of the cultural disposition of the society. The economic system, based on its peculiar circumstances, generates institutions to support economic activity. Empirical evidence shows that the institutional quality improves economic growth, a prerequisite for poverty alleviation (Klasen, 2008; Tebaldi & Elmslie, 2008; and inequality, Glaeser et al., 2004). Chidede (2017) concluded that improved inclusive growth is conditioned on the existence of strong rule-based trade governance.
The existing literature has, at best, considered trade openness, institutions, and inclusive growth in isolation even though institutions are known to facilitate trade openness (Ali et al., 2020; Asamoah et al., 2019; Idan, 2019; Hakimi & Hamdi, 2020) and inclusive growth (Berkhout et al., 2018; Levine, 2012; Pritchett & Werker, 2012). There is little evidence in the literature on whether quality institutions condition the trade-inclusive growth relationship and whether the coexistence of institutions and trade openness matter in this nexus. These form the thrust of this study.
Literature Review
Utilitarian Social Welfare Theory
Sociopolitical influences shape the structural institutions of the social welfare system, according to utilitarian social welfare theory. The theory highlights the importance of pressure groups, such as the government, in regulating social welfare and describes why some groups are excluded from the system. The theory improves on the social welfare function by incorporating all aspects required to increase a state’s economic growth as well as wealth dispersal fairness to empower various fundamental interest groups.
The theory reflects the tenets of endogenous growth and the requisite growth-enhancing institutional environment espoused by La Porta et al. (1999) in their theories of institutional development. In the context of inclusive growth, utilitarian social welfare theory is used to describe how a country’s increase in GDP is initially achieved and maintained, and how that growth is allocated evenly with supporting institutions. This relates to reducing disparity and how GDP per capita is used to secure the well-being of the country. According to the utilitarian social welfare theory, inclusive growth is determined by two variables: income growth and income distribution (Rahul et al., 2013). It is, therefore, expected that strong institutions could lead to higher trade openness which could escalate into growth inclusiveness as the theory suggest.
Trade openness, institutions, and inclusive growth
Evidence abounds on trade openness and inclusive growth relationship but with conflicting results amidst divergent methodologies. Nowbutsing (2014) and Zarra-Nezhad et al. (2014) offer support for the strand of literature that argues that trade positively affects inclusive growth. Trade has a favorable impact on the economy but growth itself reduces trade openness (Brueckner & Lederman, 2015). Additions to trade facilitation (infrastructure, institutions, and improvements in social welfare are linked to market efficiency in SSA (Sakyi et al., 2018) even though trade facilitation could create inequalities in the distribution of benefits (Hoekman & Shepherd, 2015). Pradhan et al. (2017) concluded that economic growth is conditioned on trade openness and foreign direct investment.
This, notwithstanding, Rigobon and Rodrik (2005) opine that trade has a negative influence on income volatility. Fenira (2015) adds that trade openness and inclusive growth have a weak link while Tekin (2012) contends that in the least developed African countries, there are no substantial causal relationships between grants, trade, and economic growth. The threshold effect (Kim et al., 2009; Zahonogo, 2016), omitted variable bias (Brueckner & Lederman, 2015), and stage of economic development (Rassekh, 2007) have been offered as explanations for the trade-growth ambiguity.
The mixed results in the trade-growth nexus could be a result of differences in the conditioning environment. The cogency of trade openness depends on the institutional quality (political, legal, economic, and socio-cultural structures). Strong institutions, such as the rule of law, government competency, corruption control, and regulatory quality, according to Gani and Prasad (2006), are critical in maximizing a country’s gains from international commerce. When institutions are taken into account, the impact of trade on economic growth is reduced (Rigobon & Rodrik, 2005). According to Chidede (2017), sustaining equitable growth requires strong rule-based trade governance.
Institutions are endogenous in explaining economic growth in addition to explaining trade dynamics. To pursue inclusive growth, both formal and informal institutions must be an integral part of the agenda (Adams et al., 2016; De Haan, 2015; Hartmann et al., 2017; Idan, 2019; Le Goff & Singh, 2013). Institutional channels to growth include increased productivity (Aparicio et al., 2016), facilitating capital flows (Agbloyor et al., 2016; Slesman et al., 2015), and promoting entrepreneurial activity (Autio & Fu, 2015; Bosma et al., 2018), ensuring that loans and venture capital are readily available (Agyemang et al., 2018). This notwithstanding, in some cases, the presence of weak institutions and generalized morality increases economic growth (James, 2015) while some institutions may be detrimental to growth (Yildirim & Gökalp, 2016). Thus, this paper proceeds with the following hypotheses:
H1: Trade openness has no relationship with inclusive growth in SSA
H2: Institutions do not moderate the relationship between trade openness and inclusive growth.
Control variables
Existing empirical studies have considered the effect of financial inclusion (Abor et al., 2018; Corrado & Corrado, 2017; Demirguc-Kunt et al., 2017), FDI (Pradhan et al., 2017; Rajapaksa et al., 2017), inflation (Kodongo & Ojah, 2016; Mireku et al., 2017; Wieland et al., 2016), and financial development (Khan et al., 2016; Otchere et al., 2017: Rewilak, 2017) on inclusive growth.
Methodology
The study used a systems general method of moments (GMM) panel estimator to estimate the Models, based on the nature of data used for the study, the inclusion of the lagged dependent variable as an independent variable, and the relative benefits of the system GMM. The difference estimator propounded by Arellano and Bond (1991) was deemed inappropriate because it tended to give wrong estimations in conditions where the regressors (like institutional quality) become relatively constant after they have become established in society (Acemoglu & Robinson, 2012; Arellano & Bover, 1995). Because of the weakness in using only the lagged levels of the variables as instruments, Blundell and Bond (1998) propose using system GMM estimation, which combines the equation at levels with those in first differences while employing the regressors’ lagged differences as additional instruments for the levels equation.
The systems GMM also accounts for the problem of reverse causality while dealing with the potential problem of endogeneity common with dynamic models (Miletkov et al., 2017). The problem of instrument proliferation is widespread because the systems GMM uses the lags of the dependent and independent variables as instruments in a data span with a small time-series dimension (22 years) compared to a high cross-sectional dimension (39 years; Agyei et al., 2020, 2021; Idan, 2019; Roodman, 2009). To reduce the risk of bias from instrument proliferation, the study limits the moment conditions to a maximum of two lags of the dependent variable, as advised by Roodman (2009). The rule of thumb states that the number of instruments should be fewer than or equal to the number of groups to avoid instrument proliferation (Mileva et al., 2007).
The models’ robustness was determined using Arellano and Bond’s (1991) serial correlation tests, and the Sargan test for instrument validity, the second-order serial correlation of no autocorrelation was tested (Mileva et al., 2007). The hypothesis, “the instruments as a group are exogenous,” of the Sargan test of over-identifying restrictions was used to ascertain the exogeneity of the instruments as a group. The Sargan test statistic with a higher p-value implies that the instruments used in the GMM estimation are valid and that the segregation constraints for these instruments are suitable.
Models Specification
The study followed Rahul et al. (2013) as adopted by Khan et al. (2016). To capture the effect of institutional variables and control for foreign direct investment, financial sector development, and inflation, Rahul et al. (2013)’s model was modified into equation 1.

Where
Equation (2) was used to test for the moderating effect of institutions in the trade-inclusive growth nexus.

Measurement and computation of inclusive growth
The dependent variable, inclusive growth, was quantified using a five-dimension index published by the African Development Bank (Ngepah, 2017). This component encompasses economic, social, special, political, and ecological factors that explain both the majority’s participation in economic progress and the distribution of economic development fairly. This dimension is expanded to include eight broad components, as shown in Table 1. This measure of inclusive growth reflects the African geographical context of the concept. The inclusive growth index was computed using the arithmetic mean approach. The arithmetic mean was calculated by adding the normalized values of each indicator, Sj, in country i and finding the average. Each component, as well as each indicator within it, was given the same weighting.

where:
i = 1. . ., m: country i included in the dataset
j = 1,. . ., n: indicator j included in the data set
Description of Dependent Variable Measurement and Data Source.

Table 2 present the computation of the inclusive growth index. The closer the index score is to 100, the higher the degree of inclusiveness of the country’s economic growth. Value judgments are implied in a composite index built on a scoring algorithm and weighting scheme. The composite index is generated using a weighted average score of 0 to 100 and a total range of 0 to 100 for each of its components. All eight components are given equal weight, with each receiving a 12.5% score. Components with many indicators spread out the assigned score. Growth, Gender, and Environment, for example, will each receive a score of 12.5%, whereas health and demographics, labor force and employment, which each include three indicators, will each receive a score of 4.17%.
Aggregation Methods Based on Different Indicator Weights.

Measurement of independent variables
The independent variable, trade openness, was calculated using the ratio of imports and exports to GDP. This trade openness metric is widely used and acknowledged in the literature. The simple average of the six global governance indicators, namely rule of law, regulatory quality, corruption control, government effectiveness, political stability and absence of violence, and finally, voice and accountability, was used to determine the quality of institutions in the country level.
The term “rule of law” refers to people’s perceptions of how much they trust and follow society’s laws, including the quality of contract enforcement, property rights, the police, and the courts, as well as the possibility of crime and violence. Government effectiveness is influenced by the quality of public services, the quality of the civil service and its independence from political influences, the quality of policy formulation and implementation, and the credibility of the government’s commitment to such policies. Citizens’ perceptions of their ability to participate in the selection of their government, as well as freedom of expression, association, and the free press, are referred to as “voice and accountability” (Kaufmann & Kraay, 2018).
Political stability and the absence of violence are metrics for determining the likelihood of political instability and/or politically motivated violence, such as terrorism. Regulatory quality encapsulates the public’s perception of the government’s capacity to set and enforce effective rules and regulations that allow and encourage private sector development. Control of Corruption encompasses both petty and grand corruption, as well as state takeover by elites and private interests, and refers to the use of public power for private gain. The study employed three macroeconomic indicators as control variables: foreign direct investment, inflation, and financial development. The data, their measurement, and their source are contained in Table 3.
Description of Independent Variable Measurement and Data Source.

Analysis and Discussion
Descriptive Statistics
The descriptive statistics are presented on a sample of 39 SSA economies (Angola, Benin, Botswana, Burkina Faso, Burundi, Cameroon, Cape Verde, Central African Rep., Chad, Comoros, Congo, Congo Dr., Cote d’Ivoire, Equatorial Guinea, Gabon, Ghana, Guinea, Guinea-Bissau, Kenya, Lesotho, Liberia, Madagascar, Malawi, Mali, Mauritania, Mauritius, Namibia, Niger, Nigeria, Rwanda, Swaziland, Senegal, Seychelles, South Africa, Tanzania, The Gambia, Togo, Uganda, and Zambia) out of a total of 48 SSA economies due to data unavailability of some economies in the region.
Table 4 indicates that the average inclusive growth index was 18.74%, ranging from 3.179% to 42.86%. This backs up the Rahul et al. (2013) analysis, which found that most SSA countries’ growth was less inclusive than in other parts of the world. Within the range of 17.86% and 531.7%, trade openness averaged 78.16%. This shows that, even though most SSA economies have increased trade openness over time, trade openness does not contribute significantly to inclusive growth. Concerning institutions, the aggregate institutional quality indicator had an average of −0.662, falling between the ranges of −2.466 and 0.963, indicating that institutional quality in SSA is poor. The components of the aggregate institution mirrored the index’s overall composition. Government effectiveness is the weakest aspect of institutional quality in most SSA economies, while political stability and lack of violence are the strongest.
Descriptive Statistics.

Note. IGI represent inclusive growth measured by the composite of the five-dimension index developed by AfDB. TO represents Trade openness as measured by the Trade (imports and exports) as a percentage of GDP. INSTI represents institutions which are measured by the average of the six worldwide governance indicators. The six worldwide governance indicators include control of corruption (CoC), government effectiveness (GovE), political stability and absence of violence (PS), Regulatory quality (RQ), Rule of Law (RoL), and voice and accountability (VaA) as shown in Table 1. INF represents Inflation. FD represents financial development which is measured by domestic credit to private sector as a percentage of GDP. FDI represents foreign direct investment measured by net inflow as a % of GDP.
Financial development was as low as 15.45% on average, with variations between 0.410% and 106.3%. This result affirms the study by IMF in 2016, which concluded that most SSA economies have lagged behind other regions in terms of financial development. Again, results reported average inflation of 16.05% within the parameters of −8.975% and 4.145%. The severity of this is due to the Angolan crises that lasted from 1996 to 2000. As a result, inflation was transformed to remove extreme values. Finally, net inflows of foreign direct investment (as a percentage of GDP) averaged 4.607%, with a range of −8.589% to 161.8%. This also was transformed because of similar outliers’ characteristics to that of inflation.
Correlation Matrix
Table 5 reports the pairwise correlation matrix for regressors. The collective institutional index, predictability, shows a high pairwise relationship across the six individual variables. However, there is no issue of multicollinearity because the aggregate index does not enter the same model as the six indicators. Again, the pairwise matrix does not have any further issues of multicollinearity because the other variables do not have correlation coefficients greater than .90 (Agyei, 2010; Varotto & Zhao, 2018). This suggests that the presence of multicollinearity among the regressors is minimal.
Correlation Matrix.

Note. IGI = inclusive growth; lnTO = log of trade openness; INSTI = institutions; CoC = control of corruption; GovE = government effectiveness; PS = political stability and absence of violence; RQ = regulatory quality; RoL = rule of law and VaA is voice and accountability; lnINF = lag of Inflation; lnFD = lag of financial development; lnFDI = lag of foreign direct investment.
Represent significant at 10%.
Represents significant at 5%.
Represents significant at 1%.
Discussion of Regression Results
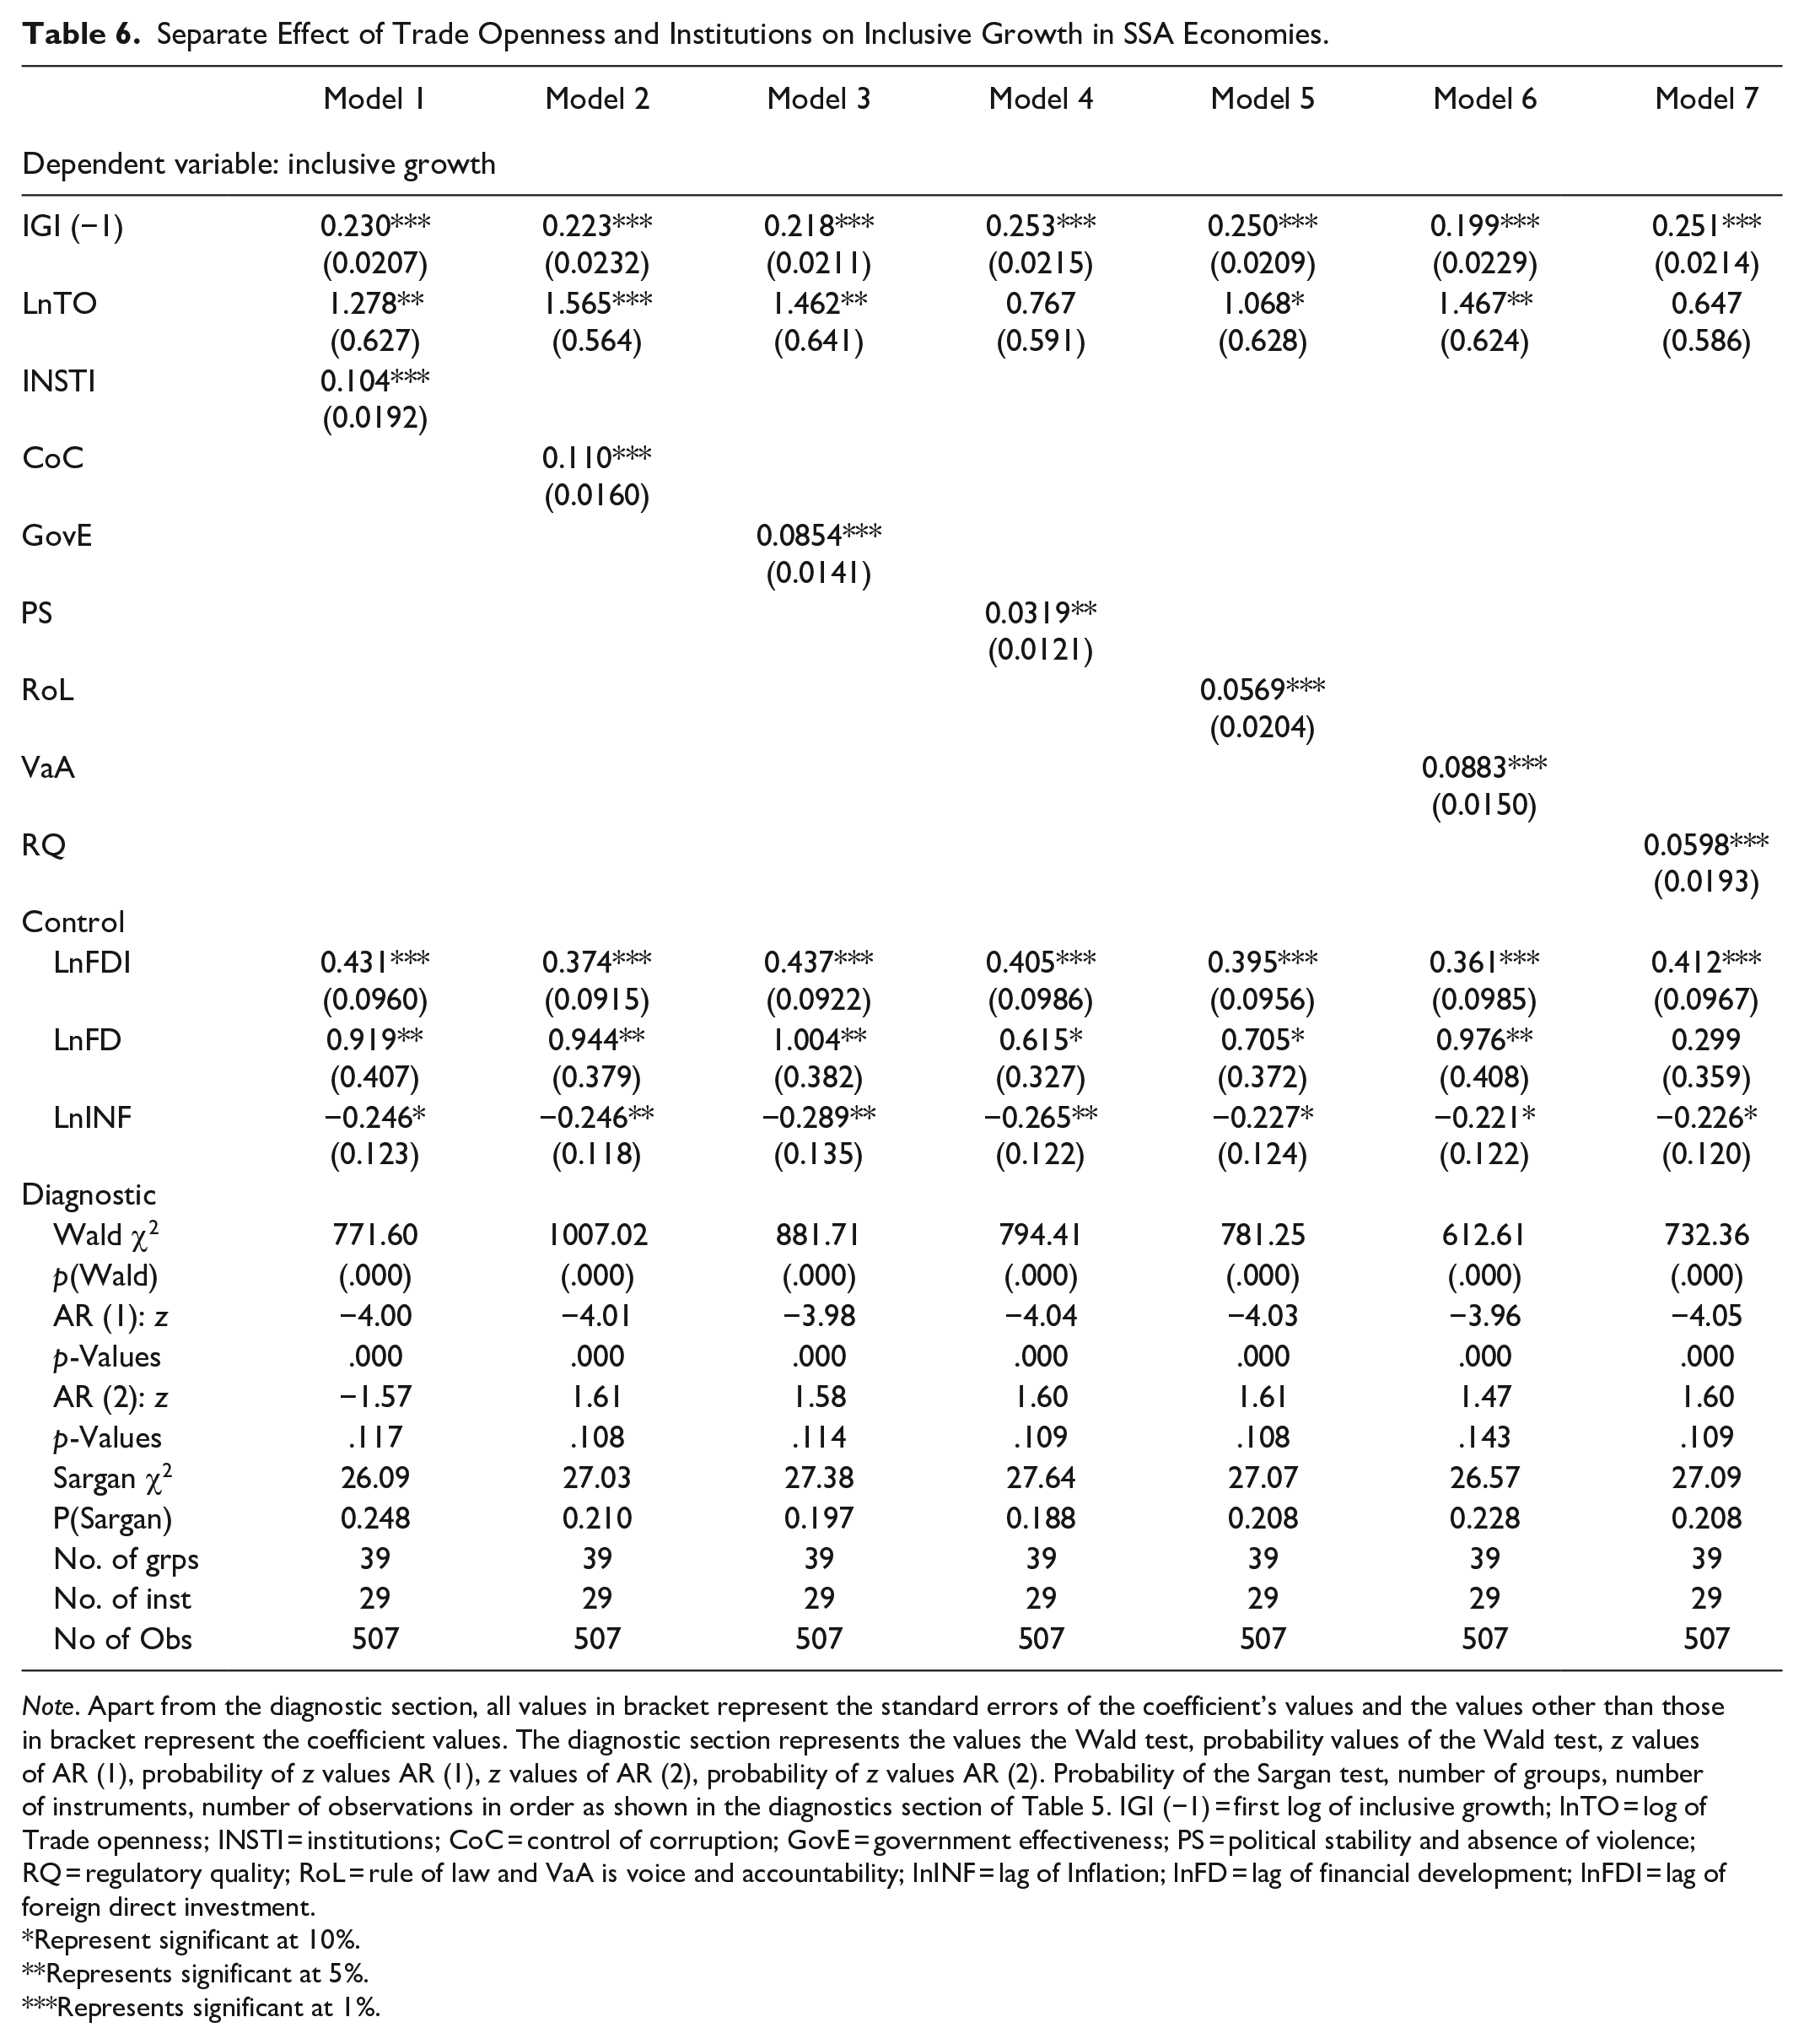
The results of the study’s hypotheses one and two are presented and discussed in this subsection. Tables 6 and 7 show the results of the regression. Table 6 shows the effects of trade openness and institutions on inclusive growth in SSA economies separately, whereas Table 7 shows the results of institutions’ moderating effect on the relationship between trade openness and inclusive growth in SSA countries. The results of the effects of trade openness and institutions on inclusive growth in SSA economies are again depicted in Model 1 (Table 6), which is consistent with the study’s first hypothesis.
Separate Effect of Trade Openness and Institutions on Inclusive Growth in SSA Economies.
Note. Apart from the diagnostic section, all values in bracket represent the standard errors of the coefficient’s values and the values other than those in bracket represent the coefficient values. The diagnostic section represents the values the Wald test, probability values of the Wald test, z values of AR (1), probability of z values AR (1), z values of AR (2), probability of z values AR (2). Probability of the Sargan test, number of groups, number of instruments, number of observations in order as shown in the diagnostics section of Table 5. IGI (−1) = first log of inclusive growth; lnTO = log of Trade openness; INSTI = institutions; CoC = control of corruption; GovE = government effectiveness; PS = political stability and absence of violence; RQ = regulatory quality; RoL = rule of law and VaA is voice and accountability; lnINF = lag of Inflation; lnFD = lag of financial development; lnFDI = lag of foreign direct investment.
Represent significant at 10%.
Represents significant at 5%.
Represents significant at 1%.
The role of Institutions in the Relationship Between Trade Openness and Inclusive Growth of SSA Economies.

Note. Interact represents the interaction of Trade Openness and Institution variables. IGI (−1) = first log of inclusive growth; lnTO = log of Trade openness; INSTI = institutions; CoC = control of corruption; GovE = government effectiveness; PS = political stability and absence of violence; RQ = regulatory quality; RoL = rule of law and VaA is voice and accountability; lnINF = lag of Inflation; lnFD = lag of financial development; lnFDI = lag of foreign direct investment.
Table 6 further presents the effects of each institutional indicator on the inclusive growth of SSA economies in Model 2 to Model 7; thus, control of corruption, government effectiveness, political stability, rule of law, voice and accountability, and regulatory quality, respectively. Also, Table 7 presents the results of the moderating effect played by the institutional index in the relationship between trade openness and inclusive growth in SSA economies. Table 7 again, presents the moderating effect of each institutional variable in the relationship between trade openness and inclusive growth in SSA economies.
Trade openness and inclusive growth in SSA economies
In Table 6, the results from Model 1 show that trade openness has a significant positive effect on inclusive growth in the sampled SSA economies at the 5% significant level. The coefficient of 1.278 indicates that a 1% increase in trade openness leads to a 1.278% improvement in inclusive growth. As a result, the findings refute the notion that trade openness has no impact on inclusive growth in the region. This is because increased trade openness via technology leads to economies of scale, resulting in a virtuous circle of structural differences being reduced while growth increases the well-being of the majority and reduces inequality. This ultimately increases inclusive growth (Khan et al., 2016).
The findings are consistent with those of Chidede (2017), Gonzalez-Redin et al. (2016), and a joint publication by the WTO, IMF, and World Bank (2017), which indicate that trade and integration can help Africa achieve inclusive growth. Trade openness creates jobs, particularly for women in export-oriented sectors (Bendell, 2017; Gilpin, 2018), facilitating growth and development in SSA countries. Trade openness reduces trade costs and permits regional and global value chains to expand, all of which are major drivers of specialization, productivity, and industrial exports. Finally, depending on the private sector’s supply response, talents, and capacities, trade openness can help with economic diversification. Thus, trade openness increases the level of inclusiveness of growth by way of empowering minors in society, ensuring growth, prosperity, and sustainable development for all. However, the study is inconsistent with Irwin (2015) and Asante (2016) who doubt trade as an engine for inclusive growth.
Institutions and inclusive growth
The results from Model 1 in Table 6 again, indicate a positive significant effect of institutions on inclusive growth at a 1% significant level showing a coefficient of.104. The results suggest that quality institutions enhance growth for all, ensure distribution of growth benefits across various social and political groups in society, enable participation of all in broad economic decisions, provide employment for the weak in society, and enforce sustainable production practices. The result corroborates Acemoglu and Robinson (2012) and La Porta et al.’s (1999) view that institutions are catalysts for inclusive growth.
Finally, results from Model 2 to Model 7 of Table 6 reveal that each of the six institutional indicators has a significant and positive effect on the inclusive growth of SSA economies. Although significant, all these indicators show a very weak effect on inclusive growth. These results corroborate previous empirical findings (Dollar & Kraay, 2002; Doumbia, 2019; Khan et al., 2016; Kraay, 2004).
Results of the control variables
The control variables for the models examining the independent effects of trade openness and institutions on inclusive growth in SSA economies have been determined. Table 6 shows how all of the models in the table control for three variables: financial development, foreign direct investment, and inflation. According to Table 6, there is an inverse relationship between inflation and inclusivity, with a coefficient of −.246 and a significance level of 10%. Higher inflation is linked to a lower rate of poverty reduction, as well as a negative contribution to distributional impacts, due to lower average welfare growth. Food price inflation affects poor households disproportionately since they must spend more on food and have limited substitute options. As a result, they are highly affected by a persistent increase in food prices (Rahul et al., 2013: Wieland et al., 2016).
Also, as demonstrated in Models 1 through 7 of Table 6, financial development has a positive and significant effect on inclusive growth in SSA. This affirms the significance of improving the financial sector of every economy which is a vector to inclusive growth. This finding is in line with Khan et al. (2016), who found that financial sector changes have made it easier to get a loan for investment purposes. Lastly, Foreign direct investment improves inclusive growth with a coefficient of .431 in Model 1 of Table 6, which is significant at 1%. This explains that a 0.431% rise in inclusive growth in the sampled SSA economies is caused by a change in FDI. This result is consistent with the Models in Table 6. Finally, all of the models in Table 6 are well specified, according to the results of the serial correlation test and the Sargan test.
The moderating role of institutions in the relationship between trade openness and inclusive growth in SSA economies
Table 7 shows the results of the moderating role played by institutions, by the aggregate institutional quality variables, in the relationship between trade openness and inclusive growth in SSA economies. Again, Table 7 shows the results of the moderating role of each of the institutional indicators in the relationship between trade openness and inclusive growth in SSA economies as depicted in Model 2 to Model 7 of Table 7. This is seen by the introduction of the interaction term of trade openness and institutions observed in aggregate institutions as well as at each of the institutional indicators.
Table 7 shows the results of Model 1 and explains a fascinating phenomenon. The interaction term between trade openness and institutions has a coefficient of .168, which is significant at 5%. The introduction of the interaction term resulted in a coefficient of 1.386 for the trade openness variable, compared to 1.278 in Model 1 of Table 6. However, in Table 7, the coefficient of institutions was negative, as opposed to a positive coefficient in Table 6. The result implies that the interaction term reflects the resulted in the true nature of institutional quality in SSA. That is, while the weak nature of institutions in SSA may obstruct inclusive growth, it complements trade openness to improve inclusive growth.
The partial differential of inclusive growth concerning trade openness is used to evaluate the net effect of trade openness on inclusive growth. The net effect of trade openness on inclusive growth is 1.386 + 0.168 × INSTI or 1.2852 (calculated as 1.386 + 0.168 × −0.600). Therefore, there is a complementary role of institutions since the net effect on trade openness is 1.2852 as opposed to 1.278 in Model 1 in Table 6, indicating an improvement in inclusive growth. This explains why, without stronger institutional structures, trade openness alone may not contribute much to inclusive growth in SSA economies. Hadhek and Mrad (2015), Baliamoune-Lutz and Ndikumana (2007), and Gani and Prasad (2006) all stated that good institutional quality is an important component in maximizing a country’s benefits from international commerce.
In Model 1 of Table 7, the interacting term of trade openness and control of corruption resulted in a coefficient of 1.355, compared to a coefficient of 1.278 in Model 1 of Table 6. Similarly, the interaction term between trade openness and control of corruption has a positive coefficient of .0238, which is statistically significant at 10%. This finding is consistent with Doumbia (2019), who found that institutional indicators have a complementary effect on the variables that drive inclusive growth, with a focus on trade openness.
The moderating effect of government effectiveness in the link between trade openness and inclusive growth in SSA economies is depicted in Model 3 of Table 7. When the interaction term of trade openness and government effectiveness is included in Model 2 of Table 7, the trade openness variable achieves a 5% significant coefficient of 1.892, compared to a coefficient of 1.462 in Model 3 of Table 6. The interaction term between trade openness and government effectiveness was positive .0466, which is statistically significant at a 10% level. This demonstrates that to further foster equitable growth in SSA economies, high government effectiveness will be required to complement trade openness.
Results from Model 4 of Table 7 depict the moderation of political stability and absence of violence and trade openness on inclusive growth in SSA economies. Although the interaction term between trade openness and political stability was insignificant, the coefficient of trade openness in Model 4 of Table 7 was 1.370, compared to .767 in Model 4 of Table 6. Again, results from Model 5 of Table 7 depict a similar dynamic in Model 4 of Table 7 but show the interaction term of rule of law and trade openness on inclusive growth. Model 5 shows that the interaction term was insignificant however the coefficient of trade openness improved from 1.068 as shown in Model 5 of Table 6 to a coefficient of 1.495 as shown in Model 5 of Table 7. This result is consistent with the result of Hadhek and Mrad (2015).
Results from Model 6 of Table 7 shows that the interaction term of voice and accountability and trade openness has a positive and significant effect on inclusive growth with a coefficient of .0153. Again, trade openness also showed a positive and significant effect with a coefficient of 1.385. This result is consistent with Rodrik (2014), trade openness is likely to boost inclusive growth in developing economies when there is a strong institutional improvement. Finally, regulatory quality enhances the effect of trade openness on inclusive growth in SSA economies with the coefficient of trade openness increasing from .647 in Model 7 of Table 6 to a coefficient of 1.624 which is significant at the 5% level as shown in Model 7 of Table 7. Again, the interactive term of trade openness and the regulatory quality shows a significant coefficient of .0208.
Results of the control variables for the models assessing the moderating role of institutions in the relationship between trade openness and inclusive growth in SSA economies
All the models in Table 7 controlled for the same control variables as controlled for in Table 6. The coefficients and significant levels of the control variables in Table 6 do not deviate significantly from that in Table 7. Also, the diagnostics confirm that the models in Table 7 are well specified for reliable inferences.
Agglomerating effect in the models
The lagged form of the inclusive growth variable was included in all the models in Tables 6 and 7 to allow for the partial adjustment of inclusive growth to its long-run equilibrium value. This is because inclusive growth is a process, and thus previous levels of inclusive growth affect the current levels. It can be seen in all models in Tables 6 and 7 that the coefficient of the lag inclusive growth variable was positive and significant at a 1% level. The positive sign of the coefficient of the lag inclusive growth variable in all models indicates that SSA economies’ inclusive growth in past years contributes significantly to inclusive growth in current years. The significance of the lagged inclusive growth variable means that the system GMM is a good estimator and that the empirical results may be trusted for statistical inference.
Conclusion
Research on whether institutions condition the inconclusive relationship between trade openness and inclusive growth has received little attention in SSA. This study contributes to the existing literature by assessing whether institutions can help clarify the ambiguity in the trade-inclusive growth nexus. Two main hypotheses were pursued using a systems dynamic panel estimation technique. The results of the study affirm unequivocally that both trade openness and institutions affect inclusive growth positively in the sampled SSA economies thus rejecting the first hypothesis of the study. Again, the results indicate that the quality of institutions complements trade openness and enhances the effect of trade on inclusive growth in the sampled SSA economies refuting the second hypothesis that institutions play no role in the trade-growth relationship. Thus, the study recommends that SSA economies should pursue policies aimed at improving government effectiveness, reducing corruption, enhancing regulatory quality, abiding by the rule of law, and allowing voice and accountability. The environment of responsible institutions, transparent business, protected civil liberty, respected political rights, control of corruption, and political stability promote the expansion of international trade by reducing transactional costs and risks related to trading.
Footnotes
Declaration of Conflicting Interests
The author(s) declared no potential conflicts of interest with respect to the research, authorship, and/or publication of this article.
Funding
The author(s) received no financial support for the research, authorship, and/or publication of this article.