
Abstract
In resorts, service quality refers to the overall level of guest satisfaction during their stay. This includes a variety of factors, such as the friendliness and helpfulness of the staff, the cleanliness and condition of the rooms and common areas, the availability of amenities and activities, the efficiency of check-in and check-out procedures, and the resort’s overall atmosphere. To address above gap, this study aims to develop contextual service quality (SERVQUAL) instrument for resorts to obtain the consensus benchmark to measure the service quality of Nepali tourist standard resorts. The SERVQUQL is a measuring tool of service quality of different organizational settings, more importantly, in the hospitality and service sector. Therefore, to contextualize and align to SERVQUAL, the Modified Delphi Technique (MDT) was used to develop this instrument based on SERVQUAL theory. The instrument development was performed among 10 anonymous experts and stakeholders who have experience, knowledge, and expertise in the area of the hospitality and leisure industries. The findings identified that one more key construct is essential to realize the service quality of the tourist standard resorts. To carry out the mutual consensus among the experts and stakeholders, the interquartile range (IQR) value was taken from three points Likert scale to conduct the MDT from the second stage until the mutual consensus of experts and stakeholders. The IQR value was taken from each set of questions which was evaluated by the exports to obtain a consensus benchmark on the contextualized SERVQUQL construct and items. The data were presented using Microsoft Excel. In the final stage, 29 question statements out of 31 were found to have a high consensus benchmark among the experts and stakeholders. Therefore, 29 items from six constructs were accepted and included in the actual questionnaire to measure the service quality of Nepali tourist standard resorts. Our findings contribute to the SERVQUAL theory, practice, and future research.
Keywords
Introduction
Service quality in resorts refers to the overall satisfaction that guests experience during their stay at the resort. This includes a wide range of factors, such as the friendliness and helpfulness of the staff, the cleanliness and condition of the rooms and common areas, the availability of amenities and activities, the efficiency of check-in and check-out processes, and the overall atmosphere of the resort. To maintain high levels of service quality (Lim et al., 2022, Shamsudin et al., 2023), resorts must constantly strive to meet and exceed the expectations of their guests. Further, some additional aspects of service quality that are important in resorts are, namely, attention to detail—this refers to the resort’s ability to anticipate and address the needs of its guests. This could include things like providing extra pillows or blankets, offering turn-down service at night, or ensuring that the resort’s facilities and amenities are well-maintained and in good working order. Responsiveness—this means that the resort is quick to respond to requests and concerns from guests. If a guest needs something, the resort should make every effort to meet that need promptly and efficiently. Personalization involves going above and beyond to make guests feel welcome and valued. This could include remembering a guest’s name, offering personalized recommendations for activities or dining options, or providing special amenities or services based on a guest’s preferences or needs. Flexibility—a resort should be willing and able to adapt to its guests’ changing needs and preferences. This could include offering different room options, being willing to accommodate special requests, or being open to guest feedback and suggestions. Consistency—service quality should be consistent across all aspects of the resort, from the front desk to the dining room to the amenities and activities. This means that guests should be able to expect a high level of service no matter where they are or what they are doing at the resort.
With the above background, service quality and quality standards are major policies established by a service organization to excess the targeted customers to perform and deliver the available services (Sweya et al., 2019). Manju (2020) highlights that service quality is crucial for the existence and survival of the organization at the workplace. Similarly, service quality expectation is being updated in different organizations from the customers’ perspective of integrated care (Khatoon et al., 2020; Lim, 2020a). Therefore, regularly accessing the service quality through different instruments as well as indicators is essential for the sustainability of the model or framework (Lim, 2020b; Lim et al., 2021). To measure service quality different measurement tools for measuring services are available in different literature. In this regard, Cronin and Taylor (1994) suggested a performance-based service measurement tool as SERVPERF model to measure service quality. Similarly, Tefera and Govender (2016) of South Africa identified the hotel service measurement tool (e.g., HOTSPERF model) to measure the service quality of hospitality and leisure industries of developing countries by proposing 10 tangible and 16 intangible question statements. The SERVQUAL has 4 tangible and 18 intangible items under the five constructs. Lee et al. (2016) explained on LODGSERV, HOLSERV, LODGQUAL, and DINESERV measurement tools to measure the service quality of the hospitality sector. They further claimed that LODGSERV and LODGQUAL are used for accommodation and lodges, where DINESERV can be used in restaurants, and HOLSERV is useful for the hotel business. The service industries are existed with different tangible and intangible constructs (Prasad et al., 2014). Therefore, to measure the service quality, the extensive fields of modified SERVQUAL instrument of Zeithaml et al. (1990) as an appropriate tool to measure the service quality of the hospitality and leisure sector (Akan, 1995; Bello, 2012; Bello et al., 2017; Gabbie & O’Neill, 1997; Johns & Tyas, 1996; Prasad et al., 2014).
The SERVQUAL instrument also fails to show construct validity (Cronin & Taylor, 1992, 1994). Therefore, the proposed SERVPERF tools with greater construct, convergent, and discriminant validity. But Williams (1998) claimed that Cronin and Taylor’s (1992) measurement tool for service quality SERVPERF had not accepted the extensive field trials of SERVQUAL. However, in hospitality and leisure, most of the researchers and scholars have recognized and adopted SERVQUAL instrument to measure the service quality (Akan, 1995; Gabbie & O’Neill, 1997; Johns & Tyas, 1996; Juwaheer, 2004; Lam & Woo, 1997; Mels et al., 1997; Parasuraman et al., 1985; Saleh & Ryan, 1991, 1992, Taylor et al., 1993; Williams, 1998). Therefore, this paper is an outcome of the researchers’ construct and items of the modified SERVQUAL of Zeithaml et al. (1990) instrument to measure the service quality of tourist standard resorts in Nepal.
Problematizing the Agenda
Although all service providers are more attentive to providing service quality to the customers, sometimes the perception and expectancy of the customer will be disconfirmed. Hence, the discrepancy between perception or expectation and performed service plays a vital role in the service taker or customer dissatisfaction. In the Nepali hospitality and leisure sector, most customers claim to have encountered mediocre service quality in a variety of tangible and intangible administrative encounters, particularly in the tourist standard resorts (Ministry of Culture, Tourism and Civil Aviation [MCTCA], 2014). It is very sensitive and crucial for customer loyalty and satisfaction. Most resorts are still running without having their category defined by the government (Department of Tourism, 2021). Thus, the quality of employee, quality of service, profitability, and legacy of the resorts is deteriorating annually (MCTCA, 2014).
The hospitality sector has attracted higher investment amongst the local entrepreneurs (Hotel Association Nepal [HAN], 2021). Total private investment on recent dates seems to be approximately 15,00 billion rupees, and the loan from different banks is 400 billion rupees, which is 40% of the total investment. The tourism industry earns 24% of the total foreign currency earnings of the country, out of which 20% is from the hotel industry. Hence, the service quality is the main determinant factor of the revenue and employability, where 200,000 direct employments are being possible from this sector. Thus, if we do not maintain an adequate level of service quality, satisfaction, and loyalty of customers as well as the attraction of hospitality and leisure would rapidly decrease, and the country would lose a considerable amount of private investment, employability, and foreign currency earnings.
The Government of Nepal issued a Gazette Part 5, on 2076/09/07 BS (Bikram Sambat, i.e., Nepali Calendar) through the MCTCA to improve the tangible and intangible service quality of the hospitality sector, including different categories and minimum education and efficiency level of the employees. Among them, Nepali resorts are the crucial part that is lagging because of minimal or no emphasis on the policies and practices than the star-rated city hotel. Implementation of Gazette Part 5, by the government, some gray area of tangible and intangible service quality and minimum requirement of the general and professional education has been mentioned, but most of the resorts are still running without standard category and minimum service quality defined in the Gazette. Similarly, the lack of contextually rigorous studies on service quality indicates the declining future of Nepali resorts. Some studies have been carried out on this area by master’s students of the Nepal Academy of Tourism and Hotel Management (NATHM), but those studies were also limited on star-rated hotels, restaurants, and airlines services. Multiple international research projects are centered on service quality and customer satisfaction. They have discovered a significant and positive correlation between service quality, customer satisfaction in the hospitality sector (Bello, 2012; Bello et al., 2017; Prasad et al., 2014).
The issue of service quality is always raised in different organizational settings in Nepal (MCTCA, 2014). Among them, the service sector is very sensitive as they have to sell the service quality to the customer rather than physical products. Service quality literature has focused on improving the hospitality industry’s different tangible and intangible administrated continuum and encounters (Khatoon et al., 2020; Prasad et al., 2014). But they have not adequately focused on developing an instrument to measure the service quality of different organizational settings, more importantly to the tourist standard resorts of Nepal. Hence, the knowledge gap is identified in this area across the content as well as our context, respectively. Therefore, a service quality measurement tool is required to measure the service quality level of different hospitality and service sectors. So, this is our attempts to develop a service measurement tool in our context.
The fundamental purpose of this paper was to validate and contextualize the SERVQUAL instrument to measure the service quality of hospitality and leisure industries, more importantly, tourist standard resorts of Nepal. The verification and approval benchmark were carried out with 10 anonymous experts and stakeholders at each stages of MDT. Each item (set of question statements) from identified six constructs were repaired and refined with high-quality standards through the best knowledge, experience, and expertise of 10 anonymous experts and stakeholders by three stages of MDT.
SERVQUAL Constructs and Items: A Review
For accessing the SERVQUAL, the original construct and items (question statements) related to the instrument are elaborated in Table 1.
The SERVQUAL Constructs and Items.

Source. Adapted and modified from Buttle (1996), Williams (1998), and Tefera and Govendar (2016).
Initially, the SERVQUAL instrument had 10 constructs to measure the service quality, which was overlapping. Thus, Parasuraman et al. (1985) investigative study rearranged five essential constructs with 22 items (set of question statements) under the instrument, which is summarized below:
Tangibility
Under the service, quality tangibility represents the structural appearances, other different facilities, different equipment, working staff, means of communication, and presence of users. These components create an atmosphere toward service array and different encounters (Juwaheer, 2004; Prasad et al., 2014) of administrated service quality. Initially, four sets of question statements (four items) were included under the tangibility construct to measure the service quality (Tefera & Govendar, 2016; Williams, 1998) of different organizational settings.
Reliability
Service quality literature elaborates reliability as the aptitude to perform the promised service consistently and accurately (Williams, 1998). Thus, Juwaheer (2004) explains reliability as crucial to promotional efforts which contribute to the participants’ expectations. Under the reliability, five sets of question statements (five items) were included to measure the service quality (Tefera & Govendar, 2016; Williams, 1998) of different organizational settings.
Responsiveness
Responsiveness represents the willingness to help customers and to provide prompt delivery of services to them. It is crucial particularly in the hospitality and leisure industry (Juwaheer, 2004). It includes four sets of question statements (four items) to measure the service quality (Tefera & Govendar, 2016; Williams, 1998) of different service sector service organizations.
Assurance
Assurance includes employees’ knowledge, courteousness, and entrepreneurial skill (Adhikari, 2014). Here, their intrinsic ability to express confidence and trust are also included (Williams, 1998). It is crucial for credibility, competence, and security (Juwaheer, 2004) of different organizational settings. To measure the service quality, assurance includes four sets of question statements (four items) on the SERVQUAL instrument (Tefera & Govendar, 2016).
Empathy
Empathy is acknowledged as giving individualized attention to customers in the service quality literature. Juwaheer (2004) explains empathy as expressing an understanding of the participant’s desires and needs. There were five sets of question statements (five items) to carry out the service quality of different organizational settings under the service sector’s empathy construct (Tefera & Govendar, 2016).
Expectation
Zeithaml et al. (1993) explained the nature of customer expectations with collaboration and the service quality of the different organizational settings, and they identified that quality is determined by the customer’s predictions standard, ideal standard, and real brand standard or experience-based norms. All of these customer expectation standards pursue the different administrated encounters of the hospitality and leisure industry and thus they decide the quality standard of the different organizational settings (Zeithaml et al., 1993). Varieties of products or service experiences with good quality standard also determine the customers’ perception. Therefore, the “expectation” construct also is a part of the service quality standard of the hospitality and leisure sector, which is included in this study.
Theoretical Perspective: SERVQUAL Theory
There are several theoretical perspectives to consider when examining customer satisfaction and service quality. For satisfaction, Herzberg’s motivation-hygiene theory, need-fulfillment theory, and social reference-group theory are also available in the literature. Similarly, for service quality, Cronin and Taylor’s (1994) performance-based SERVPERF model, Tefera and Govender’s (2016) HOTSPERF model and other different LODGSERV, HOLSERV, LODGQUAL, and DINESERV model also are available to measure the service quality in terms of theoretical perspective. However, this paper intends to develop reliable and valid service quality measurement tool to measure the service quality for Nepali resorts. Therefore, this paper is carried out based on theoretical assumption of SERVQUAL model (Zeithaml et al., 1990) for service quality. To address the paper’s theoretical perspective, the overarching SERVQUAL theory/model (Zeithaml et al., 1990) was taken for this study to develop reliable and valid service quality measurement tool to measure the service quality of Nepali resorts.
Next, different scholars and theorists argued that service quality is a value added to customer’s needs (Juwaheer, 2004; Tham et al., 2022). But the service sector is widely increasing thereafter, and the importance of customers has also increased. So, the researchers and scholars accept service quality as integral to customer satisfaction (Lim, 2020a; Parasuraman et al., 1985; Zeithaml et al., 1990). Parasuraman et al. (1985) and Zeithaml et al. (1990) elaborate three unique characteristics of service quality which are not conceptualized or evaluated—intangibility, heterogeneity, and inseparability. Further, Parasuraman et al. (1985) and Zeithaml et al. (1990) define and conceptualize service quality as a state of mind and attitude that results from a judgment or comparison of customer’s expectation with performed performance (Juwaheer, 2004). Therefore, Parasuraman et al. (1985) developed a service quality model called SERVQUAL, which measures the gap between customer’s expectations and their perception of actual performance (Juwaheer, 2004) that constructs the perception of service quality.
Method: Contextualizing the SERVQUAL Instrument
This research uses MDT to collect and analyze the opinions of a group of experts and stakeholders in a particular field of study (Nashir et al., 2015). The interquartile range of 3-point modified Likert scales was the parameter, and SERVQUAL’s six constructs are the variables used to measure service quality. In terms of the research procedure, Cluster et al. (1999) claimed that the MDT is comparable to the Delphi technique. In order to obtain a consensus among the 10 anonymous experts and stakeholders on the constructs and items of service quality, the second stage of this study was modified based on the findings of the first stage. “The MDT involves three stages of study: (i) literature review and interview, (ii) questionnaire evaluation, and (iii) evaluation of correction made on the questionnaire” (Jubri et al., 2019, p. 104). The constructs and items of this study are derived from the literature of Zeithaml et al.’s (1990) modified SERVQUAL theory and its findings. And the SERVQUAL results reveal the five involved constructs: (i) tangibility, (ii) dependability, (iii) responsiveness, (iv) assurance, and (v) empathy. The proposed constructs will then serve as a guide for the subsequent interview phase of the initial stage.
The interview included 10 experts and stakeholders who wished to remain anonymous, including: (i) experienced resort employee; (ii) frequent resort customer (Tour Guide); (iii) tourism expert; (iv) expert from MCTCA; (v) expert from HAN; (vi) resort promoter/owner; (vii) university professor; (viii) program coordinator of Bachelor of Hotel Management (BHM); (ix) university associate professor; and (x) subject expert. They have participated in the construction of standard resort structures and service quality components. The interview was conducted separately with three experts and seven stakeholders in order to express much more open thoughts and opinions without influence from the panel of experts and stakeholders (Jubri et al., 2019). On the basis of interviews with 10 anonymous experts and stakeholders, an additional construct, expectation, was identified and added in order to reach consensus and construct modifications successfully.
The researchers have formulated and adapted SERVQUAL theory’s items for each questionnaire construct in order to develop a measuring instrument for the service quality of Nepali resorts. In this vein, Hilmi et al. (2014) recommended that the items involved in screening, interpretation, and careful reading of the research topic be mastered and formulated. Therefore, developed items (question statements) of the constructs were evaluated and reviewed by experts and stakeholders in the second stage of the MDT. Initially, to develop the construct and items of the SERVQUAL, a set of question statements containing 22 items was distributed to 10 anonymous experts and stakeholders for 2 weeks to obtain the necessary verification, opinion, inputs, and suggestions for the improvement of those items. They contributed fresh concepts. For instance, the pattern of questions was revised, and two questions regarding the “tangibility” construct were added. In a similar fashion, an additional construct, “expectation,” was identified, and six items were added to improve the service quality measuring instrument, as recognized in Zeithaml et al. (1993).
In addition, linguistic correction, question simplification, and an additional item on the “reliability” construct were added to the second stage. The evaluation of items was based on a 5-point Likert scale or the experts’ and stakeholders’ level of consensus, namely strongly disagree, disagree, undecided, agree, and strongly agree. After all of the experts and stakeholders had determined their respective consensus benchmarks and views on each item, the data obtained from the Likert scale were converted to quartile numbers and analyzed using Microsoft Excel. According to Jubri et al. (2019) and Subri et al. (2019), the data collection and analysis processes were conducted using the three stages of the MDT.
Obtaining the construct and items of service quality from the SERVUAL (Zeithaml et al., 1990, 1993) literature and conducting interviews with 10 anonymous experts and stakeholders concluded the first stage of the process. Similarly, the second and third stage processes were conducted to achieve a high level of consensus on the service quality’s construct and items. In the second stage, all experts were given the construct and items with a 5-point Likert scale and a blank space in each construct for their comments, suggestions, and opinions (see more in Appendices I and II). Then, comments and suggestions from stakeholders and experts were considered to enhance the elements of the proposed structure for the third stage of the MDT. The construct’s items were evaluated using the interquartile range (IQR; see more in Appendix III). Based on these three stages, it determined the level of consensus among the experts and stakeholders. Likert scale with modifications as proposed by Peck and Devore (2007). The data analysis was performed using experts and stakeholders’ IQR value and consensus level.
Analysis and Results
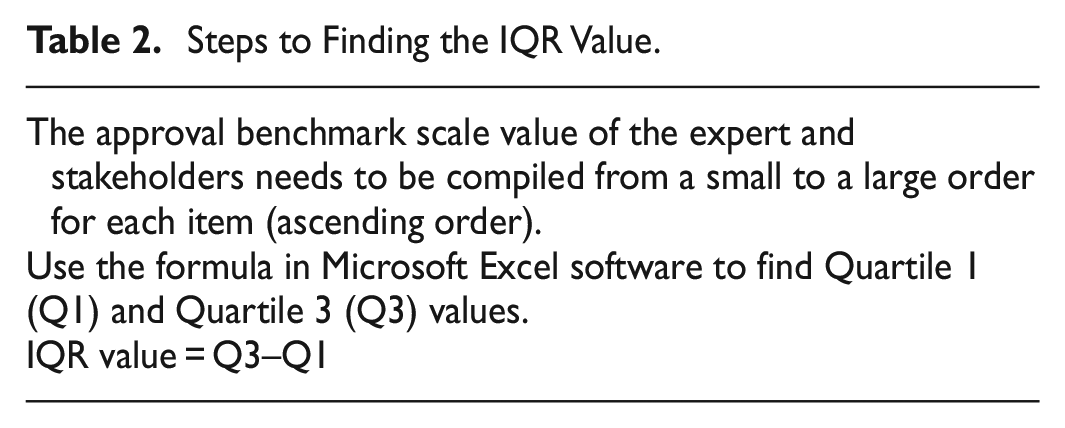
The MDT consists of two important aspects (Subri et al., 2019). The IQR and IQR procedure are used to convert linguistic variables into modified numbers, respectively (Subri et al., 2019). The degree of agreement among experts and stakeholders can be determined (Jubri et al., 2019; Peck & Devore, 2007). When the IQR value is 2 or higher, there is no expert agreement, and the items should be removed (Jubri et al., 2019; Subri et al., 2019). The modified scale has ranges of 0.00 to 1.00 and 1.01 to 1.99 (Peck & Devore, 2007). As a result, Table 2 below provides the IQR steps, Table 3 suggests IQR calulation, and Table 4 represents the formula, as purposed by Jubri et al. (2019) and (Subri et al., 2019).
Steps to Finding the IQR Value.
Steps to Calculation the IQR.

3-Point Modified Likert Scale.

Source. Jubri et al. (2019), Peck and Devore (2007) and Subri et al. (2019).
Six constructs were identified with 31 sets of question statements (items) from the perspective of customers’ expectations after conducting the first stage of MDT, conducting the SERVQUAL literature review (Zeithaml et al., 1990, 1993), and interviewing 10 anonymous experts and stakeholders of the different service organizations of the service sector. These results are shown in Table 5.
A SERVQUAL Lensed Questionnaire From the Perspective of Customer Expectations.

The opinions, remarks, inputs, and relevant benchmarks of 10 randomly chosen anonymous experts and stakeholders on the 6 construct and 31 items of the modified SERVQUAL are presented below from Tables 6 to 11, respectively, in the second stage of the MDT. The third stage of the MDT was used to test accepted items for high levels of agreement between all panel of experts.
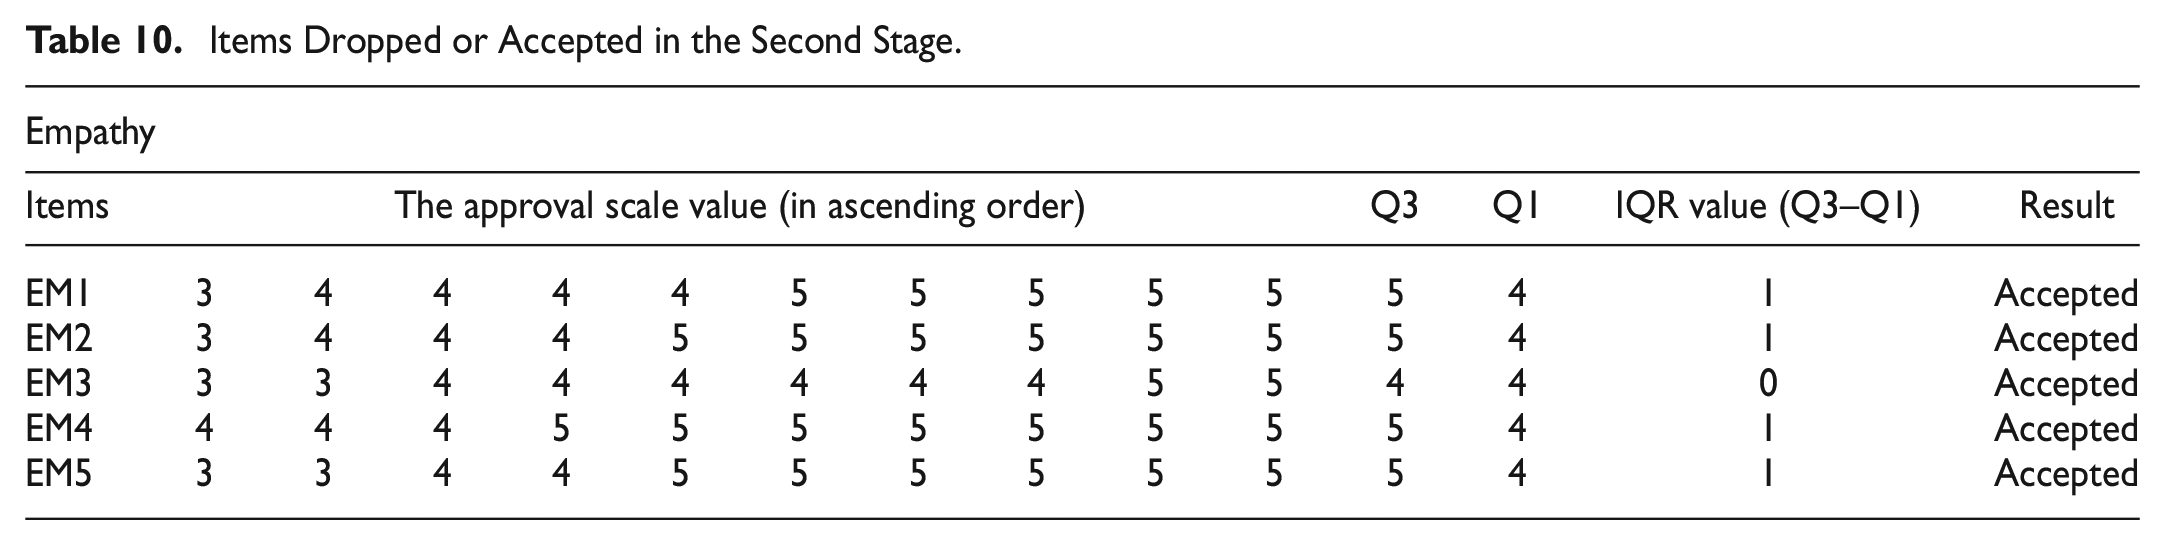
Items Dropped or Accepted in the Second Stage.

Items Dropped or Accepted in the Second Stage.

Items Dropped or Accepted in the Second Stage.

Items Dropped or Accepted in the Second Stage.

Items Dropped or Accepted in the Second Stage.
Items Dropped or Accepted in the Second Stage.

In the second stage of the MDT, the data obtained were analyzed using Microsoft Excel, and all benchmarked ranking numbers were converted to IQR form the ascending order. Taking the IQR value, the researcher found that TA6 from the tangibility construct was ≥2. According to Peck and Devore (2007) items with IQR value ≥2 obtained have no consensus benchmark among the experts and stakeholders on this item. Therefore, TA6 was rejected and removed from the question statement. Similarly, TA1 and TA5 were found moderate high consensus whereas TA2, TA3, and TA4 found strong high consensus among the experts and stakeholders. So, these items were taken from the construct for the third stage of the MDT. Similarly, the researchers found moderate high consensus for four items and strong high consensus in one item of expectation construct, whereas EX3 was rejected in the second stage. It was found that there was no strong high consensus on the “expectation” construct except EX2 among the stakeholders and experts. Therefore, they were not fully agreed on the proposed statement of Zeithaml et al. (1993) and believed more in the external factor of service quality rather than customers’ expectations to measure the service quality of different organizational settings of the service sector. Therefore, it is clear that the core team of hospitality and leisure should focus to improve on the tangible and intangible construct rather than the customers’ expectations.
The research study found that most of the researchers and different scholars more focused to address the issues on the intangible construct rather than a tangible construct to develop the service quality instrument (Bello et al., 2017; Prasad et al., 2014; Tefera & Govender, 2016; Zeithaml et al., 1990, 1993) and quality standard. They proposed that most of the items for service quality question statements are carried out from the intangible construct to measure the service quality, which includes reliability, responsiveness, assurance, and empathy.
In reliability, RL1 and RL5 seem strong high consensus among the experts and stakeholders whereas, RL2, RL3, RL4, and RL6 were found moderate high consensus among the experts and stakeholders of the service sector. Similarly, in responsiveness, RE2 and RE3 found strong high consensus, and RE1, RE4 found moderate high consensus among the experts and stakeholders. In assurance, AS2 and AS3 found strong high consensus, and AS1 and AS4 found moderate high consensus among the experts and stakeholders. Lastly, in the empathy construct, EM3 found strong high consensus and EM1, EM2, EM4, and EM5 found moderate high consensus among the experts and stakeholders of the service sector. Therefore, all of the items were taken for the third stage of the MDT from all intangible constructs to militate high consensus benchmark among the 10 anonymous stakeholders and experts except EX3.
Likewise, in the expectation construct, the IQR value of EX4 shows 4 (Q3) and 3 (Q1) which was less preferable by the experts and stakeholders to measure the service quality. Similarly, EM3 also shows 4 (Q3) and 4 (Q1), which means EM3 also has less worthiness to measure the service quality than other items from the empathy construct. Whereas both items (EX4 and EM3) were taken for the third stage MDT because IQR (Q3–Q1) value was less than 2.
After conducting the second and third stages of MDT, Table 12 shows that all items from the six constructs were present except TA6 and EX3 from the tangibility and expectation constructs, respectively. A strong high consensus benchmark (obtained IQR value of 0.00) from the experts and stakeholders in both stages can be seen in the TA2, TA3, and TA4 from the tangibility construct, RL1 and RL5 from the reliability construct, AS2 from the assurance construct, and EX2 from the expectation construct (altogether seven items) show strong high consensus benchmark from the experts and stakeholders in both stages (second and third stages). After completing both stages of MDT, no items from the constructs of responsiveness and empathy had a strong, high consensus benchmark. After conducting up to the final stage of MDT, the remaining retained items also achieved a high consensus benchmark from the 3-point modified Likert scale (Peck & Devore, 2007). Due to the fact that the IQR values of all accepted items ranged from 0.00 to 1.00, the items from all six constructs listed in Table 12 were kept, with the exception of two items. On the items of question statements, the IQR values between 0.00 and 1.99 represent a high consensus benchmark among the stakeholders and experts (Jubri et al., 2019; Peck & Devore, 2007; Subri et al., 2019). In order to measure the service quality of Nepal’s tourist standard resorts, 29 out of 31 items were included in the actual question statements.
IQR Value of All Items in Stages 2 and 3.

Discussion
Munhurrun et al. (2010) used the SERVQUAL instrument to measure the role of the employee on quality service delivery in a study of call centers in Mauritius. They discovered a significant inverse relationship between overall employee satisfaction and this relationship as well as the specific areas that should directly affect the employee. The SERVQUAL instrument’s applicability, validity, length, and predictive power have all been criticized by Cheng and Rashid (2013), who propose creating new constructs and items to address the shortcomings. As a result, the construct and items of the SERVQUAL were developed by the majority of researchers and academics around the world in accordance with the needs of the study. One of them included the development of an additional two satisfaction and loyalty construct with one and two items on the SERVQUAL instrument, respectively, to measure the service quality in Mauritius from the perspective of the employees’ satisfaction. Munhurrun et al. (2010) accepted five reliability items, three responsiveness items, four assurance and empathy items, and three tangible items. Similar to this, Wong et al. (2012) removed the tangibility construct from the SERVQUAL instrument because it was unrelated to their educational research in Malaysia and instead developed the knowledge and communication constructs with three items (question statements) each. They agreed to accept four items from each of the remaining four SERVQUAL constructs to conduct the study. Similarly, Bello et al. (2017) used the SERVQUAL instrument’s items for item refinement and modification to measure the impact of service quality in Nigerian hotels. As a result, there is broad agreement among experts in services marketing that Zeithaml et al.’s modified. SERVQUAL instrument has a long history of use in the literature to assess service quality in the hospitality and service industries. In this paper, 10 anonymous experts and stakeholders of the MDT were interviewed, and the researchers also conducted an additional “expectation” construct on the SERVQUAL instrument from the first stage of literature review (Zeithaml et al., 1993). According to the requirements of the study, the same process was used to modify and add construct and items.
Conclusions and Implications
The MDT is similar to the Delphi technique in terms of the conducting process. The construct and items must consider all experts and stakeholders’ comments, advice, and viewpoints. Researchers can learn from this process how to improve the quality of services by changing and refining the services. The main purpose of this study is to determine the necessary criteria and measures for the hospitality and service industry, especially for the resorts in Nepal, to improve service quality. As a result, it is essential that policymakers for service organizations, particularly those in the hospitality and leisure sectors, take into account the needs that fall under the reliability, tangibility, responsiveness, assurance, expectation, and empathy constructs. The responsiveness, assurance, and empathy construct, which is the main objective of human resource management to foster the performance of the service organization, contains items whose requirements can also be used to determine employees’ core needs. The tourism, hospitality, and leisure sectors’ investment is significant in Nepal. High service quality is crucial to boost the country’s Gross Domestic Product (GDP) and advertise the destination of service sectors. Therefore, it is imperative that this study, using the SERVQUAL instrument lenses, pinpoint the concepts and components that make up the service quality of the resorts in Nepal.
In conclusion, service quality in resorts refers to the overall level of satisfaction that guests experience during their stay. This includes factors such as the friendliness and helpfulness of staff, the cleanliness and condition of the resort, the availability of amenities and activities, and the efficiency of check-in and check-out processes. To maintain high levels of service quality, resorts must strive to meet and exceed the expectations of their guests, and should focus on attention to detail, responsiveness, personalization, flexibility, and consistency in all aspects of their operations.
Likewise, future research on the application of contextualized SERVQUAL instruments can be used in other contexts and/or sectors such as other hospitality, healthcare, hospital, banking, insurance, public service, and academia in Nepal.
Footnotes
Appendix I
Appendix II
Appendix III

| Result of modified Delphi techniques (third stage) | ||||||||||||||
|---|---|---|---|---|---|---|---|---|---|---|---|---|---|---|
| Items | The approval scale value (in ascending order) | Q3 | Q1 | IQR value (Q3–Q1) | Result | |||||||||
| Tangibility | ||||||||||||||
| TA1 | 2 | 2 | 4 | 5 | 5 | 5 | 5 | 5 | 5 | 5 | 5 | 4 | 1 | Accepted |
| TA2 | 4 | 5 | 5 | 5 | 5 | 5 | 5 | 5 | 5 | 5 | 5 | 5 | 0 | Accepted |
| TA3 | 4 | 5 | 5 | 5 | 5 | 5 | 5 | 5 | 5 | 5 | 5 | 5 | 0 | Accepted |
| TA4 | 4 | 5 | 5 | 5 | 5 | 5 | 5 | 5 | 5 | 5 | 5 | 5 | 0 | Accepted |
| TA5 | 4 | 4 | 4 | 5 | 5 | 5 | 5 | 5 | 5 | 5 | 5 | 4 | 1 | Accepted |
| Reliability | ||||||||||||||
| RL1 | 4 | 4 | 5 | 5 | 5 | 5 | 5 | 5 | 5 | 5 | 5 | 5 | 0 | Accepted |
| RL2 | 4 | 4 | 5 | 5 | 5 | 5 | 5 | 5 | 5 | 5 | 5 | 5 | 0 | Accepted |
| RL3 | 4 | 4 | 4 | 5 | 5 | 5 | 5 | 5 | 5 | 5 | 5 | 4 | 1 | Accepted |
| RL4 | 4 | 4 | 5 | 5 | 5 | 5 | 5 | 5 | 5 | 5 | 5 | 5 | 0 | Accepted |
| RL5 | 4 | 5 | 5 | 5 | 5 | 5 | 5 | 5 | 5 | 5 | 5 | 5 | 0 | Accepted |
| RL6 | 4 | 4 | 5 | 5 | 5 | 5 | 5 | 5 | 5 | 5 | 5 | 5 | 0 | Accepted |
| Responsiveness | ||||||||||||||
| RE1 | 4 | 4 | 4 | 4 | 5 | 5 | 5 | 5 | 5 | 5 | 5 | 4 | 1 | Accepted |
| RE2 | 4 | 4 | 4 | 4 | 5 | 5 | 5 | 5 | 5 | 5 | 5 | 4 | 1 | Accepted |
| RE3 | 4 | 4 | 4 | 5 | 5 | 5 | 5 | 5 | 5 | 5 | 5 | 4 | 1 | Accepted |
| RE4 | 3 | 3 | 4 | 4 | 4 | 5 | 5 | 5 | 5 | 5 | 5 | 4 | 1 | Accepted |
| Assurance | ||||||||||||||
| AS1 | 4 | 4 | 4 | 4 | 4 | 5 | 5 | 5 | 5 | 5 | 5 | 4 | 1 | Accepted |
| AS2 | 4 | 4 | 5 | 5 | 5 | 5 | 5 | 5 | 5 | 5 | 5 | 5 | 0 | Accepted |
| AS3 | 4 | 4 | 4 | 5 | 5 | 5 | 5 | 5 | 5 | 5 | 5 | 4 | 1 | Accepted |
| AS4 | 2 | 3 | 4 | 4 | 4 | 4 | 5 | 5 | 5 | 5 | 5 | 4 | 1 | Accepted |
| Empathy | ||||||||||||||
| EM1 | 3 | 4 | 4 | 4 | 5 | 5 | 5 | 5 | 5 | 5 | 5 | 4 | 1 | Accepted |
| EM2 | 3 | 3 | 4 | 4 | 5 | 5 | 5 | 5 | 5 | 5 | 5 | 4 | 1 | Accepted |
| EM3 | 3 | 3 | 4 | 5 | 5 | 5 | 5 | 5 | 5 | 5 | 5 | 4 | 1 | Accepted |
| EM4 | 4 | 5 | 5 | 5 | 5 | 5 | 5 | 5 | 5 | 5 | 5 | 5 | 0 | Accepted |
| EM5 | 3 | 4 | 4 | 4 | 5 | 5 | 5 | 5 | 5 | 5 | 5 | 4 | 1 | Accepted |
| Expectation | ||||||||||||||
| EX1 | 2 | 4 | 4 | 4 | 5 | 5 | 5 | 5 | 5 | 5 | 5 | 4 | 1 | Accepted |
| EX2 | 4 | 5 | 5 | 5 | 5 | 5 | 5 | 5 | 5 | 5 | 5 | 5 | 0 | Accepted |
| EX3 | 2 | 3 | 4 | 4 | 4 | 4 | 4 | 5 | 5 | 5 | 5 | 4 | 1 | Accepted |
| EX4 | 2 | 4 | 4 | 4 | 4 | 4 | 5 | 5 | 5 | 5 | 5 | 4 | 1 | Accepted |
| EX5 | 2 | 4 | 4 | 4 | 5 | 5 | 5 | 5 | 5 | 5 | 5 | 4 | 1 | Accepted |
Acknowledgements
Our sincere gratitude goes out to the anonymous reviewers who assisted us in reshaping the paper and making it publishable. After being submitted to SAGE Open, some section of the paper was presented at the one of the international conferences on November 2022. We appreciated the feedback provided by the conference attendees. Likewise, we would like to thank all the experts and stakeholders who contributed to contextualizing SERVQUAL instrument for Nepali resorts using MDT. Finally, we want to express our gratitude to everyone who has offered direct or indirect support.
Declaration of Conflicting Interests
The author(s) declared no potential conflicts of interest with respect to the research, authorship, and/or publication of this article.
Funding
The author(s) received no financial support for the research, authorship, and/or publication of this article.
Availability of Data
The corresponding author will provide the information supporting the study’s conclusions upon a reasonable request.