
Abstract
Poverty is a common challenge faced by human beings. China’s Targeted Poverty Alleviation (TPA) policy provides the international community with a Chinese solution to poverty governance. Based on the goal of China’s TPA policy of “Two No Worries, Three Guarantees,” this paper selects appropriate indicators to evaluate the implementation effect of China’s TPA policy since 2013. The results show that there are significant differences between poor families and non-poor families in food consumption, clothing consumption, education, and housing. After the implementation of the TPA policy, the gap between poor families and non-poor families has been significantly reduced. However, from the perspective of per capita household consumption, there is still a certain gap between poor families and non-poor families, and it is still necessary to maintain the continuity to further improve the living standards of low-income families.
Keywords
Introduction
Poverty is a common challenge faced by human beings, and the eradication of poverty is the common goal and important mission of human society. The United Nations 2030 agenda for sustainable development takes poverty reduction as its top priority. In recent decades, although remarkable progress has been made in global poverty reduction, there are still great challenges to achieve the goal of eliminating all forms of poverty by 2030. Regional conflicts, shortage of infrastructure and public services, climate change, food crisis, and gender inequality in many countries all pose great challenges to poverty reduction. The COVID-19 that sweeping the world is also likely to engulf or even reverse global efforts in the past period which is dedicated to eradicating poverty. The World Institute for Development Economics Research warned that the epidemic situation of global pandemic could lead to the first increase in the incidence of global poverty in 30 years since 1990. David Malpass, the world bank president, also said that COVID-19 could cause 100 million people to fall into extreme poverty. The longer it lasts, the more people will fall into extreme poverty. China’s TPA policy provides the international community with a Chinese solution to poverty governance, the main content of this policy is to identify the poor according to the per capita income level of families, and then through a series of assistance strategies to realize that these families do not worry about food and clothing, and guarantee their access to compulsory education, basic medical treatment and housing safety. The above goals are abbreviated as “Two No Worries, Three Guarantees” by the Chinese government, which are also the core indicators for the Chinese government to measure the results of poverty alleviation.
Delineating a poverty line is one of the easiest ways to identify poverty. In 2011, the World Bank set the International Poverty Line (IPL) at $1.90 per day, which has also been proved to be robust in the measurement of extreme poverty in low-income countries (Jolliffe & Prydz, 2016), Chauhan et al. (2016) also used the extent of money metric poverty to assess poverty and inequality in India. However, poverty lines are typically higher in richer countries, and lower in poorer ones, reflecting the relative nature of national assessments of who is considered poor (Jolliffe & Prydz, 2021). Following Townsend’s concept of relative deprivation, poverty analysis is currently undergoing a multidimensional turn, more and more literatures begin to emphasize multidimensional analysis of poverty (Townsend, 2010). For example, Dhongde and Haveman (2022) analyzed multidimensional poverty in the United States over the last decade, and Datt (2019) studied the case for distribution-sensitive multidimensional poverty measures. In addition, some studies studied the vulnerability of poverty, long-term poverty and child poverty (Bolch et al., 2023; Koomson et al., 2020; McLaughlin & Rank, 2018; Mohamoud et al., 2021). In China’s TPA policy, based on the poverty line of the world bank, the government sets the per capita household net income at 2,300 yuan per year as the standard for measuring whether the family is poor (Dai et al., 2020; Li et al., 2021; Liao et al., 2021).
As the understanding of poverty turns to multidimensional, more and more people begin to focusing on the many ways in which human life can be impoverished and not just on material poverty (Hick, 2016). Saunders et al. (2022) compare the monetary and living standards approaches to poverty using Australian data to highlight the conceptual and empirical strengths and weaknesses of the two approaches, even this method of measuring poverty using living standards has been used to measure the difference in living standards between spouses in families (Cantillon, 2013). There are also some literatures that select some indicators in life for analysis. For example, Carr-Hill (2017) used acquisition capacity of water and electricity to analyze the poverty capture capacity in Kenya, Tanzania and Uganda. Bradbury and Saunders (2022) also considered the impact of housing costs to analyze poverty. These studies considered the factors of life when identifying poverty. Although China’s TPA policy also emphasizes the governance of living standards such as “Two Worries and Three Guarantees,” the government did not pay special attention to factors other than income in identifying poverty in the early stage.
China’s TPA policy tries to realize the “Two No Worries, Three Guarantees” for poor families, that is, to realize that poor families do not worry about food and clothing, and guarantee their access to compulsory education, basic medical treatment, and housing safety. Therefore, the evaluation of TPA policy effect also needs to be carried out from the aspects of food, clothing, education, medical treatment, and housing. The existing literature analyzes the poverty alleviation effect of some of these factors. For example, Paudel Khatiwada et al. (2017) analyzed the impact of improving education and infrastructure on poverty reduction in the rural areas of central Nepal. Pattayat et al. (2022) analyzed the role of the provincial states of India in alleviating poverty by promoting education, health, finance and insurance. Asadullah and Ara (2016) analyzed the impact of providing a one-off transfer of livestock assets to poor women in Bangladesh on food security, household savings and assets. For the poverty alleviation effect during China’s TPA policy, Zhang and Zhou (2019) analyzed the impact of TPA policy on poor families from the aspects of total income and total consumption. Yin and Guo (2021) divided the improvement of consumption of poor families into survival consumption and development consumption. Wang et al. (2019) analyzed the impact on housing conditions, infrastructure, and public services.
The above literature provides a methodological reference for evaluating the effect of China’s TPA policy. In view of the fact that the Chinese government has been carrying out poverty governance around the goal of “Two No Worries, Three Guarantees” in recent years, the indicators for evaluating the effect of TPA policy should be selected according to this goal. However, the existing analysis on the effect of China’s TPA policy only analyzes from some dimensions such as food and housing, and does not comprehensively evaluate the realization of the goal of “Two No Worries, Three Guarantees” after the implementation of TPA policy. By selecting the indicators of poor families in food, clothing, education, medical treatment, and housing, this paper analyzes the implementation effect of TPA policy, so that more people can understand the poverty alleviation effect of China, and also provide reference for poverty governance in the world.
Data Sources and Empirical Strategies
Data Sources
This paper uses the panel data of China Family Panel Studies (CFPS) from 2010 to 2018 to evaluate the effect of TPA policy. The main reason for selecting this database is that it is one of the most representative databases at the family level in China, and can contain the data of 2010 and 2012 before the implementation of the TPA policy, and the data of 2014, 2016, and 2018 after the implementation of the TPA policy in 2013. At the same time, because the evaluation of this paper is mainly aimed at the performance of Chinese rural families in “Two No Worries, Three Guarantees,” the questionnaire of CFPS covers the contents of families in food, clothing, education, housing, and other aspects, which is convenient for us to select the appropriate representative variables. Since the governance focus of China’s poverty alleviation period is mainly concentrated in rural areas, this paper only retains the data from rural areas, and deletes a small number of missing data. Finally, a total of 5 periods of 6541 family level observations are obtained. Due to the fact that the relevant data of 2020 have not been published in all major databases, the data for evaluating the effect of TPA policy in this paper only covers 2018. In addition, due to the fine-tuning of the CFPS questionnaire, few variables were not investigated in 2010, but only in 2012. Therefore, some indicators only use the data from 2012 to 2018, but such indicators also include the data before and after 2014, which still meets the evaluation requirements of the TPA policy.
Model Setting and Variable Selection
In order to evaluate the effect of TPA from the perspective of “Two No Worries, Three Guarantees,” the following panel regression model is constructed, and multiple dependent variables are selected to measure the governance effect of “Two No Worries, Three Guarantees” respectively
where,
In terms of explanatory variables, the core explanatory variables are
Variable Selection Description.

Table 2 shows the expected impact of each explanatory variable on each dependent variable. The plus sign indicates the positive impact and the minus sign indicates the negative impact.
The Expected Impact of Each Explanatory Variable on Each Dependent Variable.

In Table 2, we should pay more attention to the coefficients of
Descriptive Statistics
Figure 1 shows the mean value changes of the total sample and the sample of poor families in different years in terms of different dependent variables. The solid line represents the mean value of the total sample, and the dotted line represents the poor families whose per capita net income is lower than the comparable price of 2,300 yuan in 2010. By observing the dependent variables, we can find that the proportion of food expenditure of poor families is significantly higher than that of the total sample, which shows that the Engel coefficient of poor families is higher, reflecting that the proportion of food expenditure of poor families is larger, which squeezes the consumption of poor families in other aspects. At the same time, the proportion of medical and health expenditure of poor families is also significantly higher than the average level. The possible reason is that diseases often cause a family to increase medical expenditure and reduce labor force, which makes it easier to fall into poverty, resulting in poor families showing a higher proportion of medical expenditure. From the per capita consumption level, the consumption level of poor families is significantly lower than the average level, which is in line with the prediction that the consumption level of poor families is lower. However, from the image, this gap has a narrowing trend, indicating that with the implementation of the TPA policy, the average consumption level of poor families has been improved more significantly than that of the overall families, but this change needs to be verified by further regression results. In addition to the per capita consumption level, the proportion of such consumption of poor families is lower than the average level in terms of clothing expenditure, culture, education and entertainment expenditure, education expenditure and other higher-level consumption needs, which indicates that the excessive food consumption of families has squeezed out the proportion of consumption in education and entertainment, and the consumption structure of poor families needs to be improved. However, from the perspective of medical expenditure, water and electricity expenditure and per capita housing area of families, the growth trend of poor families after 2014 is more obvious, which shows that poor families have been improved in these aspects during the TPA policy’ implementation, but the specific impact results also need to be quantitatively analyzed through further regression results.

Annual mean value change of each explained variable: (a) proportion of food consumption, (b) proportion of clothing consumption, (c) logarithm of household per capita consumption, (d) proportion of expenditure on culture, education, and entertainment, (e) proportion of healthcare expenditure, (f) proportion of education expenditure, (g) proportion of water and electricity expenditure, (h) housing area per capita (m2/person).
Table 3 shows the descriptive statistics of the control variables. The mean value of
Descriptive Statistics of Control Variables.

Empirical Results and Robustness Test
Effect Evaluation of TPA in “Two No Worry”
When evaluating the governance effect of TPA on “not worrying about food and clothing.” the proportion of food consumption expenditure in total expenditure and the proportion of clothing, shoes and hats consumption in total expenditure are selected. The regression results are shown in the first two columns of Table 4. In terms of the proportion of food consumption in total expenditure, the proportion of food consumption of poor families is significantly higher than that of non-poor families, which is consistent with the higher Engel coefficient of poor families. Because food consumption is a family’s rigid expenditure, higher food expenditure will crowd out the family’s expenditure on entertainment, education, healthcare, and other aspects, thus limit the family’s life improvement and long-term investment. After 2014, the proportion of food consumption of poor families decreased by 1.47%, which means that since the implementation of TPA policy in 2013, the burden of food consumption of poor families has decreased significantly.
The Regression Results of the Effect Evaluation of TPA in “Two No Worries.”

Note. The brackets are standard errors. *, **, and *** are significant at the levels of 0.1, 0.05, and 0.01, respectively.
From the perspective of the proportion of clothing, shoes and hats consumption in total expenditure, the consumption of clothing, shoes and hats of poor families is significantly lower than that of non-poor families, which reflects the low consumption ability of poor families in clothing. At the same time, although the interaction coefficient is positive, it is not significant, which indicates that the poor families have not significantly increased their consumption of clothing, shoes and hats after the implementation of the TPA policy. The possible reason is that the clothes, shoes, and hats of poor families have met the needs of daily life, and their purchasing habits have certain inertia. Although their life has been improved, their main consumption ability has not been reflected in the clothing consumption. Moreover, with the growth of the overall consumption of poor families, even if the same proportion of clothing consumption expenditure is maintained, the amount of clothing consumption of poor families will also increase. Therefore, this paper will further analyze the impact of TPA policy on per capita consumption of families.
From the regression results in the last column of Table 4, the per capita consumption level of the poor is 14.3% lower than that of the non-poor families, and it is significant at the level of 0.01, which indicates that there is a certain gap between the per capita consumption level of the poor families and the non-poor families. However, the interaction coefficient is 0.0654, which is significant at the level of 0.01, indicating that the consumption gap between poor families and non-poor families has been significantly narrowed after the implementation of the TPA policy. Apart from that, the TPA policy reduces the proportion of food consumption of poor families, even the proportion of food consumption of poor families is lower than that of non-poor families after the implementation. This may be due to the fact that the government provides some life necessities through temporary assistance and minimum living security to needy families. Besides, from the perspective of per capita consumption of families, although the gap between per capita consumption of poor families and non-poor families has decreased by 6.54% after the implementation of the TPA policy, there is still a certain gap compared with the 14.3% difference between poor families and non-poor families, which indicates that it is still necessary to maintain policy coherence, continue to promote poverty alleviation policies, and further enhance the sense of acquisition of low-income families. From the perspective of control variables, the health level of the head of household has a significant impact on food consumption, clothing consumption and household per capita consumption. The higher the educational level of the head of household is, the higher the per capita consumption of the household is. The older the head of household is, the lower the proportion of food consumption is, which is consistent with the change of dietary habits of the elderly. In terms of the gender of the head of household, the proportion of food consumption of male head of household is significantly higher, and the per capita household consumption is 7.61% higher, which reflects that the female head of household can better reflect the characteristics of “diligent and thrifty.”
Effect Evaluation of TPA in “Three Guarantees”
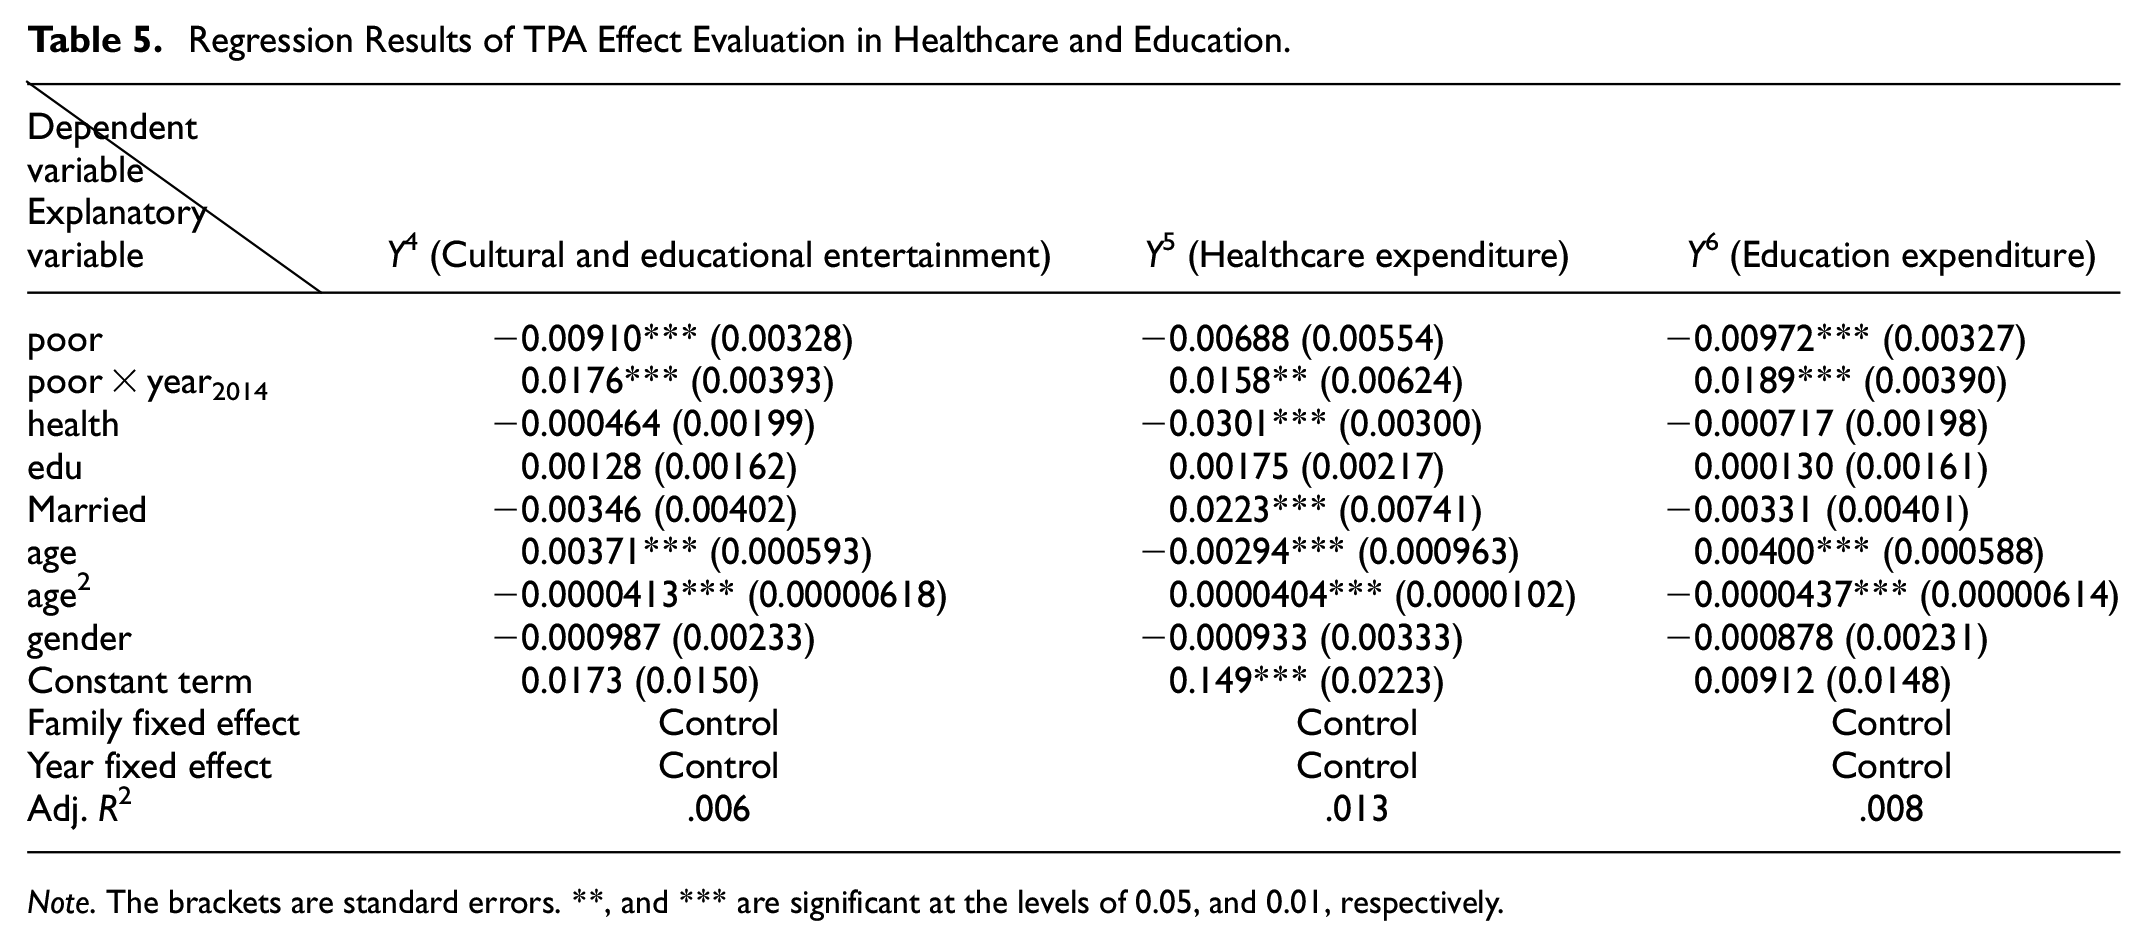
Through the analysis of the impact of TPA policy on household food, clothing, and per capita consumption, on the one hand, it is confirmed that TPA policies promote the per capita consumption of poor families; on the other hand, it shows that TPA policy can significantly reduce the proportion of families in food consumption, which indicates that the TPA policy may promote the consumption of poor families in higher demand levels such as education, clothing, and per capita consumption. Therefore, before evaluating the effect of TPA in terms of “three guarantees,” the impact of TPA policy on the overall cultural, educational, and entertainment expenditures of poor families should be analyzed first. The empirical results are shown in the first column of regression results in Table 5.
Regression Results of TPA Effect Evaluation in Healthcare and Education.
Note. The brackets are standard errors. **, and *** are significant at the levels of 0.05, and 0.01, respectively.
From the perspective of overall expenditure on culture, education and entertainment, the consumption proportion of poor families in culture, education, and entertainment is significantly lower than that of non-poor families. However, after the implementation of the TPA policy, the expenditure of poor families in culture, education, and entertainment has increased significantly, which is confirmed by the decrease in the proportion of food consumption of poor families and the improvement in the average consumption level of families. This further shows that poor families not only increase their income, but also improve their consumption structure through TPA policy. The increase of expenditure on culture, education, and entertainment of poor families can not only make poor families feel a sense of gain, but also promote the growth of family human capital, which is conducive to the long-term development of families.
As for the healthcare expenditure and education expenditure of “Three Guarantees,” the second column of Table 5 shows the effect of TPA policy on the proportion of healthcare expenditure. The results show that there is no significant difference between poor families and non-poor families in the proportion of healthcare expenditure, which shows that poor families and non-poor families tend to spend the same proportion on healthcare. Although the proportion is the same, the low consumption level of poor families means that if poor families and non-poor families face the same large medical expenditures, the healthcare expenditure of poor families is not enough to cover the basic medical needs of families, which may lead to poor families giving up treatment in the case of serious illness. After the implementation of the TPA policy, the healthcare expenditure of poor families has increased significantly, which will help poor families improve their healthcare and achieve the governance effect of ensuring basic healthcare. The third column shows the effect of the TPA policy on the proportion of education expenditure. Different from the fact that there is no significant difference in the proportion of healthcare expenditure among different families, the proportion of education expenditure of poor families is significantly lower than that of non-poor families, but the same thing is that after the implementation of the TPA policy, the poor families’ education expenditure has also been significantly improved, which shows that the TPA policy can also help poor families increase their education expenditure. At the same time, after the implementation of TPA policy, the growth of education expenditure of poor families is greater than the difference between poor families and non-poor families. Maintaining this trend will also help poor families to increase education expenditure and increase human capital investment, so as to promote the long-term development ability of families and contribute to the sustainability and stability of poverty alleviation effect. At the same time, after the implementation of TPA policy, the growth of education expenditure of poor families is greater than the group difference between poor families and non-poor families. Maintaining this trend will also help poor families to increase education expenditure and increase human capital investment, so as to promote the long-term development ability of families and contribute to the sustainability and stability of poverty alleviation effect. From the perspective of control variables, good health of the head of household can significantly reduce the proportion of healthcare expenditure, which is consistent with the expectation. Meanwhile, the age of the head of household and the square of age are significant in the three regression results, but the proportion of cultural, education, entertainment, and education expenditure increases with the increase of the age of the head of household, while the proportion of healthcare expenditure decreases with the increase of the age of the head of household.
Finally, we select two housing indicators to evaluate the last aspect of “Three Guarantees,” and the results are shown in Table 6. From the perspective of monetization hydropower expenditure indicators, there is no significant difference in the proportion of hydropower expenditure between poor families and non-poor families. However, after the implementation of TPA policy, the hydropower expenditure of poor families has increased significantly, which also shows that the quality of life of poor families has been improved significantly. In addition, this paper also selects the per capita housing area as a non-monetary measurement index for further verification. The results show that the per capita housing area of poor families is 4.07 square meters smaller than that of non-poor families, but after the implementation of the TPA policy, the gap has narrowed by 2.45 m2, reflecting the obvious improvement of poor families in housing.
Regression Results of TPA Effect Evaluation in Housing.

Note. The brackets are standard errors. *, **, and *** are significant at the levels of 0.1, 0.05, and 0.01, respectively.
According to the results of the control variables of the regression of the housing index, the per capita housing area of the head of household after marriage decreased significantly by 4.67 square meters, which may be related to the increase of the population. With the increase of the age of the head of household, young children go out to work or form a new family, which reduces the family population, resulting in the reverse change between the age of the head of household and the housing area.
At the same time, the regression results of the two control variables on the proportion of water and electricity expenditure are not significant, so the influence of the age of the head of household and marriage on the per capita housing area is likely only caused by the change of family members, which can not explain the improvement of the housing environment. In addition, the gender of the head of household also has a significant impact on the two indicators. The proportion of water and electricity of male head of household is significantly lower, but the per capita housing area of male head of household is significantly higher than that of female head of household.
Robust Test
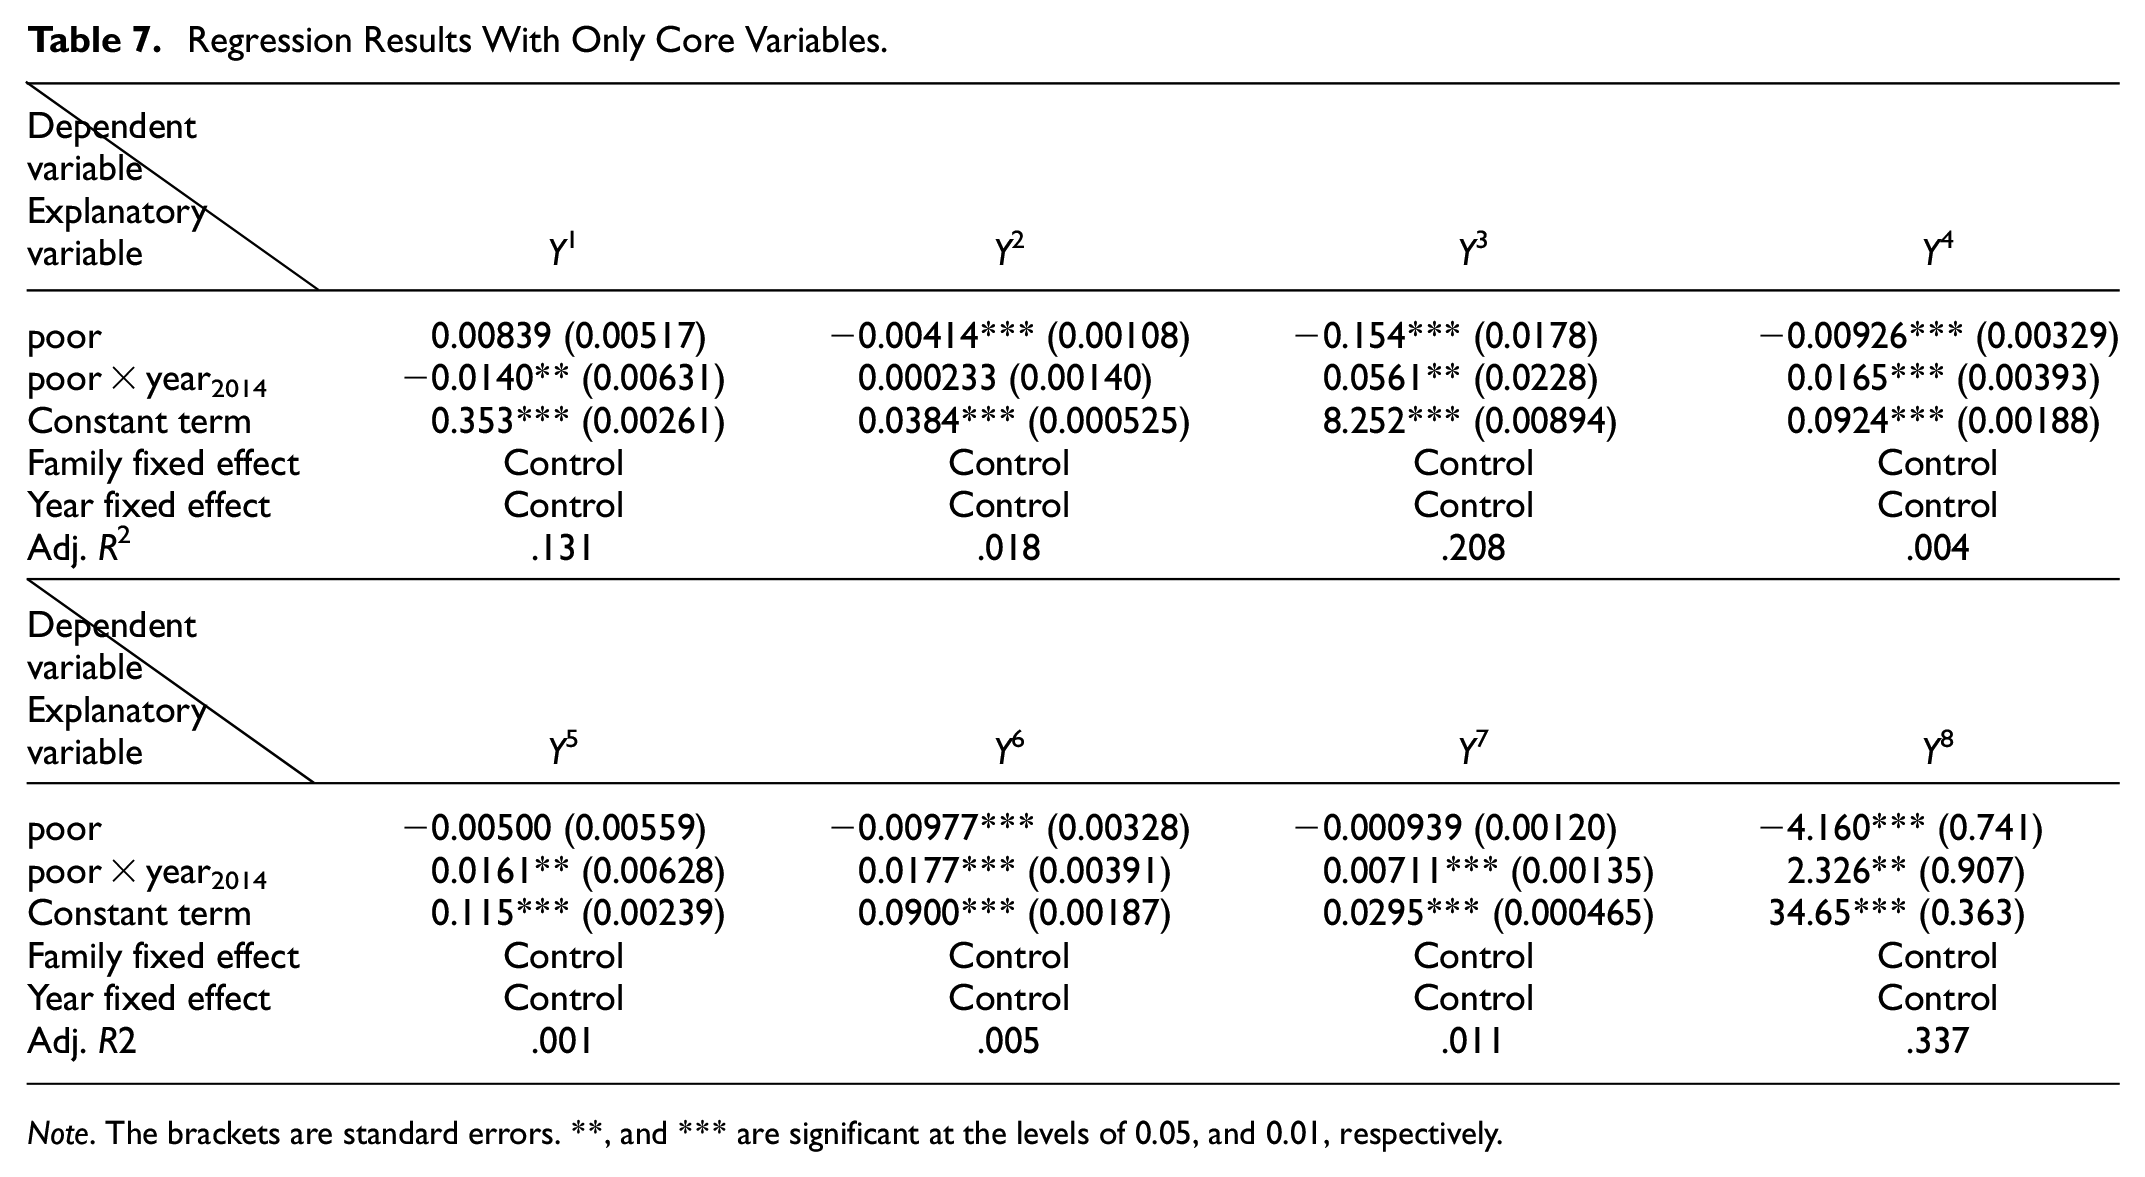
In order to verify the robustness of the TPA policy in the governance effect of “Two No Worries, Three Guarantees,” this paper first verifies the regression results of all dependent variables without control variables, and the results are shown in Table 7. By comparing the regression results of the core variables in Tables 4 to 6, it is found that the regression results are basically consistent with the previous regression results when only two core variables are included. Except for the food expenditure, poor families are significantly lower than non-poor families in clothing consumption, per capita consumption, culture, education, and entertainment expenditure, per capita housing area and so on. From the results, the signs of these eight dependent variables are the same as the former when the control variable is added, which shows that the governance effect of the TPA policy is robust in the aspects of “Two no Worries, Three Guarantees.”
Regression Results With Only Core Variables.
Note. The brackets are standard errors. **, and *** are significant at the levels of 0.05, and 0.01, respectively.
Secondly, the dependent variables that can be measured monetarily are substituted in this paper to verify the robustness of the results. The original dependent variables are analyzed by calculating the proportion of food, clothing, education and other expenditures in the total household expenditures, which includes relatively stable parts such as transfer expenditures, welfare expenditures and mortgage expenditures. Therefore, in order to verify the stability of the results, we exclude these relatively stable parts, then divide the expenditure on food, clothing, education and the others by household consumption expenditure, recalculate the dependent variables and carry out regression. The regression results are shown in Table 8. By replacing the dependent variables, it is found that the regression results of the core variables are consistent with the results calculated according to the proportion of expenditure, which further verifies the robustness of the results.
Regression Results of Changing Expenditure Proportion to Consumption Proportion.

Note. The brackets are standard errors. *, **, and *** are significant at the levels of 0.1, 0.05, and 0.01, respectively.
Finally, this paper further verifies the scientificity of the results by redefining the generation mode of poor families. In view of the fact that some scholars put forward that poverty measured by income has certain limitations, the consumption capacity of a family can better reflect the living poverty status of a family. Therefore, families whose consumption level is lower than 1/4 quantile are set as poor families in this paper. After distinguishing poor families according to consumption level, regression is conducted for each dependent variable again, and the results are shown in Table 9. From the result of interaction term, after the implementation of TPA policy, for families with low consumption level, the proportion of food consumption expenditure decreased significantly, while the healthcare expenditure, water and electricity expenditure and per capita housing area increased significantly, which was consistent with the regression results based on the per capita net income of families. However, in terms of the proportion of education expenditure, the regression results show a symbolic difference, which may be because the groups with lower consumption have lower consumption motivation, and the implementation of TPA policy promotes their consumption in healthcare, housing and other aspects. However, educational investment, as an investment method with insignificant short-term returns, is more difficult for families accustomed to low-level consumption to make changes. Therefore, as the overall level of consumption rises, the proportion of education expenditure falls rather than rises.
Regression Results of Changing Selection Way of Poor Families.

Note. The brackets are standard errors. *, **, and *** are significant at the levels of 0.1, 0.05, and 0.01, respectively.
Heterogeneity of the Impact of TPA Policy on Different Income Families
Considering that some existing studies have confirmed that policies such as basic healthcare and financial inclusion are more effective for the more affluent groups in poverty alleviation, and there is a phenomenon of “target upward shift” in poverty governance, so we divide the poor families into five groups according to their per capita net income, and the average of per capita net income among different groups gradually increases, as shown in Table 10. It can be seen that there is a large gap between the highest and the lowest family per capita net income. The average of per capita net income of the lowest group (comparable price in 2010) is only 158.15 yuan, while the highest group is 2,035.42 yuan, which is less different from the poverty line of 2,300 yuan. The ensemble average value of poor families is 1,082.97 yuan, which is close to 50% of the poverty line. This paper evaluates the difference of governance effect of different income levels of poor families in different aspects of TPA policy by introducing interactive terms. If there are differences in the effect of TPA policy among different per capita net income families, the coefficient of interactive terms is significant. The regression results are shown in Table 11.
Per Capita Net Income of Poor Families in the Five Equal Groups (Comparable in 2010, Unit: Yuan).

Regression Results of Grouping.

Note. The brackets are standard errors. *, **, and *** are significant at the levels of 0.1, 0.05, and 0.01, respectively.
Taking the highest income group families as the benchmark group, there is no significant difference in the improvement of education expenditure, water and electricity expenditure and per capita housing area of poor families in the TPA policy, which indicates that both the lower income and slightly higher income poor families have achieved significant improvement in education and housing in the TPA policy.
In terms of food expenditure, compared with the poor families in the highest income group, the proportion of food consumption expenditure in the lowest income group and the second highest income group decreased more significantly after the implementation of the TPA policy. The families with the lowest income level are the key governance objects of the TPA policy. After the implementation of the TPA policy, the government can meet part of the food consumption of the families with the lowest income level through various forms of physical subsidies. Therefore, compared with the higher income groups, the proportion of the decline in food expenditure is larger, while for the families with medium poverty level, there is no significant difference between the proportion of food consumption expenditure and the highest income families.
In terms of the proportion of healthcare expenditure, compared with the families with the highest income group, the increase of healthcare expenditure of the poor families with the lowest income and the sub-lower income group is more obvious, which shows that the TPA policy is more conducive to the low-income families in the process of increasing the medical security of the poor families, which helps the families with the most severe poverty to enjoy better medical services and alleviate the large gap in medical expenditure of low-income families.
Conclusions
Under the background of China’s complete elimination of absolute poverty and turning to comprehensive promotion of rural revitalization, it is of great significance for countries all over the world to review and evaluate the effectiveness of China’s TPA, summarize and learn from China’s poverty governance, and draw lessons from China’s poverty governance.
Based on the panel data of CFPS database from 2010 to 2018, and according to “Two No Worries, Three Guarantees,” the goal of China’s TPA, this paper selects representative indicators of various aspects for evaluation. The main conclusions are as follows: First, there are significant differences between poor families and non-poor families in food consumption, clothing consumption, education, housing, and so on. The main manifestation is that the poor families have a higher proportion of food consumption, which limits the poor families to have a higher level of consumption. At the same time, the poor families spend less on clothing, education, and so on, the per capita consumption level of the families is obviously lower, and the per capita housing area is also smaller. All these reflect that compared with the non-poor families, the quality of life of the poor families is relatively poor. Second, since China put forward the TPA policy in 2013, poor families have been improved in food consumption, medical care, education, housing, and other aspects, and the gap between poor families and non-poor families has gradually narrowed in these aspects, which helps poor families gradually narrow the gap with non-poor families. However, in terms of clothing, after the implementation of the TPA policy, the consumption structure of poor families has not changed significantly. At the same time, although the per capita consumption of poor families has increased, there is still a certain gap between them and non-poor families. Third, from the perspective of the improvement differences of families with different poverty levels after the implementation of the TPA policy, the TPA policy is more balanced in improving the education and housing of poor families. Taking the highest per capita net income family group as the benchmark, there is no “target upward shift” phenomenon that is more conducive to relatively rich families. On the contrary, in terms of food consumption expenditure and medical expenditure, families with the lowest income group benefit more significantly from the TPA policy, which shows that there is no “target upward shift” phenomenon of TPA policy in these two aspects, but it is more conducive to low-income families. Based on the above research conclusions, it reflects that China’s TPA policy has a certain positive role in realizing the “Two No Worries, Three Guarantees” of poor families, but it needs to be further strengthened in protecting the clothing of poor families. At the same time, in terms of per capita consumption level, there is still a certain gap between poor families and non-poor families, which indicates that China still needs to maintain the coherence of poverty alleviation policies and further improve the living standards of low-income families.
For other countries, especially the developing countries with severe poverty situation, they can draw lessons from China’s poverty alleviation goal of “Two No Worries, Three Guarantees,” give priority to protecting the consumption needs of poor families in food, clothing, housing, and other aspects, and evaluate the poverty alleviation effect of their countries in combination with the actual situation of their countries and the implementation of China’s TPA policy, so as to better achieve the common goal of eliminating poverty. However, limited to the availability of data, when evaluating the effect of TPA policy, this paper can only obtain the household panel data from 2010 to 2018. Especially in 2021, the Chinese government announced that the goal of eliminating absolute poverty had been achieved. However, the performance of “Two No Worries, Three Guarantees” needs to be further analyzed by using the latest data. Whether there is any difference in China’s poverty eradication policy after 2021 still needs to be assessed by selecting appropriate methods.
Footnotes
Declaration of Data
The data selected in this paper comes from China family panel studies (CFPS), which is a nationally representative, longitudinal survey of Chinese communities, families, and individuals. The CFPS promises to provide to the academic community the most comprehensive and highest-quality survey data on contemporary China. The data can be obtained through the website of CFPS (![]() ). The data selected in this paper and programs can be obtained by contacting the corresponding author of this paper.
). The data selected in this paper and programs can be obtained by contacting the corresponding author of this paper.
Declaration of Conflicting Interests
The author(s) declared no potential conflicts of interest with respect to the research, authorship, and/or publication of this article.
Funding
The author(s) disclosed receipt of the following financial support for the research, authorship, and/or publication of this article: This research was financially supported by the Key Projcet of National Social Science Foundation of China (No. 21AZD071), the Taishan Scholars Program of Shandong Province (No.tsqn20161041).