
Abstract
In the contemporary world, finance is crucial to economy and financial agglomeration has a lasting effect on the economic growth. The areas of financial agglomeration will influence the economy of the local parts throughout agglomeration effect, and have an impact on its spatially related parts. Based on Chinese inter-provincial panel data from 2007 to 2018, this study constructs an indicator system of financial agglomeration and measures provincial agglomeration levels to examine its impact on regional economic growth. The results show that, first, the level of financial agglomeration has a trend of steady change and presents a ladder-decreasing agglomeration pattern. Second, financial agglomeration could effectively promote the economic growth of local and spatially related regions. The development of the financial industry depended more on geographical distance, and the diffusion effect of financial agglomeration in the eastern, central, and western regions are in different stages. Finally, by summarizing the research conclusions, this study put forward some suggestions for China’s regional economic growth.
Introduction
Financial agglomeration is not only the process of dynamic collection of financial elements, resources, and industry in a certain area, but also the final result of this process. In the contemporary world, finance is crucial to the economy, and financial agglomeration has a lasting effect. Financial agglomeration areas will influence the economy of local regions throughout the agglomeration process, and affects its spatially related areas. Given the globalization of the economy, the cross-border flow of various financial elements is in full swing, and financial institutions developed from small-scale agglomeration to large-scale, high-intensity agglomeration. Financial institutions rely on information advantages, professional services, and developed network systems to expand their business scale, which drives financial industries to change in a better and more specialized direction. It then further contributes to the comprehensive enhancement of various industries’ development with the financial industry as the core. The phenomenon of financial agglomeration began in the 1970s, with the international financial centers of New York, London, and Tokyo appearing as the products of financial agglomeration and playing a powerful leading role in the global economy.
As the level and complexity of financial activities improves, the relationship between financial activities and economic growth is tightening, gradually resulting in a state of coprosperity and symbiosis. The financial industry depends on its information advantages and professional capital operation, serving local economic growth. Simultaneously, the Matthew effect is obvious in the financial industry (Ehigiamusoe & Samsurijan, 2021; Ehigiamusoe et al., 2021), where some areas with developed economies and outstanding policy advantages show a trend of geographical agglomeration. However, in underdeveloped areas, the financial industry tends not to show a trend of agglomeration. In 2020, the Fifth Plenary session of the 19th CPC Central Committee adopted the party leadership’s proposals for formulation the 14th Five-Year Plan for National Economic and Social Development and the Long-Range Objectives Through the Year 2035, which proposed to build an impact mechanism for finance to support the real economy effectively, raise the level of financial science and technology, and enhance financial inclusion. At present, the financial industry and its agglomeration show unbalanced development across China’s provinces, and the level of economic growth between provinces also differs.
Most previous studies adopted a traditional econometric perspective, leaving the geographical attributes largely unexamined (Commendatore et al., 2013; Greenwood et al., 2013). L. Li et al. (2011) were the first domestic scholars to establish spatial econometric models to study the relationship between financial agglomeration and economic growth. Their research results show that financial agglomeration areas have a certain agglomeration effect, but the diffusion effect is limited, mainly because China’s administrative system restricts the cross regional cooperation of the financial industry. Since then, scholars such as T. Y. Zhou and Wang (2014) and J. F. Zheng et al. (2017) have also begun to use spatial econometric models to study the relationship between financial agglomeration and regional economic growth. When studying the impact of financial agglomeration on regional economic growth, most domestic scholars measure financial agglomeration from the overall scale of the financial industry, but do not go deep into the specific sub sectors of the financial industry. From the perspective of spatial correlation, there are few literatures on the impact of financial agglomeration on regional economic growth. Therefore, in view of the above realistic background and the shortcomings of existing literature, the contributions of this study as follows. Firstly, based on the measurement of financial agglomeration level by Ding et al. (2009), we construct a financial agglomeration index system from the macro financial scale and various financial sub industries. And we comprehensively consider the “quality” and “quantity” of financial industry development in the secondary indicators. Secondly, by using the above index system, we measured the level of financial agglomeration in China based on the inter-provincial panel data from 2007 to 2018 and analyze the temporal and spatial dynamic evolution trend of financial agglomeration. Thirdly, we empirically test the effects of financial agglomeration on regional economic growth by analyzing its impact mechanism from the spatial relevance perspective. And the regional differences and explanations are supported for the differing performance of the spatial correlation of financial agglomeration in different sample spaces. The main purpose of this paper is to measure the level of financial agglomeration in China and reveal its temporal and spatial evolution trend, and to identify whether there is a spatial effect of financial agglomeration on regional economic growth and provide a reference for the direction of industrial structure adjustment.
The structure of this paper is as follows: in Section 2, we review the literatures from two aspects areas: measurement of financial agglomeration and analysis of the influence of financial agglomeration on regional economic growth. In Section 3, at the same time, we analyze the impact mechanisms of financial agglomeration on regional economic growth from three perspectives—capital accumulation effect, structural upgrading effect, knowledge spillover effect, and technological diffusion effect. In Section 4, we construct an index system of financial agglomeration level and use entropy method to measure China’s financial agglomeration level based on China’s inter-provincial panel data from 2007 to 2018. In Section 5, we conduct a comprehensive empirical test of the impact of financial agglomeration on regional economic growth. Finally, in the summary (Section 6), we summarize the results of the empirical analysis and offer policy recommendations according to the conclusions.
Literature Review
The Connotation and Causes of Financial Agglomeration
The Connotation of Financial Agglomeration
There are different views on the connotation of financial agglomeration in academic circles. Financial agglomeration appears in the mature financial industry, and the result of agglomeration is the financial center. A large number of financial institutions in the financial agglomeration area are geographically adjacent and share resources and information with each other to reduce costs (Park & Essayyad, 1989). High-intensity financial agglomeration is not only conducive to the development of financial institutions, but also makes investors’ funds flow to financiers who can maximize their income, which has a positive effect on the growth of enterprises in the region, and the result of agglomeration is the formation of financial centers (Kindleberger, 1974; Pandit et al., 2002). Some scholars defined it as a dynamic process from a dynamic perspective such as, Sun and Jiang (2013), Hu and Zheng (2014). Others defined financial agglomeration as a static result. For example, X. J. Zhang (2015), and Zhou and Liu (2020) believed that financial agglomeration was a state in which financial resources were constantly gathered in the financial network, which was the result of the interaction between the financial industry and its environment.
Based on the views of the above scholars, this paper defines financial agglomeration as the process and result of a series of financial elements, financial resources, and industries dynamically gathering in a certain region.
The Causes of Financial Agglomeration
The economies of scale and information flow in financial geography are thought to be the main causes of financial agglomeration. Kindleberger (1974) thought that financial institutions choose to gather in space mainly based on the consideration of obtaining scale effect. Arthur (1994) pointed out that when finance locates, it tends to choose areas with economies of scale. Moreover, economies of scale make the region have a locking effect, and once enterprises choose to enter the region, it will be difficult to leave in the future, thus deepening the level of financial agglomeration. Li and Jiang (2012), Che et al. (2012), Li (2014), and Hazledine et al. (2017) believed that economies of scale, financial information, and government policies have significant effects on financial agglomeration, and industrial agglomeration also promotes the development of financial agglomeration to some extent. Financial geography is analyzed from the perspective of information flow. Thrift (1994) and Porteous (1995) analyzed the causes of financial agglomeration from this perspective earlier. They thought that most valuable information was “non-standardized,” which would cause distance loss and increase the cost in the process of dissemination. Therefore, if you want to understand this kind of information, you must be located in or close to the information source of this information, which gave birth to financial agglomeration. Zhao et al. (2002) further expanded the previous studies and believed that information was not only one of the causes of financial centers, but also had a close relationship with financial centers. proposed that information asymmetry was one of the causes of financial centers. Guan and Xu (2010) pointed out that the development of financial industry depends on highly mobile information, and financial agglomeration appears in highly developed cities that can quickly obtain first-hand information. Li and Yang (2015) pointed out that information flow played a key role in the development of financial institutions with high requirements for innovative and non-standardized information, and played an unparalleled role in financial agglomeration. Zhang (2019) believed that the financial industry has the characteristics of information service, and information flow and asymmetric information contribute to financial agglomeration.
Calculation of Financial Agglomeration
There are two categories of the measurement methods of financial agglomeration. One is the single index, and the other is the comprehensive index system. The former is represented by the location entropy index, and the latter is to construct a comprehensive evaluation system.
(1) Location entropy index refers to the ratio of the proportion of an indicator in a certain region to the proportion of the indicator in a higher-level region. The location entropy can be calculated by using the added value of the financial industry such as Ren et al. (2010), Li and Wang (2014), Cao and Yu (2018), or by using the number of employees in the financial industry such as Shi and Pu (2011) and Pan et al. (2013). In the sub-sectors of finance, L. Li et al. (2011) and Zhang (2014) used the balance of bank savings deposits, total share capital, and premium income to calculate the location entropy of each sub-sector. Sun (2019) chose the balance of local and foreign currency loans of financial institutions to calculate the location entropy of the banking industry and the number of listed companies to calculate the location entropy of the securities industry.
(2) Considering that there may be one-sided and simplified statistical errors in the measurement results of single index method, some scholars use comprehensive index system to measure the level of financial agglomeration. Hu and Yang (2003) and Wang and Song (2005) respectively constructed index systems to quantify the development degree of financial centers from international and regional levels. Ding et al. (2009) constructed the financial agglomeration index system from the macro-financial scale and various financial sub-industries. Similarly, Y. X. Huang et al. (2011) thought that financial agglomeration should include the agglomeration of financial scale at macro level to the agglomeration of micro-financial institutions. Ru et al. (2014) constructed an index system from the macro-financial background, the scale and density of the financial industry, and the degree of financial activity. In the specific calculation method, some scholars use principal component analysis such as Zhang et al. (2020) and other scholars such as H. P. Zhou et al. (2016) and Ni and Li (2018) use entropy method.
The Impact of Financial Agglomeration on Regional Economic Growth
The mechanism of financial agglomeration on economic growth mainly includes economies of scale, industrial structure upgrading and technological progress (Li et al., 2016; Zhao, 2014). Bernat (1996) considered geospatial factors. Commendatore et al. (2013) constructed a free entrepreneur model, followed by T. Y. Zhou and Wang (2014), who also began using spatial econometric models to study their relationship. C. Wang et al. (2019) use the depth of financial development and the availability of financial resources to comprehensively measure the level of financial agglomeration in Beijing Tianjin Hebei region, so as to further study the impact of financial agglomeration on economic growth. Wen et al. (2023) used data of 41 cities in China’s Yangtze River Delta to analyze the impact of financial agglomeration on technological innovation. Qian et al. (2022) measured the effect of financial agglomeration on green economic growth using a Slacks-Based Model-Data Envelopment Analysis (SBM-DEA). In recent years, more and more scholars have gradually incorporated spatial related factors into the scope of research in combination with the reality of the relationship between financial agglomeration and economic growth in various regions (Wong et al., 2021; Yuan et al., 2019).
Theoretical Basis and Analysis of Impact Mechanism
As for the definition of financial agglomeration, the researchers not only define it as the “process” of formation from a dynamic point of view, but also regard it as the final “result” from a static point of view. Based on the views of the above literature survey, this study defines financial agglomeration as the process and result of a series of financial elements, financial resources, and financial industries dynamically gathering in a certain region. With the world development of economy, the financial industry has begun to show obvious spatial distribution characteristics, the analysis of the impact of financial agglomeration on economic growth from the perspective of spatial economy has attracted the attention of academic circles. The financial agglomeration area relies on the agglomeration effect and diffusion effect to act on the economic growth of the local area and its spatial correlation area. Within the financial agglomeration region, various effects promote and interact with each other, further improving the level of financial agglomeration, and then affecting the local economic growth. The regions that have formed financial clusters absorb a large number of spatially related financial resources through the “polarization effect” in the early stage, causing the peripheral financial industry to shrink. Later, they will transfer the local inefficient surplus resources to their spatially related regions through the “trickle effect.”
Therefore, financial agglomeration affects regional economic growth through the capital accumulation effect, structure upgrading effect, knowledge spillover effect, and technology diffusion effect.
(1) Capital accumulation effect. The capital accumulation effect refers to the influence of capital investment on economic growth in a certain region (Zhong & Du, 2018). The accumulation of capital such as fixed asset investment, labor input, and government expenditure occur through the financial market and themselves influence economic growth (Chen et al., 2019). Among them, based on the Cobb-Douglas function, fixed asset investment promotes economic growth, with its level commonly measured as its proportion of GDP (Delong & Summer,1990; H. P. Zhou et al., 2016). Labor input and government expenditure also have a significant impact on local economic growth (Chu & Wu, 2018).
(2) Structural upgrading effect. First, the capital needed during the industrial agglomeration process can be obtained through the financial industry in the agglomeration area. Second, industrial agglomeration can provide a favorable environment for the financial industry to grow. Due to the demand for financial services, a certain industrial agglomeration area will attract financial institutions through tax incentives, creating the initial conditions for the formation of financial agglomeration (W. Zheng & Lu, 2019). Therefore, financial and industrial agglomeration will promote each other, then improve economic efficiency, and finally promote economic growth.
(3) Knowledge spillover effect. The rich knowledge and technology within the financial agglomeration area promote financial innovation, which in turn promotes technological progress. There is often a mature and developed network system within an area that creates good conditions for the dissemination of new technology (Tang et al., 2019). Due to the competitive pressure in the financial agglomeration area, financial agglomeration reaches a certain level, at which point the local market tends to be saturated. This will be accompanied by knowledge spillover (P. Zhang & Yu, 2019).
(4) Technological diffusion effect. This effect includes mainly the “polarization effect” and “trickle-down effect.” Through the polarization effect, the early financial agglomeration areas will enable strong financial institutions in the areas to absorb a large number of resources from its spatially related areas, which shrinks the peripheral financial industry (B. B. Yu, 2017). In the later stage, the trickle-down effect occurs when the local financial resources reach a certain saturation level, at which point resource utilization will be inefficient, and part of the excess financial resources will find more suitable investment locations in its spatially related areas (D. L. Huang & Wu, 2019). The trickle-down effect alleviates the imbalance in the development of the financial industry, shortens the gap between regions through financial resources, and finally promotes the coordinated development of the regional economy.
Measurement of Financial Agglomeration Level
Indicator System
Many factors influence the formation and development of financial agglomeration. Using Ding et al.’s (2009) measurement, we account for the availability and timeliness of the data and construct an index of financial agglomeration by choosing factors from the macro-finance and various financial sub-sectors. This indicator comprehensively considers the “quality” and “quantity” of the financial industry’s development. The sample period is from 2007 to 2018. Table 1 describes the indicators.
Comprehensive Indicator System of Financial Agglomeration.

Following F. X. Wang et al. (2013), we adopt the entropy method to determine the weight of each indicator. We apply the following measurement process:
(1) Standardization and translation processing:
Standardization of positive indicators:
Standardization of negative indicators:
Index Translation:
(2) Quantify with the same degree and determine the weight of the index:

(3) Calculate the entropy value of the j-th index:
(4) Calculate the information utility value of the j-th index:
(5) Calculate the weight of each index:
(6) Financial agglomeration level:
where
By measuring the specific weight of each index, the influencing factors of financial agglomeration level can be analyzed and summarized. Figure 1 shows the weights of all indicators in 2007 and 2018. Through vertical and horizontal comparison, we can find the evolution trend of financial agglomeration index system. Among them, the indexes with increasing weight in the index system include the total amount of funds raised in the stock market and the bond market, insurance density, insurance depth, and the number of insurance companies. The proportion of insurance density, depth, and the number of insurance companies in the financial agglomeration index system has increased, which may be related to the rapid development of China’s insurance industry in the last decade. The added value of the financial industry belongs to the index to measure the scale of the financial industry, and its weight proportion in the index system of financial agglomeration has dropped significantly, which indicates that the scale expansion of the financial industry may have a greater impact on financial agglomeration in the early years. At present, when more attention is paid to the development quality of the financial industry, only extensive scale expansion has little effect on financial agglomeration. At present, we pay more attention to whether the financial industry and the financial market can effectively play the role of financing and serving the real economy. The decline in the weight of securities, funds, futures companies, and the number of companies also indicates that the financial industry is now paying more attention to the improvement of quality. The weight of other indicators has not changed much.

Weight distribution of indicator system of the financial agglomeration.
Temporal and Spatial Dynamic Evolution
Table 2 reports the summary statistics. Overall, the level of financial agglomeration in China is relatively stable, but it has changed in recent years. The overall ranking of the financial agglomeration level does not change much but the ranking of some provinces fluctuates, which indicates that spatial differences in the financial industry persist. By region, there is an obvious ladder-decreasing pattern in the level of financial agglomeration. The highest level is in the eastern region, where its financial industry is concentrated mainly in the areas around the Bohai Sea, the Yangtze River Delta, and the Pearl River Delta, and the level of agglomeration there is far higher than that in other regions. The development of the financial industry in the central and western regions is far behind that of the eastern regions.
Level of Financial Agglomeration in China’s Provinces in 2007, 2013, and 2018.

The provinces with significant changes in the ranking of financial agglomeration are Henan Province, the Inner Mongolia Autonomous Region, and Hunan Province. Henan Province has continued to improve its financial agglomeration ranking since 2007 because of its strategy to build a “Henan Financial Army” that began in 2014. The level of financial agglomeration in the Inner Mongolia Autonomous Region improved greatly in 2018 because Inner Mongolia, as an important area of the “Belt and Road” initiative, has a large number of leading enterprises in cashmere, rare earth processing, biological products, and other industries. These enterprises take the initiative to “go out, go in, and go up” in the process of interconnection between Inner Mongolia and the countries along the road and have higher requirements for international financial services. Since 2007, the level of financial agglomeration in Hunan Province began to decline. In recent years, financial institutions in Hunan Province struggled to meet the needs of the real economy, and coupled with the impact of capacity removal and leverage reduction, made development in this area difficult.
Furthermore, we study the spatial distribution of China’s financial agglomeration levels in 2007, 2013, and 2018. In summary, China’s financial industry shows a ladder-decreasing agglomeration pattern in the east, center, and west. The financial industry in the eastern coastal areas is mainly characterized by the agglomeration of the economic circle around the Bohai Sea, the Yangtze River Delta, and the Pearl River Delta, while the rest of the region is the periphery. In these three core regions, the spillover level of financial agglomeration in the Yangtze River Delta is relatively high. The local financial industry is connected to the spatially related regions through its internal financial network and the diffusion effect of agglomeration areas is obvious. However, the financial agglomeration level of the neighboring provinces around the Bohai Sea and the Pearl River Delta is not at the same level as the local region. This result indicates that the radiation effect in these two regions is not obvious. The central region presents a trend of agglomeration along the Yangtze River Economic Belt. The phenomenon of financial agglomeration appeared in Sichuan and Xinjiang provinces in the western region, which is related to Chengdu’s active promotion of the construction of a financial science and technology center and a series of tax and fee reduction measures in Xinjiang to reduce costs in the real economy. Since the real economy needs more professional financial services, these measures promote the development of the financial industry. From the change in the distribution pattern of financial agglomeration, the ladder-decreasing pattern improved. The degree of financial agglomeration in the central region increased and the gap between the eastern and central regions decreased. Thus, the unbalanced regional development of China’s financial industry improved recently.
Empirical Test and Results
Analysis of Spatial Correlation
The first law of geography shows that economic things in different regions are often spatially related. This is also the key that distinguishes the spatial econometric model from the ordinary panel regression model. Because the spatial econometric model considers the spatial correlation, thus relaxes the assumptions of the mean value among spatial things. Therefore, as far as the economic statistics method is concerned, it can reflect the accuracy of the research topic more objectively and scientifically.
Global Spatial Autocorrelation
We adopt the global Moran’s I index and local Moran’s I index to investigate the spatial correlation between financial agglomeration and regional economic growth in China.
The global Moran’s I index is as follows:

where
Table 3 reports the global Moran’s I of economic growth and financial agglomeration and the related statistics for China’s provinces from 2007 to 2018, where W1 is the geographical distance matrix and W2 is the economic distance matrix. Under the two spatial weight matrices, the Moran’s I index of per-capita GDP and financial agglomeration are positive and statistically significant for all years. This result shows that China’s economic growth and financial agglomeration are not randomly distributed, but have obvious spatial correlation characteristics.
Moran’s I of Per-Capita GDP and Financial Agglomeration.

**, and *** indicate statistical significance at the 10%, 5%, and 1% level, respectively. The Z values are in parentheses.
Local Spatial Autocorrelation
Global spatial autocorrelation reflects the overall spatial agglomeration and correlation of all spatial sequences, while local spatial autocorrelation takes a single individual as the basic starting point to explore the present situation of spatial agglomeration among individuals. Due to the limitation of space, this part only shows the local Moran’s scatter maps of the explained variables and core explanatory variables in 2007 and 2018 based on the economic distance matrix. Figures 2 and 3 report the changes in economic growth and the financial agglomeration levels of various provinces in China show a stable development trend. Most provinces are distributed in the first (HH) and third (LL) quadrants, and a small number of provinces are located in the second (LH) and fourth (HL) quadrants. This result indicates obvious positive spatial autocorrelation and regionalization characteristics in economic growth and financial agglomeration in most regions of China. Beijing, Shanghai, Tianjin, Jiangsu, Zhejiang, Guangdong, and other developed eastern provinces have a high level of economic growth and financial agglomeration, while the levels in the central and western regions are low.

Local Moran scatter maps of per-capita GDP in (a) 2007 and (b) 2018.

Local Moran’s scatter maps of financial agglomeration in (a) 2007 and (b) 2018.
Specifically, the diffusion effect in the core area is more prominent. The level of financial agglomeration in Beijing, Shanghai, Tianjin, Zhejiang, Jiangsu, and Shandong appear regularly in the first quadrant. Thus, China’s financial industry is concentrated mainly in the Yangtze River Delta and the Bohai Rim in the eastern coastal areas. The level of financial agglomeration in these and the surrounding areas is at a high level. The central and western regions are mostly located in the third quadrant since the development of the local and spatially related provinces’ financial industries are lagging.
Model Setting
We select the spatial Durbin model, which combines the spatial autoregressive and error model. It not only considers the spatial correlation between variables, but also accounts for the spatial lag term between variables, which reflects the comprehensiveness of the research.
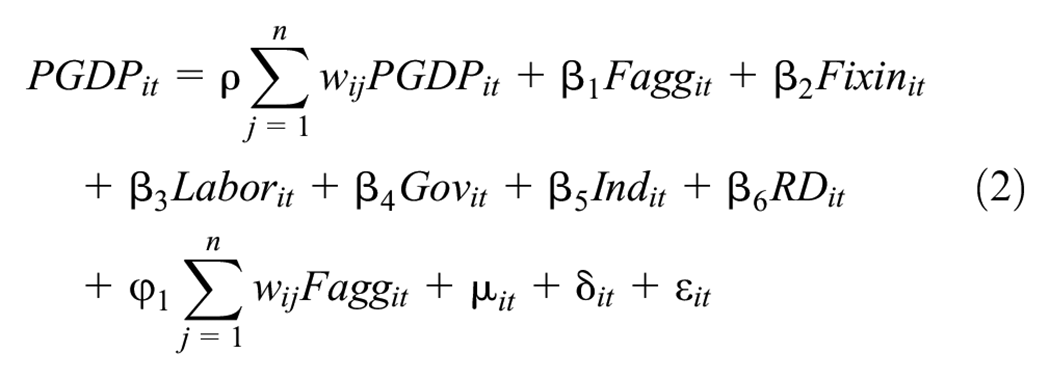
where ρ is the spatial autocorrelation coefficient of economic growth, β and ϕ are the coefficients of the corresponding variables, respectively, of the spatial weight matrix, µ is the individual fixed effect, δ is time fixed effect, and ε is the error term.
Variables
Explained Variable
Economic Growth (PGDP)
Given that our sample consists of 30 provinces, municipalities, and autonomous regions in China, there are great differences in inter-provincial scale. To eliminate the differences caused by demographic factors, we use per-capita GDP to measure the level of provincial economic growth.
Explanatory Variable
Financial Agglomeration (Fagg)
As described earlier, we construct a comprehensive index to measure the level of financial agglomeration.
Control Variables
They are fixed sssets investment (Fixin), labor input (Labor), government expenditure (Gov), industrial structure (Ind), and R&D capability (RD). The specific meaning of each control variable is as follows: (1) Fixed assets investment (Fixin) is measured by the proportion of fixed assets investment in GDP; (2) Labor Input (Labor) is measured by the proportion of the number of employed people in urban units, the sum of urban private enterprises and self-employed personnel in the total population; (3) Government expenditure (Gov) is measured by the proportion of local general budget expenditure in GDP; (4) Industrial structure (Ind) is measured by the ratio of the output value of the tertiary industry to the secondary industry; and (5) R& D Capability (RD) is measured by the sum of practitioners in scientific research, technical services, and geological survey and the proportion of employees in urban units according to the method of Y. Z. Yu et al. (2013).
Descriptive Statistics
Because of the difficulty of obtaining early data on the indicators related to financial agglomeration, our sample period is 2007 to 2018. Due to limited data availability, we exclude Hong Kong, Macao, Taiwan, and the Tibet Autonomous Region. The data for the relevant index items are from the China Statistical Yearbook, Almanac of China’s Finance and Banking, China’s Regional Financial Operation Report, Statistical Yearbooks, and Statistical Bulletins of each province, and the Wind database. Table 4 provides the descriptive statistics of the variables.
Variable Descriptive Statistics.
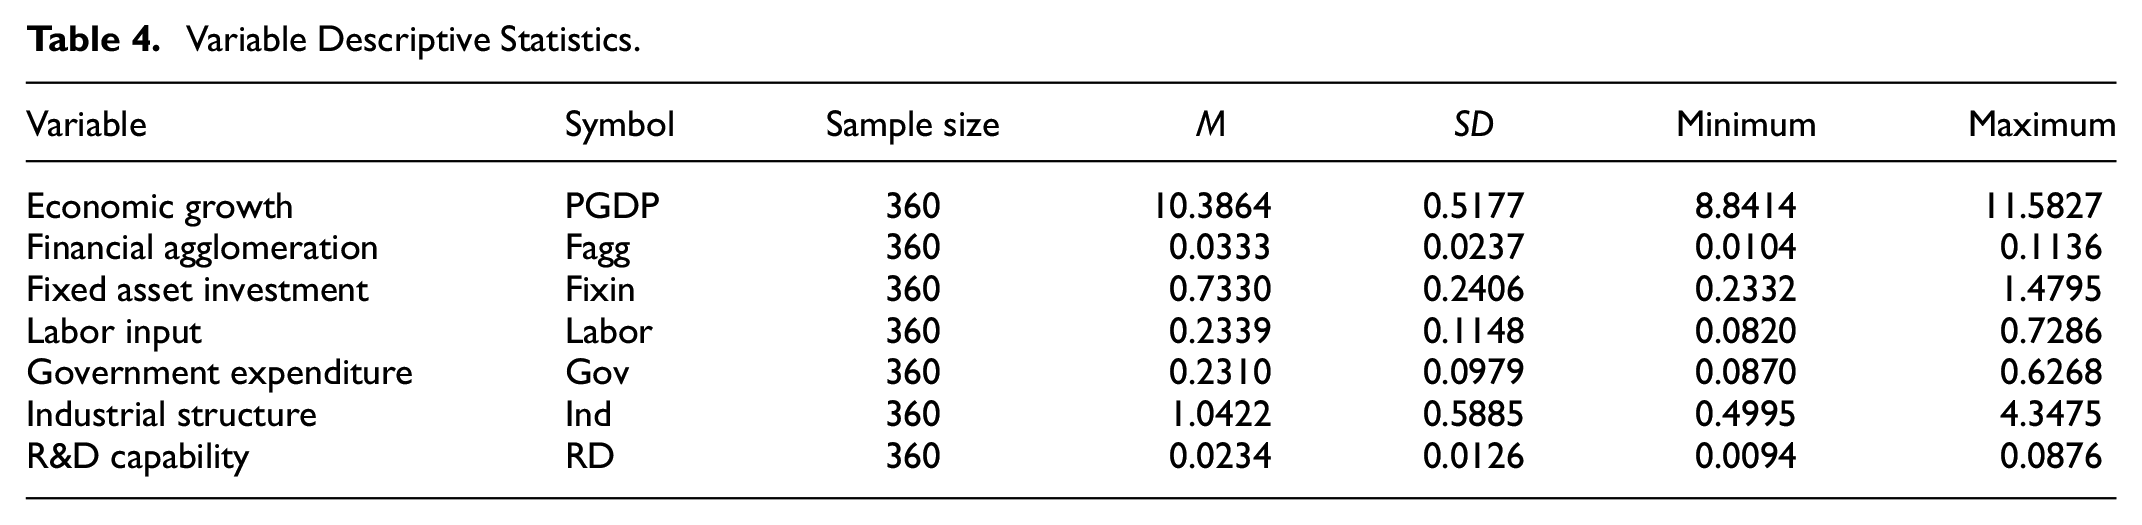
From Table 4, the standard deviation of economic growth is obviously below the mean, indicating a relatively stable trend of economic growth in China’s provinces from 2007 to 2018. The relative gap between the minimum and maximum of financial agglomeration is large, which reflects the imbalance of the financial industry in various parts of the country. The standard deviations of all the control variables are below the mean, demonstrating that the data for each variable are relatively stable. Among them, industrial structure has the largest difference between the minimum and maximum, reflecting the non-equilibrium of the industrial structure.
Spatial Econometric Regression
According to the spatial Durbin model constructed above, we conduct a regression between financial agglomeration and regional economic growth in China from 2007 to 2018. Table 4 reports the results. The Hausman test results indicate that the fixed effect model is the most appropriate, and through the LR test results, the space-time double-fixed effect model should be chosen. From the coefficients, financial agglomeration plays a positive role in promoting the region in both matrices. The coefficient of the spatial lag term (w*Fagg) of financial agglomeration is also positive in both matrices, but only significant under the geographical distance matrix, indicating that the financial agglomeration of various provinces in China has a positive diffusion effect (see Table 5).
Regression Results of Spatial Durbin Model Under Two Spatial Weight Matrices.

**, and *** indicate statistical significance at the 10%, 5%, and 1% level, respectively. The Z values are in parentheses.
Among the control variables, the coefficients of fixed capital investment, labor input, and R&D capacity are significantly positive, demonstrating that these factors promote economic growth. Investment in fixed capital and labor are important factors affecting China’s economic growth. Technological progress is the source of long-term economic growth, and improving R&D capacity can ensure technological progress to promote economic growth. The coefficient of government expenditure is significantly negative, which indicates that if the government does not adapt to the laws of local economic development, then it may be difficult to affect economic development. The regression coefficient of industrial structure is significantly negative under both matrices, indicating that China’s current industrial structure is not fully suited to the mode of economic development, and there is still room to improve. At present, the economy relies more on the structure of the manufacturing industry than the service industry, leaving tertiary industries at a low level of development and limiting their role in promoting economic growth.
Spatial Effect Decomposition
To explore the effect of financial agglomeration on the economic growth of a location and its spatially related areas, we provide a further analysis by decomposing the spatial effects.
The results in Table 6 indicate that financial agglomeration promotes regional economic growth under both spatial weight matrices, and the coefficient under the geographical distance matrix is greater than that under the economic distance matrix from the total effect perspective. Thus, the current development of China’s financial industry depends more on the proximity of geographical distance. Furthermore, the regression coefficient of financial agglomeration under the economic distance matrix is significantly positive, showing that the scale effect formed by the concentration of capital in space can help to improve capital efficiency. Therefore, it can give full play to the role of financial agglomeration in promoting regional economic growth. The direct effects of financial agglomeration under the two spatial weight matrices are significantly positive, indicating that the financial industry in a financial agglomeration area can promote economic growth through the agglomeration effect. The direct effect coefficient is greater than the regression coefficient because it contains the feedback effect. In terms of the indirect effect, the coefficients under both matrices are positive, indicating that financial agglomeration not only plays a positive role in the economic growth of a local region, but also influences the economic development of its spatially related areas through the financial network. The diffusion effect is greater than the agglomeration effect, indicating that the financial agglomeration area plays a more important role in promoting the economic development of its spatially related areas than on the economic growth of the local region.
Effect Decomposition of the Spatial Durbin Model Under Two Spatial Weight Matrices.

**, and *** indicate statistical significance at the 10%, 5%, and 1% level, respectively. The Z values are in parentheses.
The direct effect of investment in fixed capital under the two matrices is significantly positive, which means that investment in fixed capital will promote local economic growth. Its indirect effect is also positive, showing that investment in fixed capital will produce a positive spatial diffusion effect that can promote the economic growth of its spatially related areas. The direct effect of labor input under the two matrices is significantly positive, indicating that an increase in employment in the local region will be conducive to economic growth. In terms of the indirect effects, the coefficients under the two matrices are significantly positive, indicating that the labor force will not only promote local economic growth, but also contribute to the economic growth of its spatially related regions through the diffusion effect. When the labor input in the local region reaches saturation, some people will choose to work in the surrounding areas, which will promoting the economic development of the surrounding areas. The results of government expenditure level, industrial structure, and R&D capability are consistent with the overall regression, so we will not repeat them here.
Regional Heterogeneity Test
From the previous overall sample regression analysis, the relationship between China’s financial agglomeration and regional economic growth is more significant under the geographical distance matrix. Therefore, we use the geographical distance matrix to divide China’s provinces into eastern, central, and western sub-sample systems. This analysis still relies on the spatial Durbin model to test the impact of financial agglomeration on economic growth. The results for these three regions are summarized in Table 7. The spatial autocorrelation coefficient in the eastern region is significantly negative and the coefficients for the other regions are significantly positive, showing that the economic growth of the provinces in these three regions has a spatial correlation. In terms of absolute value, the spatial correlation coefficient is the smallest in the western region and the largest in the central region. Thus, economic growth in the central region has a greater influence on its spatially related regions than in the western region. The autocorrelation coefficient of the eastern region is negative, indicating a polarization effect to absorb the resources of the surrounding areas, which is not conducive to the economic development of peripheral areas. From the coefficient of the spatial lag term (w × Fagg) of financial agglomeration, we see diffusion effects in three regions. However, only the coefficient in the eastern region is positive, while those for the central and western regions are negative. Due to the differences in the economic development and financial industries of different regions, the role of financial agglomeration in regional economic growth differs.
Regression Results of Spatial Durbin Model in Various Regions Under the Geospatial Weight Matrix.

**, and *** indicate statistical significance at the 10%, 5%, and 1% level, respectively. The Z values are in parentheses.
The financial agglomeration in the eastern region can promote the economic growth of the local region and its spatially related areas. The financial industry in the eastern region is in the mature stage, and a more developed financial network has been formed among the provinces. The financial industry effectively serves the economic growth of the local region. Its financial network, relying on the trickle-down effect, radiates its effect on the economic growth of its spatially related areas and strengthens the diffusion of financial agglomeration. The financial industry in the central region is in the growth stage and is highly competitive. It absorbs the resources of its spatially related areas through the financial network under the polarization effect, which weighs against the economic development of its spatially related areas. The polarization effect in the western region is more prominent because the financial industry is in the nascent stage, and it still relies on absorbing the resources of its surrounding areas for development (see Table 8).
Effect Decomposition of Each Region Under the Geospatial Weight Matrix.

**, and *** indicate statistical significance at the 10%, 5%, and 1% level, respectively. The Z values are in parentheses.
From a regional perspective, the coefficients of the direct and indirect effects of financial agglomeration in the eastern region are positive, meaning that its financial agglomeration area not only promotes economic growth in the local region, but also relies on its internal financial network to support a wider range of economic growth through the diffusion effect. This result demonstrates that in the later stage of financial industry development, some excess resources will be transferred to areas in which investment will yield higher returns when the financial resources in the local region reach saturation. Considering the transfer cost, spatially related areas show similar economic development patterns and become the primary consideration, which is the trickle-down effect. The direct effect of financial agglomeration in the central region is positive and the indirect effect is negative, signaling that frequent economic communication among the provinces in the central region places higher requirements for the service scale of the financial industry. The financial network will then appear and its beginning will take shape. While the financial industry serves the real economy of the region, it can also rely on the financial network through the diffusion effect to radiate to the spatially related areas. However, as its financial industry is in a period of growth and has fierce competition locally, it absorbs the financial resources of the surrounding areas through the polarization effect. The coefficients of direct and indirect effects of financial agglomeration in the western region are different. The indirect effect coefficient is negative, indicating that the development of its financial industry comes at the expense of the economic growth of the surrounding regions. The conditions for the development of the financial industry in the western region are congenitally deficient and the development is slow. Due to the lack of local resources, the financial industry must absorb significant financial resources from the surrounding areas, which hinders economic growth in these areas.
Conclusions
Based on China’s inter-provincial panel data from 2007 to 2018, this study constructs an index system of financial agglomeration level, and uses entropy method to measure China’s financial agglomeration level. It also analyzes the spatial and temporal dynamic evolution trend of China’s financial agglomeration and empirically tests the impact of financial agglomeration on regional economic growth. According to the research results, the main conclusions are as follows: (1) on the whole, the level of financial agglomeration shows a stable development trend. From a sub-regional point of view, the financial industry presents a ladder-decreasing agglomeration pattern of the eastern, central and western regions. Specifically, the eastern coastal areas are clustered around the Bohai Economic Circle, the Yangtze River Delta, and the Pearl River Delta as the core, the central region is mainly agglomerated along the Yangtze River economic belt, and the financial agglomeration in the western region is not obvious. (2) Financial agglomeration can effectively promote economic growth and has a positive spillover effect. Fixed capital investment, labor input, and R&D capacity can promote economic growth, and the role of government expenditure in industrial structure needs to be further improved. (3) the development of the financial industry depends more on the proximity of geographical distance. The diffusion effect of financial agglomeration in the eastern, central, and western regions is at different stages. The financial industry in the eastern regions is in the mature stage, showing a “Trickle-down Effect,” the financial industry in the central region is in the growth stage, the financial industry in the western region is in the initial stage, showing a “Polarization Effect,” and the Polarization Effect in the western region is even greater.
Therefore, based on the above conclusions, the following suggestions are put forward. Firstly, financial deepening should be further promoted. From the result of this study, it is found that the positive effect of the government on economic growth needs to be further released. Therefore, we should change the ways and means of governments at all levels to regulate the economy, promote the formation, and development of financial agglomeration and economic growth. On the one hand, the central government should formulate a reasonable macro-strategy for the development of the financial industry and improve relevant policies and systems. On the other hand, local governments should formulate corresponding policies according to the characteristics of economic development and financial agglomeration in the region. Specifically, the level of financial agglomeration in the eastern region has reached a certain height, and the marginal effect may decrease after absorbing a large number of financial resources. We can consider sending some financial resources to the central and west regions and help financial institutions expand their service scope and business sectors in their region. Local governments in the central and western regions can vigorously develop auxiliary industries and be prepared to undertake financial resources in the eastern region. In addition, all localities should vigorously implement the talent introduction and training plan, and focus on cultivating a group of compound talents with excellent professional knowledge and strong localization and professionals in related fields.
Secondly, build a multi-level financial center system. Financial center, the product of financial agglomeration, can not only promote the economic growth of this region, but also promote the economic growth of a wider region through radiation. Compared with the mature financial industry in western countries, China’s financial industry still has great room for development. Although financial centers such as Beijing, Shanghai, and Shenzhen have been formed, due to some factors, the cross-regional allocation of financial resources is limited, and the radiation scope of financial centers is limited. Therefore, according to the actual situation of each region, China should give full play to the advantages of each region, build international, national, and regional multi-level financial centers, realize the targeted differentiated development of financial centers at all levels, and give full play to local advantages to drive regional economic growth.
Thirdly, strengthen regional financial cooperation. The results of this paper show that the fierce competition in the financial industry of the provinces in the central and western regions is unfavorable to the economic growth of their spatially related regions, and “the combination will benefit both, while the struggle will lose both.” It is necessary to give play to the radiation-driven role of financial agglomeration, promote the economic growth of its spatially related areas, and make the economy develop in a coordinated and balanced way. The obstacles that hinder the cross-regional allocation of financial resources should be eliminated at the institutional level. The central and western regions should change the development mode of the financial industry, actively cooperate with high-level financial regions, speed up the interconnection of internal talents, information, technology, and other resources, and achieve accurate docking in industrial division of labor, technological innovation, and talent exchange.
Although this study has offered a useful explanation of the relationship between financial agglomeration and regional economic growth, it also has some limitations. Firstly, due to the availability of data, this study only used data of inter-provincial panel data from 2007 to 2018 in China to conduct the research. Secondly, as for the measurement of financial agglomeration level, there may be different views on the selection of indicators. In the future, the following improvements can be made. Firstly, we will select the data of small-scale regions such as cities for discussion. Secondly, we will build a more comprehensive evaluation index system of the level of financial agglomeration to more specifically reflect the reality by tracking the latest literatures and collecting realistic data.
Footnotes
Author Note
This manuscript has not been published or presented elsewhere in part or in entirety and is not under consideration by another journal.
Declaration of Conflicting Interests
The author(s) declared no potential conflicts of interest with respect to the research, authorship, and/or publication of this article.
Funding
The author(s) disclosed receipt of the following financial support for the research, authorship, and/or publication of this article: This work was supported by the Hunan Social Science Fund under Grant number 21ZDAJ007.