
Abstract
Since the reform and opening up to the outside world, China’s economy has created a remarkable growth miracle. However, as China enters the new normal economy, the world is full of doubts about its potential for economic growth. The article proper concerns an analysis on some factors affecting China’s economic growth, such as physical capital, labor quality, labor quantity, energy consumption, and environmental cost. Also embraced in this article is the measurement of the contribution of each factor to total factor productivity. The research is conducted on the basis of the provincial panel data of China over 2002–2016, from the perspective of cleaner production. The results reveal that (a) China’s economic growth had significant positive correlations with factor inputs, including traditional input elements (physical capital, labor quantity, labor quality) and natural elements (energy consumption and environmental cost); (b) the direct and indirect effects of physical capital, labor quality, and energy consumption on economic growth were significantly positive, while those of environmental cost were significantly negative; and (c) the contributions of the factors to the total factor productivity were ranked respectively as follows: physical capital (48.63%), energy consumption (16.81%), labor quality (14.85%), environmental cost (10.88%), and labor quantity (8.83%). China’s economic growth belonged to “perspiration.” In addition to the traditional input factors, natural factors also played an important role in boosting China’s economic development. It is urgent how to highlight the role of labor quality, while downplaying the contribution of natural factors, and then shift to cleaner production in China.
Introduction
Since 1978, China’s economy has created a “growth miracle,” drawing worldwide attention. However, after several decades of rapid development, China’s economic growth rate bid farewell to high growth speed and turned to medium-high speed. Particularly in recent years, China’ s economic growth rates have dropped to below 7%. Can China’s economy pick up its past rapid growth? What are the driving forces behind China’s economic growth? Is China’s economy moving toward cleaner production? These questions are filled with different voices questioning China’s economic growth.
To answer these questions, it’s necessary to analyze the driving power of China’s economic growth. Some scholars believe that the key power of China’s economic miracle is soaring inputs use. Chow (1993) attributed China’s economic growth of 1952–1980 to the capital accumulation. Krugman (1994) pointed out that China would ultimately face constraints on economics growth, because the economy relies heavily on inputs. Z. F. Hu and Khan (1997) noted that capital investment has been a major driver of China’s economic growth since 1952–1994. However, the contribution of total factor productivity (TFP) to economic growth was more than 40% from 1979 to 1994. Chow and Li (2002) estimated the driving force of economic growth of China in period of 1978–1998. Their study found that physical capital contributions were 66.34%, while the contributions of labor and TFP were 5.7% and 27.59%, respectively .Young (2003) stressed that China’s TFP growth rates were below 1.5%, arguing that the main reasons for the growth were sharp spikes in factor inputs (such as capital and labor). Characteristics of the Chinese economy at various stages, Maddison (2007) examined long-term economic performance on China’s economic growth.
Aoki (2012) believed that China, Japan, and South Korea have five stages of economic development, including Malthus stage, government-led stage, Kuznets stage, human capital base stage, and post-demographic transition stage. At different stages, China had different growth sources. Krugman (2013) believes that China was experiencing a trend of plummeting investment returns. No matter how hard the government works, investment would drop sharply, and substantial expenditures are needed to replace excessive dependence on investment. However, China’s consumption growth rate was not enough to avoid a severe economic recession. Utilizing the Solow residual method, P. Li et al. (2013) found that in 1978–2010, the contribution of physical capital was 56.72%, the contribution of labor was 8.82%, and the contribution of productivity was 34.46%. From 1978 to 2010, there is no doubt that physical capital investment was the main power of China’s economic growth. This showed that China’s economic growth was unsustainable. Once capital investment shrinks, China’s economic growth will face greater downward pressure. Some scholars, such as Dong and Liang (2013), Wu (2013), and Jiang et al. (2014), also believed that the first power of China’s economic growth was capital investment. Zou et al. (2019) studied China’s economic growth from 1978 to 2017 by using the transcendental logarithmic production function. The results showed that, from the perspective of historical development and the reality in China, the medium long-term power of high-quality economic growth in China in the new era would be to increase the contribution of TFP growth to economic growth in China.
Most studies, however, failed to take into account the ecological loss brought by China’s economic growth, which may lead to the bias of the measurement of China’s economic growth sources. Worse still is that such negligence might affect policy-making, bringing a negative effect on sustainable economic development. Therefore, scholars have tried to introduce resource constraint, energy constraint, and environmental constraint into economic growth model (Aghion & Howitt, 1998; Nordhaus & Weitzman, 1992; D. Romer, 2001; Sweeney & Klavers, 2007). R. X. Liu (2013) believed that although the environment has paid a certain price for China’s rapid economic growth, it is not the key factor of economic growth. Yang (2010) considered energy and physical capital as comprehensive physical inputs. He found that the sum contribution of physical capital and human capital was less than 50%; however, the TFP accounted for 54.48%. Yang and Zhao (2020) found that the model of China’s economic growth was not sustainable by introducing ecological factors into economic production function.
Since the mid-1990s, the contradiction between the sustained high growth of economy and environmental problems have stimulated the enthusiasm of scholars to explore China’s economic growth power. Based on research of Managi and Kaneko (2006) and A. Hu et al. (2008), environmental factors have been brought into China’s economic growth analysis framework. Although China is facing the constraints of resources, energy, and environment, the studies on the sources of its growth have borne fruit. H. Guo and Dong (2012), Z. B. Zhang and Pu (2014), and Yang and Zhao (2020) found that China’s economic growth was characterized by typical capital driving, energy consumption driving, and environmental loss driving.
However, the above studies did not touch upon the impact of spatial factors on economic growth. The theory of new economic geography shows that there are spatial correlations among regions, and the spillover effect caused by the correlation plays an important role in economic growth. Recently, with the rapid development of new economic geography, scholars have studied China’s economic growth from the perspective of spatial correlation. Nevertheless, these studies focus just on the spatial agglomeration effect of economy (Brun et al., 2002; Ding et al., 2013; Pan, 2010; Yu & Lv, 2009), convergence analysis (J. Zheng et al., 2009), and interregional spillover effect (Groenewold et al., 2005; G. C.Liu et al., 2019; Wen, 2014). Few studies have touched on China’s economic growth from the perspective of spatial factors. As China shifted from planned economy to market-oriented economy in 2001, the flow of production factors between different regions has not only improved the efficiency of resource allocation, but also strengthened the spatial correlation of economic growth, offering a functional channel for the external effects of economic growth. In this article, natural factors are considered to explore China’s economic growth from the spatial perspective. Different from previous studies, this article further distinguishes the direct and indirect effects of factors on economic growth and fully reveals the spatial effects of different factors. Direct effect indicates the influence of independent variables in a given region on the dependent variable, including feedback effects, meaning that the influence on other regions will in turn affect a given region. Indirect effects are known as spatial spillover effects, used to measure an explanatory variable in “adjacent” areas. Natural resources would be used expendably and lose their existence values, resulting in environmental pollution. In this article, environment is taken as a natural factor and introduced into the production function to analyze the factor input performance of China’s economic growth under the spatial correlation.
In addition, in the existing researches, the impact of technological progress on China’s economic growth was missing, such as the research done by Yang and Zhao (2020). Even if the TFP was taken into account, it was reflected in the form of Solow’s residual (Chen, 2009; A. Hu et al., 2008; S. X. Li & Huang, 2015; Yang & Zhao, 2020). However, the econometric regression cannot present the coefficient and significance of the residual containing all the factors unable to be observed directly. On the contrary, existing studies only estimated the impact or marginal effects of capital, labor, energy and environment on economic growth, failing to measure their specific contributions (A. Hu et al., 2008; Yuan & Ban, 2017). The overall factor productivity was the fundamental cause of differential growth rates of different models (G. C. Liu et al., 2019). This article adopts the non-radial input-oriented TFP model to compute the TFP, and decomposes the contribution of input factors to the TFP, and further investigates the main sources of China’s economic growth. This approach can not only intuitively analyze the way in which TFP acts on China’s economic growth, but also test the robustness of the above conclusions and judge the economic growth model of China.
In this article, it is found that China’s economic growth still mainly depends on capital accumulation. In addition to traditional investment factors, the natural factors also play an important role in promoting China’s economic development. China’s economic growth depends on exogenous factors with insufficient endogenous power.
The organization of this article is as following. The section “Non-Spatial Analysis of China’s Economic Growth” is the description of the data sources and analysis of China’s economic growth from the non-spatial perspective. “The Spatial Analysis of China’s Economy” section illustrates the spatial correlation facts of China’s economy, and deals with the choice of suitable econometric model for further empirical analysis on the performance of input factors. The “Factor Contribution Decomposition of TFP” section measures the contributions of individual factors to total productivity. The “Conclusions and Discussions” section involves the summary and recommendations for policy-making.
Non-Spatial Analysis of China’s Economic Growth
Model Construction
This article introduces the quality of labor force into function. In addition, the environment is also introduced into the production function as a natural factor, which is similar to ecological forms of social capital:

where
Taking logarithms on two sides of Equation 1, the regression model can be obtained as follows:

Data Sources
The panel data used in this article come from 30 provinces between 2002 and 2016, the provinces do not include Hong Kong, Macao, Taiwan, and Tibet. On December 11, 2001, China officially reentered World Trade Organization (WTO), signifying that China’s economy has entered the stage of market economy. Therefore, the data used in this article start from 2002 and ends in 2016, for the energy and environmental data after 2016 were not available. The data were derived from China Statistical Yearbook. In this article, GDP (gross domestic product) is considered a dependent variable, while independent variables are physical capital, labor quality, labor quantity, energy consumption, and environmental cost.
GDP was calculated according to constant prices in the year 2000.
The commonly used measurement method of physical capital stock is “perpetual inventory method.” See the study of Yang and Zhao (2020) for more details.
The labor force quality measured by the average educational level can be expressed as follows:

where
The quantity of labor force is measured by the number of people employed. Total energy consumption refers to the total amount of various non-renewable resources and energy consumed by a region in a certain period of time for production and living, mainly involving raw coal, crude oil, and their products, natural gas. See the study of Yang and Zhao (2020) for more details.
Environmental cost is from the study of Zhao et al. (2020). First, considering both industrial and agricultural pollution, one assessment system is constructed involving air, water, and land, and then the environmental cost is measured with the method of vertical and horizontal separation (Yang et al., 2018).
Table 1 presents the statistical descriptions of each variable.
Statistical Description.

It is obvious that the variance of the variable after taking the natural logarithm is obviously smaller than the original value. The natural logarithm of the variable makes the value more stable.
Result Analysis
First, the unknown coefficients of China’s economic growth equation are estimated by using ordinary least squares (OLS) regression, as shown in the second column of Table 2. The variance expansion factor is found much smaller than 10, indicating that there is no serious multicollinearity problem in the model. Because the data are panel data, it is necessary to judge whether the model should adopt fixed effect or random effect. The results of the Hausman test indicate that a fixed effect model should be used, and the estimated results are shown in the fourth column of Table 2. Each input variable and economic growth are of causality to each other. To avoid the error of coefficient estimation caused by endogeneity, this model is re-estimated by using the lagged variables of each input factor as the instrumental variables. Table 3 lists the results.
Estimated Results of China’s Economic Growth Model.

, and *** denotes the significance level at 10%, 5%, and 1%, respectively.
Regression Results of Instrumental Variables.

, and *** denotes the significance level at 10%, 5%, and 1%, respectively.
From the Hansen J and C statistics in Table 3, it can be seen that there should be no rejection to the original assumption that the tool variable cannot be recognized and the assumption that the tool variable satisfies exogeneity can be rejected. Therefore, the regression results are credible. From the results of IV regression, it can be concluded that China’s economic growth is positively correlated with physical capital, labor quality, labor quantity, energy consumption, and environmental cost. China’s economic growth can be explained by both classical growth theory and new growth theory. From the perspective of cleaner production, energy consumption is still an important input factor for China’s economic growth. Although China has created a world-famous economic growth miracle, it has paid costly energy and environmental prices. Energy consumption and environmental pollution have become one tough constraint on economic growth.
The Spatial Analysis of China’s Economy
The Economic Spatial Pattern
Figures 1 and 2 present maps with colored GDP of each province in 2002 and 2016, respectively. It can be observed that the distribution of GDP shows obvious regional agglomeration effect, with relatively higher GDP in coastal areas and lower GDP in inland areas.

Distribution map of China’s GDP in year 2002.

Distribution map of China’s GDP in year 2016.
To quantitatively describe the spatial correlation, Moran’s I is calculated. The calculation formula of Moran’s I index global spatial autocorrelation index is as follows:

where
Based on the GDP of each province from 2002 to 2016, the Moran’s I index can be computed, as listed in Table 4, depicting the degree of correlation and spatial agglomeration of GDP.
Moran’s I Index of GDP in China Over 2002–2016.

Note. GDP = gross domestic product.
, and *** denotes the significance level at 10%, 5%, and 1%, respectively.
From Table 4, it can be seen that the Moran’s I index of China’s GDP from 2002 to 2016 is higher than 0.25, and all of them have passed the 5% significance test. The results show that the GDPs of provinces are positively correlated in space. Namely, the regional GDP would be affected by the adjacent regions, or the regions with high GDP are adjacent to each other, so are the regions with low GDP.
Spatial Modeling
Because of the existence of spatial correlation, the economic growth equation should include spatial factors. To estimate the spatial growth equation of GDP correctly, it is necessary to select the most appropriate one among different spatial panel models for parameter estimation. Thus, this article estimated the model without spatial interaction, calculated the Lagrange multiplier statistics of the corresponding model, and tested the joint significance of spatial and temporal fixed effects, as shown in Table 5.
The Estimation, Lagrange Multiplier Test, and Significance Test of Non-Spatial Panel Model.

, and *** denotes the significance level at 10%, 5%, and 1%, respectively.
According to the results of Lagrange multiplier test and the combination test on fixed effects in Table 5, it can be found that both spatial and temporal effects reject the original hypothesis at a significant level of 1%, indicating that the model should include both spatial and temporal fixed effects. Thus, Lagrange multiplier statistics should be obtained on the basis of a double-fixed model. From the estimated parameters of the spatial and temporal fixed effect model in column 5 of Table 5, we can observe that Lagrange multiplier spatial lag and robust Lagrange multiplier spatial lag have passed the significance test, while Lagrange multiplier spatial error has not, indicating that the model is suitable for the spatial lag model.
Based on the above tests, spatial lag model of China’s economic growth equation is established as follows:

where
With MATLAB software, the parameters of the provincial economic growth spatial model in China can be obtained, as shown in Table 6. From the estimation results, it can be seen that the coefficient of the explanatory variable of spatial lag is 0.1270, and it is significant at the level of 1%, indicating that there is spatial spillover effect of economic growth, and that the improvement of economic growth in one province could have a positive inducing effect on the economic growth of its neighboring provinces. The explanatory degree of economic growth has risen to 99.9%, suggesting that the spatial effect factor should be included in the analysis of provincial economic growth.
The Estimated Results of Spatial Lag Model.

, and *** denotes the significance level at 10%, 5%, and 1%, respectively.
For avoiding the error in using point estimation method to test spillover effects of variables, LeSage and Pace (2010) proposed to divide the coefficients into direct effects and indirect effects according to the sources of the influence of explanatory variables on the explained variables.
Based on the estimated results in Table 6, and in combination with the above-mentioned methods, we can acquire the direct effect, indirect effect, and overall effect of the explanatory variables of the spatial lag model (SAM) on GDP, as shown in Table 7. The direct effect means the influence of a certain factor on the economic growth of the province, and the indirect effect refers to the influence of a certain factor on the economic growth of neighboring regions.
The Effect Test of Input Factors on Economy.

, and *** denotes the significance level at 10%, 5%, and 1%, respectively.
From Table 7, it can be observed that the direct and indirect effects of physical capital, labor quality, and energy consumption on economic growth are significantly positive, indicating that the promotion of these three factors in a province could not only promote its economic growth but also boost the economic growth of its neighbors. The direct effect of physical capital is to improve the living environment, attract domestic and foreign investment, and promote the economic growth of the region. The indirect effect is mainly achieved through the role of other capitals, such as environmental capital, human capital, or social capital from the adjacent provinces. The role of labor quality on economic growth is mainly reflected in the impact of technological innovation. Technological innovation is diffusive, so it can not only lead to the progress of these factors, but also produce spatial spillover effects. The diffusion is beneficial to updating the production technology level of adjacent regions and indirectly promotes the economic growth of adjacent provinces. The direct effect of energy consumption is significantly positive, indicating that provincial economic growth in China depends on energy consumption, and excessive energy consumption becomes an important source of economic growth. The indirect effects of energy consumption are positive, possibly due to the positive spillover and “diffusion-reflux” effects of inter-provincial energy efficiency in China, promoting the optimal allocation of energy among regions (H. Zhang & Feng, 2015; Zhou et al., 2017). Although the indirect effect of labor force on economic growth is positive, it is not significant. The reason is that the “invisible hand” of market could allow society’s limited resources, especially labor resources, to flow to efficient or effective sectors or areas. At a market, when neighboring regions have a competitive effect on the labor force, the labor force will flow to the region with high wage level, thus weakening the spillover effect. The direct and indirect effects of environmental cost are significantly negative, indicating that environmental pollution is not only negatively related to local economic growth, but also has a negative “spillover effect.” Because of the spatial correlation of environmental pollution between neighboring regions, when a region is polluted, the environmental quality of neighboring regions will also suffer and the environmental cost of economic development in the surrounding regions will rise.
Factor Contribution Decomposition of TFP
The results in “The Spatial Analysis of China’s Economy” section confirm Paul Krugman’s doubts about the economic boom in East Asian countries, such as China. However, the above econometric model and empirical analysis cannot be applied to measuring contribution. Although capital accumulation still occupied a dominant position in different growth models, TFP was the fundamental cause of differential growth rates in different models (G. C. Liu et al., 2019). Thus, in this article, the non-radial input-oriented TFP model is adopted to measure TFP by breaking it into different parts. Taking constant price GDP from 2002 to 2016 as output and treating physical capital, labor, energy consumption, and environmental cost as input, the computation of the contribution of each factor to TFP is conducted with MaxDEA software. Table 8 presents the results.
Decomposition of Contribution of Each Factor to TFP (Unit: %).

Note. TFP = total factor productivity.
Except years 2008, 2012, 2015, and 2016, the contribution of physical capital to TFP is less than 10%. Overall, the contribution of physical capital presents two peaks. The first peak appeared in 2008, caused by the outbreak of the international financial crisis in 2008. Consequently, China’s economic growth slowed down rapidly and the economy was facing the risk of a hard landing. To cope with this crisis, Chinese government increased investment in physical capital, pushing the contribution of physical capital to the first peak. In 2012, the central and local governments developed infrastructure, pushing the contribution of physical capital to the second peak. Correspondingly, the contribution of labor quality, labor quantity, and environmental pollution to TFP underwent two troughs, in 2008 and 2012, respectively, owing to the overcrowding of physical capital, weakening the contribution of the remaining elements. In the other years, the contributions of labor quality were higher than 14%, and showed an upward trend, manifesting that the role of labor quality on TFP is positive, and that the role is strengthening. Contrary to the changing trend of labor force quality contribution, the labor force quantity contribution to TFP shows a downward trend, indicating that China’s economy is changing from relying on labor force quantity to relying on labor force quality, and the role of labor force in economic development is being optimized. From 2003 to 2012, the contribution of energy consumption to TFP shows an overall upward trend except year 2008, while from year 2012 to 2016, it showed a downward trend first, but then an upward trend. The contribution of environmental cost to TFP went through two low peaks, the one in 2008, due to the squeeze of material capital contribution, and the other in 2012, due to the fact that China incorporated the construction of ecological civilization into the Party Constitution, giving way to green development. However, from 2012 to 2015, the contribution of environmental cost to TFP showed an overall upward trend, indicating that China was still facing challenges on the way to green development. China can force oligarchs to take the road of energy saving and emission reduction, cleaner production, and green development (Xin, 2019).
Table 8 shows ranking of the contributions of different factors to economic growth: physical capital (48.63%), energy consumption (16.81%), labor quality (14.85%), environmental pollution (10.88%), and labor quantity (8.83%). From the perspective of the volatility of each contribution, the contribution of physical capital tends to fluctuate most, followed by the contribution of labor quality and the contribution of energy consumption. The last two places go to environmental costs and the number of workers, illustrating that Paul Krugman’s doubts about the economic boom in China are reasonable.
In this article, input factors are defined to be physical capital, labor quality, and labor quantity, and natural factors to be energy consumption and environmental cost, and their contributions to TFP are analyzed. Their contributions over 2003–2016 are shown in Figure 3.
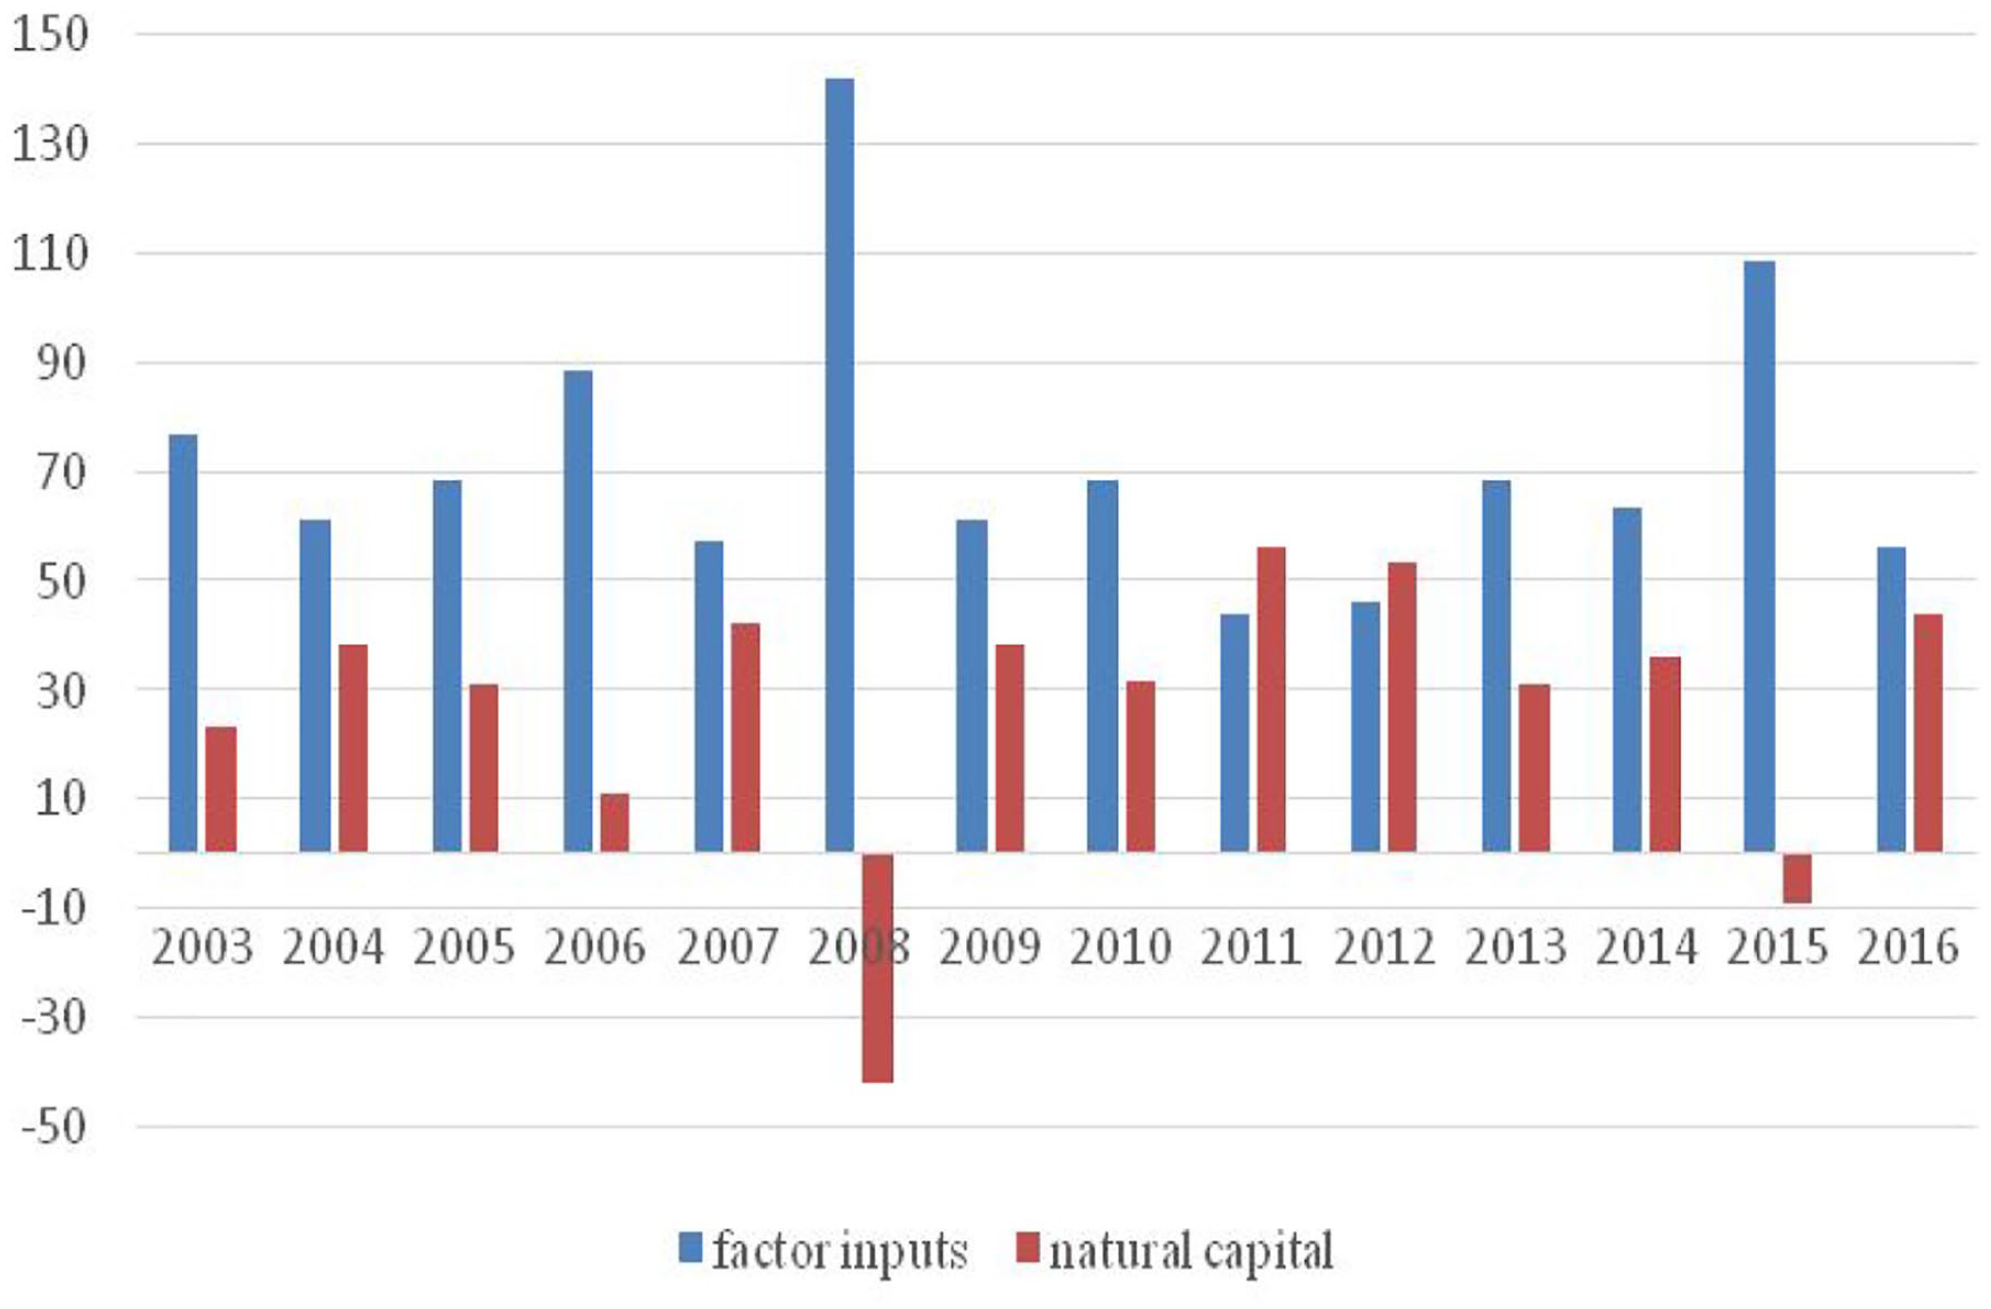
Column chart of factor input and ecological capital contribution.
From year 2003 to 2010, the contributions of input factors are consistently higher than those of natural factors. The contributions of natural factors from 2011 to 2012 are higher than those of input factors. After 2013, the contributions of input factors still remain dominant. The evolution of two contributions testifies China’s “perspiration” economic growth.
In addition, it can also be found that the natural factors play an important role in promoting China’s economic development, indicating that China’s economic development has paid a price for resources and environment. How to shift toward cleaner production is an urgent problem to be solved in China.
Conclusions and Discussions
The doubts about the potential of economic growth in China, on one hand, stem from doubts about efficiency, that is, whether there is efficiency improvement in China’s economic growth. The neoclassical economic growth theory divides economic growth into “input driven growth” and “efficiency growth.” Krugman (1994) thought that the former is caused by the increase of inputs, such as the increase of labor input and physical capital (such as machinery, construction, roads, etc.). Another aspect of doubts lies in the quality of the country’s growth, that is, whether it belongs to the cleaner production. Based on the panel data of provinces in China from year 2002 to 2016, this article tries tentatively to answer the questions by using the spatial econometric model and efficiency decomposition method.
The results reveal that China’s economic growth is significantly positively related to physical capital, labor quality, and energy consumption, and that their direct and indirect effects are significantly positive, while the direct and indirect effects of environmental depletion are significantly negative. In terms of efficiency sources, the contribution of physical capital to TFP ranks first (48.63%), followed by energy consumption (16.81%), labor quality (14.85%), environmental cost (10.88%), and labor quantity (8.83%).
China’s economic growth still mainly depends on physical capital, belonging to “perspiration” growth. However, in addition to the traditional input factors, natural factors also play an important role in promoting China’s economic development. Their contribution is higher than that of labor quality. Although this article does not directly examine the efficiency of China’s economic growth, from the view of contribution of TFP, the quality of labor force has not yet become an important force to promote economic development. The sustainability of China’s economic development lies not in the increase of TFP, but in the optimization of its driving force. In terms of cleaner production, no matter whether the technological progress is considered or not, China’s economic growth has not got rid of natural factors, so the growth mainly depends on exogenous factors, and the endogenous power is insufficient.
China’s economic development has paid a price for resource and environment. It still remains an urgent problem to be solved in China how to shift to cleaner production, which relies on high-quality labor force, low energy consumption, and low pollution. Based on the empirical results of this article, for China’s future economic growth, importance should be attached to gradually strengthening the role of high-quality labor force and weakening the role of natural factors. In addition, focus on economic development should be changed from exogenous impetus to endogenous one, leapfrog “Krugman query,” providing East Asia and other countries with China’s practice of development transition. Changing the mode of development, continuously improving the quality of economic development, and realizing cleaner production are the core contents of creating an “upgraded version” of China’s economy. The following are our suggestions.
China should speed up its technological innovation capability and improve the driving force of technological progress. Great importance should be attached to innovation investment, even though innovation is a high-investment and high-risk industry. In addition, it is necessary to continuously elevate the level of education, to provide quality workers and enable them to have the necessary knowledge and technical application ability for innovation.
The speed of economic development should be controlled within a reasonable range. China is a developing country and must maintain a certain growth rate, but is the higher the growth rate, the better? From China’s development experience, it can be concluded that although a fast-growing economy can significantly improve social welfare, there will be more demand for energy, raw materials, and other resources, resulting in higher energy prices and lower living standards of residents. Moreover, due to the expansion of production, pollution emissions will increase and the environment will deteriorate. This requires China to adjust its growth expectations, optimize its economic structure, and foster new impetus.
This article may have some limitations. For example, the treatment of endogenous variables. On one hand, variables such as education or physical capital will affect economic growth, on the other hand, economic growth will also have an impact on education and physical capital. Lien et al. (2015) found that the government’s policy on physical capital allocation may affect individuals’ education choice, which will in turn affect the structure of labor and the structure of industries. It is also likely that government’s retirement policy, which will affect the structure of labor, may depend on the structure of industries (Feng et al., 2020). It is also likely that government’s retirement policy, which will affect the structure of labor, may depend on the structure of industries. We put more effort to solve this problem. In regression analysis, to avoid endogenous errors, we have carried out instrumental variable regression on each input factor. In addition, the decomposition of TFP is another verification of the robustness of the conclusion. How to better deal with the endogenous problems in economic growth is a point that may be improved in the future.
Footnotes
Declaration of Conflicting Interests
The author(s) declared no potential conflicts of interest with respect to the research, authorship, and/or publication of this article.
Funding
The author(s) disclosed receipt of the following financial support for the research, authorship, and/or publication of this article: The author(s) supported by the Shandong Provincial Natural Science Foundation (No. ZR2020QG028); and the Shandong Philosophy and Social Science Planning Project (No. 21DJJJ15).
Ethical Approval
The authors state that an ethics statement (including the committee approval number) for animal and human studies is not applicable.