
Abstract
This study applies a spatial econometric model to examine the impact of three-dimensional distance on interprovincial tourism economic spillover effects using panel data from 30 provinces in China from 2010 to 2019. The impacts of technological innovation, ecological environment, informatization level, industrial structure, infrastructure facilities, and location, on the indirect effect of the tourism economy are comparatively analyzed. It explores the regional characteristics and developmental changes of tourism economic spillover. The results show that, first, based on the three spatial matrices, the direct and total effect values of technological innovation are the largest when close to each other, and technological innovation among provinces with higher economic volumes significantly promotes positive interprovincial tourism economic spillover. Second, ecological environment is the main promoting factor of positive tourism economic spillover among neighboring provinces in China’s western region. Third, industrial structure optimization shows a significant positive spatial spillover effect. Fourth, with gradual infrastructure improvement, the influence of infrastructure facilities on the spillover effect of interprovincial tourism economy weakens gradually. Fifth, improved information technology levels can effectively promote positive spatial spillover of the tourism economy. Sixth, the influence of location on the positive spatial spillover of the interprovincial tourism economy shows a gradually increasing trend.
Keywords
Introduction
Tourism is a major driving force of the world economy, accounting for 7% of international trade (Pololikashvili & Gurría, 2020). Many scholars also confirm the important contributions of tourism to economic growth, job creation, and foreign currency earnings (Deng et al., 2021; Tribe, 2020). The tourism economy has been a key concern in the tourism research literature (Andraz et al., 2016; Song et al., 2018). According to the United Nations World Tourism Organization’s estimates of China’s tourism development over the years, the combined contribution of China’s tourism industry to the national economy and social employment exceeds 10% (National Development and Reform Commission of China, 2018). However, China’s tourism economy, characterized by obvious imbalances, still faces several challenges, including the prominent contradictions of imbalance and insufficiency and significant differences in regional development levels (J. Wang et al., 2017). There are two ways to address the problems in regional tourism economic development: tourism inside the region itself and the positive influence of other regions (Andraz et al., 2016). Spillover effects of the tourism economy among neighboring regions result in tourism economic growth, which is fully demonstrated and centrally appraised in recent studies (Paci & Marrocu, 2014; Romão & Nijkamp, 2019; Tian et al., 2022; Yang & Fik, 2014).
Specifically, tourism is a spatial phenomenon that is susceptible to geographic concentration processes (Carreras & Verdaguer, 1995) and closely related to many other economic sectors, while spatial dependences on tourism supply and demand, and a particular spatial interaction among tourist destinations are observed. It is not surprising that the tourism economy has the potential to generate regional spillovers, including positive and negative impacts (Alola et al., 2019; H. Li et al., 2016). The positive effects imply that a region can benefit from tourism growth in neighboring regions (Majewska, 2017). Scholars have studied the factors influencing tourism economic spillover from different perspectives (Andraz et al., 2016). The regional environment, economic development level, and industrial structure have a significant negative effect on the spillover of the tourism economy, which can weaken the economic growth of neighboring regions (Zhao, 2016). Meanwhile, the consumption of information technology (IT) (Wang et al., 2019), tourism infrastructure facilities, and location transportation conditions—all have a significant positive spatial spillover effect (Chen et al., 2020a).
Furthermore, Tobler’s first law of geography (1970, p. 2) states, “Everything is related to everything else, but near things are more related to each other.” Diverse dimensions of proximity, especially spatial distance (Lubov et al., 2016) and economic distance (Álvarez-Ayuso et al., 2016), are likely to determine the intensity and direction of tourism economic spillovers. For example, J. Liu et al. (2013) argue that tourism agglomeration has significant localized characteristics and that its effects decline with increasing spatial distance. Torre and Rallet (2005) raise the question of the negative effects of geographical proximity. Meanwhile, regional tourism economic activities are time-series and differential (X. Y. Wang & Lu, 2020). Therefore, the perspective of dynamic spatio-temporal evolution cannot be ignored while understanding the factors affecting regional tourism spillovers, which has both practical significance and theoretical value. However, the utilization of spatial analysis methods in tourism studies is rather recent and still relatively rare, with a significantly small number of papers published in the last few years (Romão & Nijkamp, 2019), especially on multiple factors influencing tourism spillovers (J. Y. Wang & Zhang, 2021).
Hence, from the dynamic spatio-temporal evolution perspective, this study applies the spatial econometric model based on a multidimensional distance to explain the multi-factors influencing tourism economic spillover in Chinese provinces, which is important for promoting sustainable tourism development and narrowing regional economic gaps.
There are many contributions of this study. First, compared to existing research that focuses on qualitative analysis and static perspective, this study conducts a spatial econometric analysis of China’s tourism economic spillover effects by using provincial panel data from 2010 to 2019, while quantifying and comparing spatial and temporal evolutionary characteristics of the factors affecting provincial tourism economic spillovers. Second, existing research pays more attention to measuring the contribution of a single factor or the interaction of the two while ignoring the nature of provincial tourism economic spillover resulting from multi-factors. From a comprehensive analysis perspective, this study examines the specific contribution and its degree of technological innovation, ecological environment, industrial structure, infrastructure, economic openness, informationization, and location to the tourism economic spillover, thereby identifying the key factors of the tourism economic spillover at every stage. Third, as some studies ignore the mediating role of multidimensional distance, this study considers the three-dimensional distance and establishes that spatial proximity is a key factor in technological innovation for positive tourism economic spillovers. Both geographical and economic distances are key factors for positive spillover from the ecological environment to the tourism economy, and economic distance is a key factor for positive spillover from an industrial structure.
The remainder of this study is organized as follows: Section 2 provides the literature review; Section 3 presents the method; Section 4 details the empirical results, heterogeneity test, and robustness check; and Section 5 presents our conclusion and discussion (including conclusions, recommendations, and limitations).
Literature Review
Bodio (1899) was the first to study tourist activities and costs of foreign tourists in Italy from an economic perspective. Later, scholars developed economic tourism studies from diverse perspectives. The tourism industry is closely related to many other economic sectors, such as agriculture, construction, and retailing (H. Li et al., 2016). It has a high degree of specificity compared to other economic industries and sectors (Majewska, 2017). The tourism economy can be influenced by the combined forces of tourists, information, knowledge, and capital flows (Hashim & Murphy, 2007; Weidenfeld et al., 2010; Yang & Wong, 2012) which promote the spillover effects of the tourism economy. The correlation and spillover effects between different cities (Bo et al., 2017), regions (Alola et al., 2019), and countries (Škrinjarić, 2019) are confirmed by scholars across different countries. The main methods used in previous studies are the gravity model (Kadiyali & Kosová, 2013), social network analysis (Kelman et al., 2016; Zuo & Yang, 2021) geographically weighted regression model (Liu et al., 2021), data envelopment analysis (S. Li et al., 2022), spatial panel measures (Eleftheriou & Sambracos, 2019), and so on. Hence, there are six main contributing factors to the spatial spillover effect on the tourism economy in the existing studies, which can be summarized as follows:
Song and Song (2011) argue that there is an obvious spatial spillover effect of innovation on tourism economic growth in China’s provinces, which not only dominates the growth of the tourism economy itself but also has a positive tourism economic spillover effect on the neighboring regions through the spatial transmission mechanism. According to He and Wang (2020), technological innovation has positive spillover effects on neighboring regions through the “teaching and demonstrating by themselves” of tourists and the “advanced experience” of tourism enterprises, that is, the flow of tourists and knowledge. Romão and Nijkamp (2019) argue that the spatial patterns associated with the development of regional innovation systems at the European level have not been resolved, and that technological development is important for developing and transforming European tourism; thus, they examine whether and how it affects regional tourism competitiveness. Zaidan (2017) finds that tourism development can be hindered by IT because of its high cost, online security, and lack of professional IT labor. Kumar et al. (2019) argue that information and communications technology has both direct and indirect effects on the tourism economy, thus promoting positive tourism economic spillovers.
According to Kim and Park (2016), the ecological environment is a prerequisite for the survival and development of the tourism industry. Z. Liu et al. (2022) investigate the spatial spillover, direct and indirect, and the overall effect of tourism development on environmental pollution through the spatial econometric method. Furthermore, Zhao (2016) points out that the regional environment weakens the growth of the tourism economy in neighboring provinces by creating a “cut-off effect” on the various resources for the growth of the tourism economy. Tong et al. (2021) argue that the spatial spillover from the environmental and economic system transmits the effects of the tourism economy on the local economic and environmental systems of neighboring areas.
In economics, information infrastructure, IT, and so forth are non-exclusive, and Teng et al. (2006) believe that this non-exclusivity is the fundamental reason for the occurrence of spillover. Furthermore, Joppe and Li (2016) argue that the spillover effects of IT indirectly promote the development of the tourism industry in neighboring regions through the complementary advantages of the tourism industry in the region. Sun (2016) believes that informatization has promoted the process of tourism growth in terms of tourism destination information acquisition, tourism decision-making, tourism transaction implementation, and tourism experience sharing. Jayaraman and Makun (2020) propose that the development of information and communication technologies has reshaped the mechanism through which tourism operates, leading to changes in the dynamics of tourism growth. Ramos and Rodrigues (2013) suggest that the popularity of the internet has led to an increase in tourists’ pursuit of new demands for tourism products and services.
Álvarez-Ayuso et al. (2016) report that the spillover effects of transportation infrastructure are positive for developed regions and negative for less developed ones. Transportation infrastructure (Tian et al., 2022), high-speed railroads (Tian et al., 2022), and highway traffic development (Guo et al., 2021) have positive spatial spillover effects on the tourism economy of Chinese cities. Yang and Wong (2012) propose that infrastructure facilities have differences in attraction to tourists from different countries and generate spatial spillover effects on the tourism economy through tourism flows. Yang and Fik (2014) find that the total effect of hotel infrastructure is estimated to be 1.063 and that hotel infrastructure has a positive spatial spillover on inbound tourists, while the opposite is true for domestic tourists. K. Wang et al. (2016) report a significant spatial competition effect for service facilities in the pan-Yangtze River Delta and, therefore, a negative spatial spillover to the tourism economy.
Brida et al. (2010) believe that the industrial structure, especially the tertiary sector development, is the basis of tourism development and supports it. Q. Wang et al. (2020) find that industrial structures can directly or indirectly affect the tourism economy. Lazzeretti and Capone (2009) argue that the regional industrial structure should be measured by the proportion of the tertiary industry. The better the industrial structure, the higher the government investment incentive, and the more complete the regional tourism support facilities (G. Q. Li et al., 2018). H. Li et al. (2016) propose that regional productivity differences will be formed in the process of changing industrial structure, and resources (mainly labor) will move, thus promoting the tourism economy to produce spatial spillover. Wang and Liu (2018) point out that the industrial structure will have a negative spatial spillover effect on the regional tourism economy. Ding and Lin (2018) believe that industrial structure development can send tourist flow to neighboring regions and increase off-site consumption. Moreover, the transformation and upgrading of industrial structures drive the development of the domestic tourism market in neighboring regions through the spatial imitation effect, and the expansion of the local market scale promotes the growth of the domestic tourism economy in neighboring regions to a certain extent.
Two main research findings exist on location-generating spatial spillover effects on the tourism economy. First, Xue et al. (2016) find that location conditions are closely related to the factors influencing the distribution of tourism industry agglomerations and that they can generate significant spatial spillover effects. Second, the choice of travel distance, transportation mode, and duration of stay depend on location. Yang and Wong (2012) reports that travel distance, travel party, trip purpose, travel transport, and length of stays inform multi-destination trips. As a result of tourists’ multi-destination trips, spillover effects in tourism flows were strengthened (Yang & Wong, 2012), thus generating positive spatial spillover effects on the tourism economy through tourist flows. Majewska (2015) highlights the importance of agglomeration economies in contributing to spatial spillovers in visitor flows and argues that agglomeration can spread beyond the borders of geographic units. Capone and Boix (2008) assert that tourism industry agglomeration could generate talent and knowledge spillover, promote the optimization of the tourism industry structure in the region, and accelerate regional tourism growth. Zhang et al. (2020) find that the spatial spillover of tourism industry agglomeration cannot be ignored and measure the total spatial spillover effect of tourism industry agglomeration factors in China as 0.39.
In summary, scholars have proven that the tourism economy is spatially related, and has spatial spillover effects and regional and spatial-temporal differences. They have also analyzed the various influencing factors of tourism economic spillover. However, the following shortcomings are found: first, the existing studies have focused more on the relationship between tourism economic spillover and economic growth, or on exploring a single or dual variable and tourism economic spillover for the study of regional tourism economic spatial spillover influencing factors. Scholars ignore that multiple factors accompany tourism economic spillover, and no comparative analysis of the degree of importance of each factor is implemented. Second, the research sample period is outdated or too short in the existing studies on factors influencing China’s tourism and economic spatial spillover.
What are the main factors influencing the spatial spillover effect of the tourism economy of Chinese mainland provinces? How much is the degree of contribution of each influencing factor at each tourism development stage? How can we develop effectively and stably through spatial spillovers based on different spatial distances? These questions are yet to be studied.
Therefore, this study takes the tourism economy of 30 Chinese mainland provinces as a research example and comparatively analyzes the indirect effects of technological innovation, ecological environment, informatization level, industrial structure, infrastructure facilities, and location, on the tourism economy based on spatial adjacency, geographical distance, and economic distance, to identify the regional spillover effect differences in the tourism development process. This study can help promote the development of China’s provincial tourism economy and the coordinated development of the regional economy by exerting the spatial spillover effects of each influencing factor.
Method
Data Sources
Given the authenticity, continuity, and availability of the data, this study employs China’s 30 mainland provincial panel data over the 2010 to 2019 period, and the data detailed sources are (1) China Statistical Yearbook (2011–2020), (2) China Science and Technology Statistical Yearbook (2011–2020), and (3) China Cultural Relics and Tourism Statistical Yearbook (2015–2020). Specifically, the dataset covers 30 mainland Chinese provinces, municipalities directly under the central government, and autonomous regions in China, except Tibet, Hong Kong, Macao, and Taiwan (These four regions are excluded owing to the serious lack of data in the Tibet Autonomous Region, and the inconsistency of the statistical caliber of Hong Kong, Macao, and Taiwan). Based on these, the total number of study samples is 300, and the study sample period ranges between 2010 and 2019, including two sub-periods (2010–2014 and 2015–2020), and all data in this study are from official data issued by the National Bureau of Statistics and 30 provincial statistical offices of China.
Measure of Constructs
Explained Variables
Tourism economic development: Herein, the logarithm of tourism receipts is used as an indicator of tourism economic development (Fayissa et al., 2011; Lee & Chang, 2008). As the data on total tourism receipts for certain years and some provinces in China are incomplete, the inbound tourism travel data issued by the National Bureau of Statistics for each province are employed to calculate the total tourism receipts of each province. This is done by converting them into RMB, according to the annual average exchange rate, and aggregating them with domestic tourism revenue.
Explanatory and Control Variables
Previous studies have shown that tourism’s economic development is influenced by multiple factors. Therefore, to minimize the bias of the estimation results caused by omitted variables, we consider other factors influencing the spatial spillover effects of the tourism economy. Based on existing studies, this study selects six main explanatory variables: technological innovation, ecological environment, infrastructure facilities, industrial structure, informatization level, and location. The degree of economic openness, cultural atmosphere, and resource endowment are added as control variables. The logarithm of research and development (R&D) expenditure is used to represent technological innovation(Romão & Nijkamp, 2019); the logarithm of green area per capita is used to represent the ecological environment (Q. Wang et al., 2020); the logarithm of the number of star-rated hotels represents infrastructure facilities (Yang & Fik, 2014); the proportion of tertiary industry output value to the gross domestic product (GDP) is used to represent industrial structure (Capone & Boix, 2008); and the logarithm of internet access ports is used to represent the level of IT development (Kumar et al., 2019); the logarithm of passenger turnover represents the location (Zhao & Chen, 2020). The total import and export as a proportion of GDP measures the degree of economic openness (Tang et al., 2020); the logarithm of the number of museums represents cultural atmosphere; and the logarithm of the number of A-class scenic spots represents resource endowment.
Spatial Measurement Model Design
Moran’s Index Correlation Analysis
The prerequisite for spatial econometric analysis is the existence of the spatial correlation of data. The main measures are Moran’s index (Moran’s I) (Moran, 1950), Geary’s coefficient (Geary, 1954), and Getis-Ord (Getis & Ord, 2010). Moran’s I is mostly used at present. The spatial autocorrelation calculation is based on the spatial weight matrix; in this study, the economic distance, geographic distance, and spatial distance matrices were normalized. The formula for Moran’s I is shown in Equation 1.
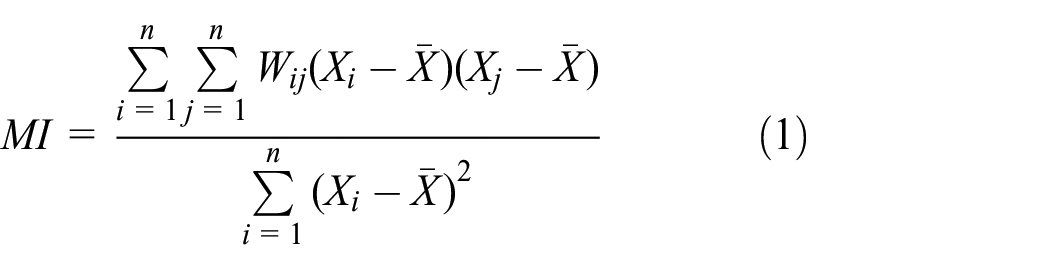
In Equation 1, Xi expresses the observation of the province i;
Model Setting
Anselin et al. (1997) propose that spatial analyses and econometric models could reasonably explain spatial phenomena and assess the spillover effects of a sample of large geographic units. Accordingly, the maximum likelihood estimation method is used in this study, and spatial lagging terms are introduced to analyze the spatial spillover effects of the tourism economy in different spatial and temporal dimensions in 30 individual mainland Chinese provinces from 2010 to 2019. Stata 15.0 software is used for the analysis. The three types of standardized spatial weight matrices included economic distance

In Equation 2, LnTRit denotes the logarithmic form of tourism economy development in province i in year t; α0 denotes the constant term, β1-β6; and φ denotes the regression coefficients of each variable, respectively. Furthermore, ρ denotes the spatial autocorrelation coefficient of this model,
Results
Before conducting the spatial autocorrelation analysis, it is preferable to avoid the problem of pseudo-regression. Therefore, an ordinary least squares regression is performed for each indicator pertaining to the constructed model. Accordingly, the individual and mean values of each influencing factor’s variance inflation factor (VIF) are found to be less than 10 (see Table 1), indicating no serious multicollinearity. Thus, the basis for performing regression analysis is present. To identify whether the research object has spatial correlation, Moran’s I is used for the spatial correlation analysis, and the results show that the explained and explanatory variables in this study have significant positive spatial autocorrelation from 2010 to 2019 (hence, the basis of the spatial analysis). Furthermore, the likelihood ratio and Hausman tests are conducted for the models based on the three spatial weight matrices. Results show that the spatial Durbin model has the advantage of considering the spatial correlation of the dependent and independent variables. Based on the selection of samples and variables, Pesaran and Frees tests are used for the cross-sectional correlation before spatial econometric analysis (Frees, 1995; Pesaran, 2021), and the results show no cross-sectional correlation problem. To control the endogeneity, this study firstly uses the data from large surveys with good randomization and measurement reliability and validity, secondly adopts Maximum Likelihood in estimating spatial panel data models as implemented in StataSE.15 based on existing research (Bo et al., 2017; Yu et al., 2013), thirdly applies explanatory variables with one lag in the robustness test part (Franzese & Hays, 2007; Yang, 2020).
Selection and Quantification of Variables and Test Results.

Main Effect Analysis
Main Effect Regression Results by Stages.

, **, and *imply that correlation is significant at the .01, .05, and .1 levels, respectively.
By observing the values of the goodness of fit (R2) and log maximum likelihood (LOG-L) based on the three spatial weight matrices (Table 2), the mean value of the model’s goodness of fit is higher than 70%. This indicates credibility and that the regression results are significant.
Effect Decomposition
To further identify the specific effects of each influencing factor on tourism’s economic spillover for the period 2010 to 2019, each factor’s direct and indirect effects are decomposed using the partial differential method, where
Effect Decomposition Results.

, **, and *imply that correlation is significant at the .01, .05, and .1 levels, respectively.
Heterogeneity Test
Past studies have shown that China’s tourism economy suffers from uneven regional development, and spatial econometric models generally assume a universal spillover coefficient for all observations, which tends to mask spillover heterogeneity across different pairs of destinations. To fully explore the differences in factor influences formed by the heterogeneity of each region, previous studies and the statistical standards of the National Bureau of Statistics of China are accessed for this study to divide the study sample into three regions: East, West, and Central. The gaps between these regions are mainly reflected in their economic disparity. Therefore, a main effects regression analysis on the panel data of the three regions for the 2010 to 2019 period is conducted based on the economic distance matrix. Table 4 shows the results of the analysis.
Regression Results of Three Major Regional Effects.

, **, and *imply that correlation is significant at the .01, .05, and .1 levels, respectively.
Robustness Tests
A common method for testing the robustness of data results is to replace the observations of the relevant variables. Therefore, the original indicator of technological innovation is replaced with R&D funding data (lagging by 1 year), which also indicates that the endogenous estimation bias possibly resulting from bidirectional causality and missing variables does not exist. Additionally, the industrial structure as the economic development indicator is replaced with the GDP per capita deflated for the base 2010 period for the spatial econometric analysis.
Robustness Test Results.

, **, and *imply that correlation is significant at the .01, .05, and .1 levels, respectively.
Discussion
Conclusions
Based on the economic distance, spatial proximity, and geographical distance matrices, when technological innovation increases by 1%, the direct effect on the provincial tourism economy increases by 0.3444%, 0.467%, and 0.326%, respectively. This finding indicates that technological innovation is the main driver of China’s provincial tourism economy (J. Y. Wang & Zhang, 2021). Based on the aforementioned matrices, the indirect effect of the tourism economy increases by 0.474%, 0.362%, and 0.318%, respectively, for each 1% increase in the technological innovation factor.
Comparing the contribution of technological innovation to the degree of tourism’s economic spillover in Central, East, and West China, the intensity of the contribution of positive technological innovation in terms of spillover effects in the three regions can be shown as Central > East > West. Put differently, the degree of contribution from technological innovation to tourism’s economic spillover is the greatest in Central and East China, and the weakest in the West (i.e., less than 50% of that for the central and eastern regions). The economic development level of the eastern and central provinces of China is generally high, whereas the economic development of the western provinces is relatively backward. Technological innovation capacity, the level of industrialized application of technological innovation, and the level of tourism business elements in the western provinces of China are lower than those in the eastern and central provinces. Consequently, the positive spillover effect of technological innovation on the tourism economy in western provinces is also the weakest. Technological innovation significantly promotes positive spatial spillover effects on the tourism economy for provinces with close three-dimensional spatial distances and high economic aggregates.
Based on the spatial weight matrices of economic distance, spatial adjacency, and geographical distance, the spatial spillover effect of the tourism economy increases by 0.315%, 0.223%, and 0.303%, respectively, for every 1% improvement in the ecological environment.
The ecological environment is the main contributing factor to the positive spatial spillover of the tourism economy among neighboring provinces in the western region of China. The tourism economy in the western region is a resource-driven development model with unique natural resources and minority cultures. For example, Guangxi, Guizhou, and Yunnan are famous for their natural resources and folklore. The ecological environment is the material foundation and prerequisite for the survival and development of the tourism industry (Kim & Park, 2016). Improvement of the ecological environment can better guarantee the originality and quality of tourism products—a key factor in enhancing the attractiveness of tourism and influencing the structure of the regional tourism industry (Z. F. Wang et al., 2018). Hence, the ecological environment has a positive spillover effect on the tourism economy through tourism flow and industrial structure externalities.
Based on the geographic distance, spatial adjacency, and economic distance matrices, the indirect effects increase to 5.354%, 4.441%, and 2.439%, respectively, for each 1% increase in industrial structure upgrading, indicating that industrial structure optimization and upgrading had the most significant effect in promoting the positive spatial spillover of the tourism economy for geographically close provinces.
From 2010 to 2014, when the industrial structure increases by 1% based on the economic distance, spatial adjacency, and geographic distance weight matrices, the spatial spillover effects produced are −1.448%, −2.095%, and −1.557%, respectively. At this stage, there is a backflow effect in the development of the industrial structure and a misallocation of factors—low quality of labor, overexploitation of tourism resources, insufficient capital investment, and so on—within the tourism economic system caused by the resource-factor input effect in tourism (Wu & Song, 2018; Zha, 2015). In other words, although the scale of factor inputs, such as the industrial structure, increases, the overall level and quality of hospitality services and other supporting services or facilities in China’s tourism industry at this stage are still insufficient. Hence, it is difficult to promote positive economic spatial spillover from the industry. From 2015 to 2019, the industrial structure begins to contribute significantly to positive spatial spillover effects on the tourism economy. After 2015, with the improvement of China’s comprehensive strength, the industrial structure gradually transforms, optimizes, and develops toward industrial advancement, thus promoting spatial transmission mechanisms, such as spatial spillover effects, between neighboring provinces and regions through mutual imitation and promotion (Zhang et al., 2020). Therefore, at this stage, industrial structure optimization begins to produce significantly positive spatial spillover effects.
The spillover effect continues to increase from 2010 to 2015. After 2015, the spillover effect begins to decrease gradually to a weak level of influence. Before 2015, infrastructure factors generate positive externalities through tourism agglomeration to promote and enhance economic tourism (S. X. Wang et al., 2012). As China’s technological innovation and the ability to industrialize new technologies increase, tourism infrastructure facilities are relatively well developed in each province. Tourists’ travel is no longer restricted because of the incomplete development infrastructure facilities. Therefore, the impact of infrastructure facilities on economic spillover effects in China from interprovincial tourism gradually weakens with improving infrastructure facilities.
Based on the geographic distance, economic distance, and spatial adjacency weight matrices, when the level of informatization increases by 1%, the spatial spillover effect of the tourism economy increases by 0.282%, 0.119%, and 0.100%, respectively. According to the phased analysis, China’s internet facilities begin develop during the 2010 to 2014 period, with a low level of informatization; furthermore, the effect coefficient on the spillover of the tourism economy is close to 0, making it difficult to promote a positive spatial spillover of the tourism economy. From 2015 to 2019, the level of informatization significantly promotes the positive spatial spillover of the tourism economy. After 2015, with the increase in China’s internet penetration, the rapid development of the 5G network, and the growth of the digital economy, the informatization level generates a positive spatial spillover to the tourism economy for provinces through information and tourism flow spillovers.
Based on the economic distance, spatial adjacency, and geographic distance spatial weight matrices, the spatial spillover effects generated by tourism location are 0.187%, 0.253%, and 0.242%, respectively, for every 1% increase in tourism location. Location is interrelated in terms of geographically close provinces, and tourism clusters are more conducive to increasing tourism economic spillover effects. From 2010 to 2019, the location has positive spatial spillover effects on the interprovincial tourism economy and shows a gradually increasing trend.
Recommendations
Specific recommendations for applying the findings of this study include:
Improving the level of regional economic development, promoting the establishment of interregional tourism collaboration between provinces in close spatial proximity, and taking advantage of tourism clusters are excellent approaches. Improving the level of regional technological innovation and industrialization application capabilities, and ensuring the introduction, innovation, and application of appropriate technologies, such as the development of smart equipment upgrades, virtual tourism, digital tourism, and other technologies, are also effective approaches. The current construction of China’s Yangtze River Delta, Pearl River Delta, and Beijing–Tianjin–Hebei economic zones has encouraged multi-provincial flows and cooperation among people in terms of technology, capital, and infrastructure facility construction. Moreover, the flow of information has also been enhanced, thus promoting the effective spillover of cross-provincial knowledge, information, tourist flow, and improving the positive externalities of the tourism economy.
People’s living standards and disposable income increase when the industrial structure is advanced. Therefore, the demand for multi-destination tours is enhanced, thus promoting spatial spillover (Majewska, 2017). The dividends from the industrial structure on provincial tourism’s economic development have increased gradually in recent years. Provinces should continue to optimize and adjust the scale and proportion of the three industries according to provincial characteristics by focusing on supply-side reforms, joint resource allocation, government policymaking, and the introduction of reasonable foreign investment enterprises while simultaneously strengthening regional cooperation and breaking down resource factors. Mitigating barriers to the free flow of information is needed to achieve a balanced allocation of resources, coordinate development between industrial sectors, and optimize and upgrade industrial structures.
When the level of networked applications becomes widespread (Jayaraman & Makun, 2020), tourists will no longer consider market failure (Enilov & Wang, 2022) when choosing tourist destinations. It becomes easier to obtain information about the provinces surrounding tourist destinations, thus increasing the likelihood of visitors traveling to multiple destinations. Li et al. (2021) suggest that visitors’ multi-destination travel plans are significant drivers of spatial spillover effects in terms of visitor flow, thereby enabling informatization development to drive interprovincial tourism’s economic growth.
Limitations
Some limitations of this study should be noted.
(1) The Chinese regions of Tibet, Hong Kong, Macao, and Taiwan are excluded from this study because of limitations or statistical differences in data, and the spillover effects from the excluded regions in the spatial econometric model might have resulted in bias.
(2) Additionally, six factors influencing the spatial spillovers of tourism economics are examined in this study, but the actual situation is far more complex than the scope of this research. Future studies are expected to explore tourism spillovers, such as the choice of broader regions and more tourism-related variables.
Footnotes
Acknowledgements
The authors would like to thank the editors for doing the examination work and checking this paper.
Declaration of Conflicting Interests
The author(s) declared no potential conflicts of interest with respect to the research, authorship, and/or publication of this article.
Funding
The author(s) disclosed receipt of the following financial support for the research, authorship, and/or publication of this article: The National Social Science Fundation of China (21BGL153).
Ethics Statement
This study does not involve animal or human studies and it is no related to ethical issues.