
Abstract
Information disclosure, participatory governance, and collaborative innovation are open government data’s (OGD) main goals. Understanding the preconditions that enable the efficient and effective implementation of OGD initiatives is essential for achieving their overall objectives. Therefore, determining its influencing factors helps improve platform quality, prevent misunderstanding, and realize the purpose of OGD. Based on the literature, this study established a user-oriented conceptual model of OGD into which technology acceptance theory was integrated. This model constructed a data analysis model with the number of downloads of OGD platform data as the response variable and the explanatory variables comprising OGD quality score, linked data density, time to inception, and five others. Sixty-one cases of OGD platforms in Chinese prefecture-level cities were analyzed. The results indicated that the effectiveness of OGD was positively correlated with OGD quality score, time to inception, and the number of employees in the case cities. Network density and average disposable income of citizens had non-significant impacts on effectiveness. Strategies for improving the effectiveness of OGD platforms in China were discussed.
Keywords
Introduction
The public sector information (PSI) directive proposed by the European Union in 2000 is considered the prototype of open government data (OGD; Attard et al., 2015). At a meeting in Sebastopol, California 2007, advocates for open-source software-defined public data as a public good. This working group constructed the basic framework of open data and asserted that they should be open to all (Chignard, 2013). In 2009, the Obama administration passed legislation to promote this concept and launched data.gov in the same year. Numerous countries have implemented OGD since then. The Open Government Partnership, which has 75 member states, was established in 2011. As of 2019, 110 countries are implementing OGD (Xiao et al., 2019). In 2012, platforms in Shanghai, Beijing, and Zhanjiang opened up government data at China’s provincial and prefecture levels. As of April 2019, 13 provincial and 69 municipal governments have developed OGD platforms, which are overgrowing.
Although no global definition of OGD has been established (Meijer et al., 2012), scholars and governments agree that information disclosure, participatory governance, and collaborative innovation are the main goals of OGD (Lee & Kwak, 2012). According to Wirtz et al. (2018), OGD represents data transparency and accessibility and interaction between governments and data users designed to monitor and improve government performance (Nam, 2015). Cambridge Dictionary (2021) introduced effectiveness means the ability to be successful and produce the intended results. Data use, the prerequisite for data reuse, is a prerequisite for achieving the main goals of OGD. In other words, data use directly manifests the effectiveness of an OGD platform.
A note for the head of Executive Departments and Agencies stated, “…Openness will strengthen our democracy and promote efficiency and effectiveness in Government” (Huijboom & Van Den Broek, 2011). Ubaldi (2013) pointed out that understanding the preconditions that enable the efficient and effective implementation of OGD initiatives is essential for achieving their objectives. Peña-López (2020) quoted that OECD (2019) aimed to “…maximize the social and economic benefits to be derived from the wider and more effective use of digital data, while, at the same time, addressing related risks and challenges”. Sadiq and Indulska (2017) pointed out that “there is a critical need (…) for empirical testing to identify the contexts and factors that affect the effectiveness of open data use.” Therefore, understanding the effectiveness of OGD platform use and determining its key influencing factors contributes to the successful OGD implementation and the expected results.
However, the literature review in the present study, which included searches through the Web of Science (WOS) and China National Knowledge Infrastructure (CNKI) databases, indicated the following. (1) Although many studies have to pay attention to OGD users (Saxena & Janssen, 2017; Talukder et al., 2019) and citizen engagement (Purwanto et al., 2020, 2022). Few studies have explored the effectiveness of OGD from the perspective of its use by data users, such as citizens (Nam, 2015; Wirtz et al., 2019). Citizens are at the heart of open government, and their participation represents a fundamental principle of the latter. Wirtz et al. (2019) indicated that understanding citizen behavior in open government research sheds light on the critical aspects of citizens’ usage intention and provides implications for researchers and practitioners. (2) Studies have primarily investigated challenges caused by low user participation in OGD from a qualitative-to-quantitative perspective (Bertot et al., 2010; Khurshid et al., 2018, 2022; Wirtz et al., 2019; Zuiderwijk et al., 2016). (3) Micro-level evidence on the use of the OGD platform is lacking. Compared to the micro-level perspectives of the OGD platform use situation in government agencies, the macro-level study would focus on the view of cities. Zhao and Fan (2021) indicated that “…the level of OGD implementation in specific regions or cities at the macro level, like OGD systems and projects…” and they were concerned “…OGD implementation in a single government agency at the micro level.” Data collection and comparative analysis to enable more reliable statements concerning this field’s emergent quantitative and qualitative patterns to remain a task ahead. Therefore, the present study performed an empirical analysis of the factors affecting the use of the OGD platforms on this level.
In this study, we aim to answer the following questions: (1) What are the specific factors influencing the effectiveness of the OGD platform at the micro level? (2) How do the factors influence the effectiveness of the OGD platform? Furthermore, (3) what helpful suggestions can we provide to governments to improve the OGD platform? Therefore, this paper will do a comprehensive literature review of the field of OGD, dig latent variables that may influence the effectiveness of the OGD platform from the view of macro-level, and make a quantitative empirical analysis.
Literature Review
Bibliometric Analysis of the Literature
Because the concept of OGD was formally proposed in 2000 (Bertot et al., 2010), only relevant studies from after that point were searched among the 923 articles retrieved from the WOS database, 67 of which had abstracts containing “citizen” or “data user” and were published between 2013 and 2019. Of these 67 articles, 10, 10, and 14 were published in 2016, 2017, and 2018, respectively. Open government data and open data were the most frequently occurring keywords. The top two keywords from searches of the WOS and SCOPUS databases were “information” and “adoption,” respectively. To better grasp the dynamics and trends of research in this field, the keyword “co-occurrence” was used to analyze the distribution of topics in the literature sample. If an article contained two keywords, a connection was established between them. Figure 1 presents the co-occurrence network diagram (Zuiderwijk et al., 2012).

Keyword co-occurrence network of the literature sample.
As shown in Figure 1, the 67 articles contained 107 co-occurring keywords. The research topics were divided into nine clusters accordingly. The density and transitivity of the network were 0.1095 and 0.559, respectively, indicating that the research topics were relatively highly concentrated. The three keywords related to user behavior, adoption, acceptance, and participation, are marked with rectangles. Their intermediary centrality values were 1690.96, 133.93, and 54.77, respectively, and their node centrality values were 46, 17, and 16, respectively. Other keywords with high node centrality included information, model, challenge, service, and trust. They were disregarded in the present analysis because they were irrelevant and did not reflect specific research trends. The main perspectives of these micro-level studies on OGD user behavior, which are the theoretical basis for constructing the present model, are summarized in the following section.
Main Perspectives From the Literature Sample
The main perspectives of the sampled studies were the importance of and the influencing factors of OGD use.
Importance of OGD Use
According to Jetzek et al. (2014), user participation is one of the three main ways to achieve OGD goals. Harrison et al. (2012) indicated that understanding the underlying mechanism of value creation through OGD is critical to the successful implementation of OGD. They proposed five value engines, one of which is user participation, defined as the intensity and frequency of public participation in government policies. Wirtz et al. (2019) affirmed that citizens are the center of OGD and that citizen participation in OGD is its fundamental principle. Numerous scholars have explored obstacles to public participation in OGD and suggested solutions. In their analysis of open data platforms in 35 countries, Sayogo et al. (2014) identified the lack of interactive tools, the mismatch between data supply and public demand, and the imbalance between method and level of participation as the main problems affecting public participation in OGD. Evans and Campos (2013) argued that if the ultimate goal of OGD is to increase citizen participation in government affairs, the government must go beyond only providing data. They compared the expected purposes of the Obama administration’s OGD directive and the actual practices of the open data platforms of the US government and relevant departments. They proposed a framework for OGD research based on the nature and use environment of open information and expressed their hope that this cognition would promote citizen participation in government affairs. Similarly, Ganapati and Reddick (2012) and Luna-Reyes et al. (2012) believed that improving the effectiveness of OGD platforms for user participation is the most central goal of improving its implementation.
To sum up, till now, it is a critical issue to identify the contexts and factors that affect the effectiveness of open data use by empirical tests (Sadiq & Indulska, 2017; Zhao & Fan, 2021). Scholars still make efforts to explain the effect of OGD implementation from the perspectives of a government agency (Zhao & Fan, 2021), citizen engagement (Purwanto et al., 2020, 2022; Quarati, 2023; Talukder et al., 2019), and interaction mechanism (Zuiderwijk et al., 2016).
Factors Influencing OGD Use
Numerous quantitative studies on participation behavior in OGD have been conducted, focusing on personal technology acceptance behavior at the micro-level. Researchers have built models exploring critical contributing factors to the private use of OGD based on the technology acceptance model (TAM), the unified theory of acceptance and use of technology (UTAUT), and other relevant theories. According to Goldfinch et al. (2009), using information and communications technology (ICT) can cultivate citizen interest in participating in government affairs. In a UTAUT-based investigation, Zuiderwijk et al. (2015) found that performance expectations, effort expectations, social influence, and personal wishes significantly positively affected personal intention to use OGD. Wirtz et al. (2018) evaluated the intention to use OGD from the TAM and motivation theory perspectives. Perceived ease of use, perceived usefulness, internal motivation, and Internet technology capability significantly affected citizen intention to use OGD. Wirtz et al. (2019) combined the principles of information transparency, public participation, and collaborative innovation in OGD with the TAM to build a comprehensive research model of citizen intention to use OGD. They reported that ease of use; usefulness; and expectations of information transparency, participation, and collaborative innovation were the determinants of this intention.
Notably, use intention does not necessarily result in actual use behavior; therefore, the applicability of this finding to practice is worthy of further investigation. It is a common problem with this type of research. In addition, all these studies used survey samples that generally contained fewer than 1,000 individuals. Citizen use of OGD platforms must be evaluated at multiple levels (e.g., city, provincial, and national) (Zhao et al., 2022), which involves incredible complexity. Therefore, the reliability of such samples necessitates discussion.
According to Zhao and Fan (2021), macro-level OGD implementation reflects the extent to which the government has implemented the government data commitments. The micro-level demonstrates the implementation of individual government agencies or individual categories. In the present study, articles on factors influencing the effectiveness of OGD platforms at the micro-level still need to consider demand-side factors (Zhao & Fan, 2021). Using 37 US cities as a sample, Thorsby et al. (2017) constructed a regression equation to evaluate the overall situation of the OGD platforms from five aspects. They noted that the open data platforms in these cities were still in their infancy and that much work was required to improve the user experience. A social network analysis from the stakeholders’ perspective by R. Ma and Lam (2019) indicated that low user levels hindered improvements to the quality of OGD platforms. So they demonstrated from another aspect that the degree of platform operation difficulty and users’ matching impact citizen intention to use OGD.
Summary
This literature review indicated the lack of micro-level studies of factors affecting OGD platform use. Although studies have explored OGD use intention from the perspective of personal technology acceptance behavior, the samples used were not necessarily the actual users of the platforms; research bias may have been present. Since the OGD platform is an information system, Venkatesh and David’s (2000) TAM is the most widely applied model that explains how users accept and use technology. In the present study, micro-level analysis of OGD platform use in 61 Chinese prefecture-level cities, actual user data was incorporated into the model.
Research Design
Theoretical Basis of the Research Model
User-Oriented Conceptual Model of OGD
Although no consensus on the definition of OGD has been reached, its primary goals are generally considered information transparency, participatory governance, and collaborative innovation. The government can establish access to data through numerous methods, each of which leads to different forms of use. Sieber and Johnson (2015) classified four models of open data provision, namely data over the wall, code exchange, civic issue tracker, and participatory open data, according to its inputs to users. They asserted that most OGD platforms belong to the data over-the-wall mode, under which the government, as the data owner, builds a platform from which to disclose data to users. Users can usually obtain data unconditionally, but the forms of data user interaction remain extremely limited. The socioeconomic value of OGD under this model lies in the transparency of government information, enhanced public trust in the government, and promotion of economic development through data reuse. According to Wirtz et al. (2018, 2019) and Zuiderwijk et al. (2015), data quality, technical ease of use, and data usefulness significantly impact the intention to use OGD. Ding et al. (2011) discussed the creation of a linked OGD portal and its connection to promoting sustainable OGD development. The process comprised three stages: opening, linking, and reusing the data.
Considering platform technology, data quality, user participation, OGD goals, and the status quo of OGD development, the present study proposes a user-oriented conceptual model of OGD (Figure 2). Under this user-oriented concept, project implementation to goal realization involves numerous stakeholders and multiple operational subsystems. The core objectives of this user-oriented concept are to maximize data value through data reuse and generate new data according to data use activities to enrich the platform dataset, forming a virtuous circle centered on socioeconomic activities with value-added data inseparable from user participation. Users and their behaviors are the core and basis of the entire system. Quarati (2023) pointed out that many downloads can be found on the dataset access page and returned by portal API, supplying an indicator of use for the activities of direct users, that is, those users who consult a dataset directly. Thus, the present study used the number of downloads of OGD platform data as a proxy variable for effectiveness because it is its direct indicator.
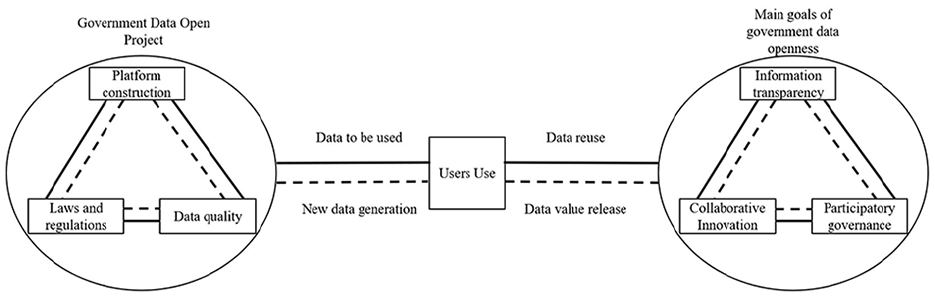
User-oriented conceptual model of OGD.
TAM
According to the OGD framework model (Figure 2), OGD can be understood as the electronic collection, transmission, processing, and distribution of information about the government and its activities. Therefore, OGD use is contingent on technical ability. The TAM proposed by Davis (1985) has been extensively applied in relevant research, and practice has proven it to be highly useful and reliable. According to Davis (1985), perceived ease of use and usefulness comprise the two decisive factors affecting technology acceptance. Perceived ease of use refers to a user’s perception of the technology’s required effort.
In contrast, perceived usefulness refers to the degree to which they believe using informational technology systems can improve their performance since OGD is an innovative public service provided through ICT. Technology is the foundation for realizing OGD and a driving force for its development. The present study believes that the factors influencing the effectiveness of OGD still came from users’ perception of ease of use and usefulness based on TAM.
However, this study did not directly adopt the concepts of ease of use and practicality. Instead, it assumes the variables conducive to the user’s ease of use and usefulness of the user when using the OGD platform. To make it more sense, this study adopted an expert brainstorming method (Cheng & Shi, 2019) to enrich expert validity. A snowball sampling method was used (Dai et al., 2020). On May 26, 2019, four male and two female experts were engaged in this discussion at the Weihai campus of Shandong Jiaotong University, China. Three experts are scholars with more than three years of experience, and three are government officers with more than five years of experience in OGD. After 1.5 hr with more than five rounds of discussion, finally, the forum quality, the network density of the platform, and the use years of the forum are seen as ease of use. The city’s innovative power, the strength of the local government’s smart city construction policy, and the strength of the city informatization index are valid. The disposable income of citizens in the city and the number of employees are seen as external variables.
Model Construction
According to the user-oriented conceptual model of OGD, data downloads indicate the use of and participation in OGD. Therefore, the number of data downloads from each OGD platform was selected to proxy its effectiveness. The annual average downloads, recorded as downloads, were used as the response variable to exclude the influence of the duration since the platform launch (in years) on the number of data downloads. According to the TAM, the perceived usefulness of technology directly affects its use. The evaluation indicators for OGD platforms published in the “Report on China’s Local Government Data Opening (First Half of 2019)” issued by the Digital and Mobile Governance Laboratory of Fudan University, which are all related to perceived usefulness, included open authorization, technological openness, data format, the availability of machine-readable datasets, total number of datasets, and the quality and capacity of data. The report espoused the view that higher quality in OGD platforms can improve its perceived usefulness and, thereby, its effectiveness. The total scores of each forum published in this report (recorded as total.score) were selected as the proxy variable for platform quality. The following hypothesis was formulated:
H1: The platform usage effect (downloads) positively correlates with the platform quality (total.score).
According to the TAM, perceived ease of use affects user behavior. Ding et al. (2012) and Janssen et al. (2018) identified data association as the main factor affecting user convenience on OGD platforms. Data association can significantly reduce duplicate users and effectively reduce data search time. Therefore, higher data relevance can improve the perceived ease of use and platform effectiveness. To prevent overlap with the indicator system mentioned in the “Report on China’s Local Government Data Opening (First Half of 2019),” network density (recorded as the network.density), which was based on the linked data of OGD platforms, was selected as a proxy variable for data relevance. The specific values were calculated by multiplying the network density by 100. If a value was still close to 0 after this process, the platform was considered to have no associated data, and the value was recorded as 0. A hypothesis is proposed as follows:
H2: The platform usage effect (downloads) is positively correlated with the network density of the platform (network.density).
According to Thorsby et al. (2017), cities with high innovation, whose citizens are highly willing to try and experience new things, provide a superior external environment for OGD development. Griliches (1991) used the number of patent applications to indicate urban innovation power, and Feldman and Florida (1994) confirmed that the two were highly correlated. In the present study, each sample city’s average annual number of patent applications from 2011 to 2017 was used as the proxy variable for that city’s innovation power (J. Ma et al., 2017) and recorded as pateng. The following hypothesis is presented:
H3: The platform usage effect (downloads) positively correlates with the city’s innovative power (pateng).
According to the diffusion of innovation theory, the degree of new technology diffusion positively correlates with time (Rogers, 2010). The degree of technology diffusion directly affects user behavior. Thus far, the discussion indicates that OGD is essentially a new type of governance concept based on ICT technology, which is innovative. Therefore, the duration since the platform launch (recorded as t) impacts its usefulness. The following hypothesis is proposed:
H4: The platform usage effect (downloads) is positively correlated with the use years of the platform (t).
OGD is an innovation of the government’s public service supply chains. The essence of a smart city, in which the primary work objective is data, is the innovation process from data to knowledge (Chu, 2019). Therefore, OGD is essential to constructing a smart city, which is, in turn, positively affected by the intensity of government promotion (Chu, 2018). This intensity was recorded as policy-ten. The following hypothesis was established:
H5: The platform usage effect (downloads) is positively correlated with the strength of the local government’s smart city construction policy (policy).
Venkatesh et al. (2003) and Zuiderwijk et al. (2015) show that technology accessibility positively correlates with OGD use intention. It mainly depends on the technology’s popularity and the cost of its use. Firm user intention, for which Gurstein (2011) indicated positive correlations with background characteristics such as income, education level, and computer ability, can promote platform use. In the present study, the proxy variables for technology accessibility comprised the informatization index of the city the year before the launch of the OGD platform and the per capita disposable income between 2011 and 2017, which were recorded as net-index and pin, respectively. The following hypotheses were posited:
H6: The platform usage effect (downloads) is positively correlated with the strength of the city informatization index (net-index).
H7: The platform usage effect (downloads) is positively correlated with the disposable income of citizens in the city (pin).
The three main objectives and business content of OGD apply primarily to on-the-job employees. Therefore, platform effectiveness is affected by the number of on-the-job employees in the city, and this variable was recorded as no.of.employees. The following hypothesis was formulated:
H8: The platform usage effect (downloads) is positively correlated with the number of employees in the city (no.of.employees).
In sum, the conceptual Model 1 was established based on these variables and the following equation:

Research Methods
Data Source and Collection
The primary data sources in the present study were city statistical yearbooks, third-party research reports, listed government websites, and the 61 OGD platforms. Additional information was obtained throw web crawling on Baidu, a leading Chinese-language search engine. The sample representative includes all matured OGD platforms in China. From July 1 to 31, 2019, python was used to obtain the number of downloads and the correlation density. The data on the number of patents and per capita disposable income between 2011 and 2017 were collected from the yearbooks. The overall evaluation scores and the launch years of the 61 platforms were sourced from the “Report on China’s Local Government Data Opening (First Half of 2019).” The informatization indices were derived from the “Report on China’s Informatization Society Development.” Data on smart city promotion were crawled from government websites and Baidu. Each report was given one point. The data were then standardized.
Statistical Description of Sample Data
The 61 platforms were unevenly distributed across the 13 provinces in which the cities were located. All cities above the prefecture level in Guangdong and Shandong had established OGD platforms, totaling 37. The number of datasets and the total number of downloads were also unevenly distributed with no apparent linear relationship. Notably, the average number of downloads was 206,058, but the minimum number was only 688. The relationship between the number of platform datasets, the intensity of smart city promotion, and the number of downloads (Figure 3) contrasted with the diffusion of innovation theory, which holds that publicity and promotion positively affect use.

Ternary plot showing the relationship between the number of platform datasets, government promotion, and the number of downloads.
Because Figure 3 is a ternary plot, the shorter the distance to the middle of the triangle, the more balanced the proportion of the ternary phase is. The faster the distance to a specific vertex, the heavier the ratio of the factor. In other words, the distribution is bimodal. The number of downloads in some sample cities was irrelevant to the number of datasets, which may be related to data quality or value. According to the platform scores, the 61 platforms had an average score of 30.25 and a skewness of 1.04. The accuracy of the data was confirmed in the present study. The k-nearest neighbor method redivided all the platform data into 13 categories. Figure 4 illustrates the density peaks of downloads by search category.

Density peaks of downloads by search category.
From bottom to top, the themes shown on the vertical axis of Figure 4 are environmental resources, culture and leisure, urban construction, credit services, public safety, education and technology, economic structure, road transportation, social development, organization, health, and livelihood services. The peaks indicate that the demand for economic construction downloads was relatively high and that the number of downloads concerning livelihood services, education technology, and health was relatively even. In other words, demand for data was mainly concentrated in areas related to livelihood and public services.
Model Fit Analysis
Model 1 was used to fit the original data obtained in Subsection 4.2. The car package in R was then used to analyze the fit visually. As shown in Figure 5a, the model was heteroscedastic. Accordingly, the number of downloads, patents, employees and the per capita disposable income must be logarithmically converted. Figure 5b shows the model fit after the conversion. The heteroscedasticity was reduced. Table 1 presents details of the fit of each variable.

Model 1 variables and overall fit: (a) fitting before logarithmic transformation and (b) fitting after logarithmic transformation.
Fit of Regression Model 1.

and *** respectively indicate significance at the .05 and .001 levels.
As shown in Table 1, the number of downloads was correlated only with the platforms’ total score and the duration since their launch. The total score was an indicator of platform quality. The better the quality, the more attractive it was to users, and the higher the use intention and platform effectiveness was. Although the heteroscedasticity of the model was reduced after logarithmic conversion, not many of the variables were significant; only H1 and H4 were supported. Therefore, a stepwise regression of model 1 was performed (Table 2).
Stepwise Regression and Fit Parameters of Model 1.
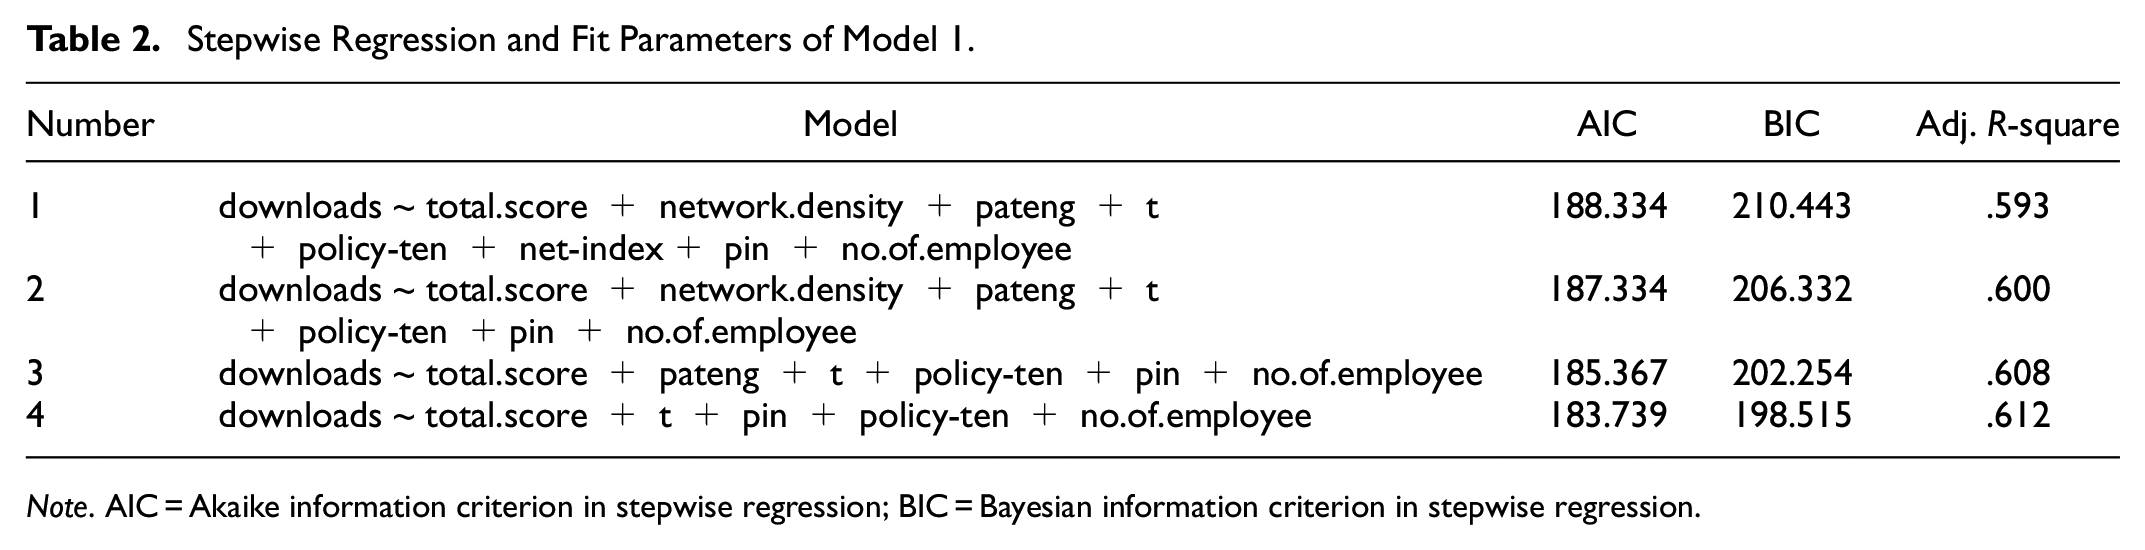
Note. AIC = Akaike information criterion in stepwise regression; BIC = Bayesian information criterion in stepwise regression.
Table 2 shows that model 4 had the best fit, and Table 3 presents the details.
The Fit of Model 4.
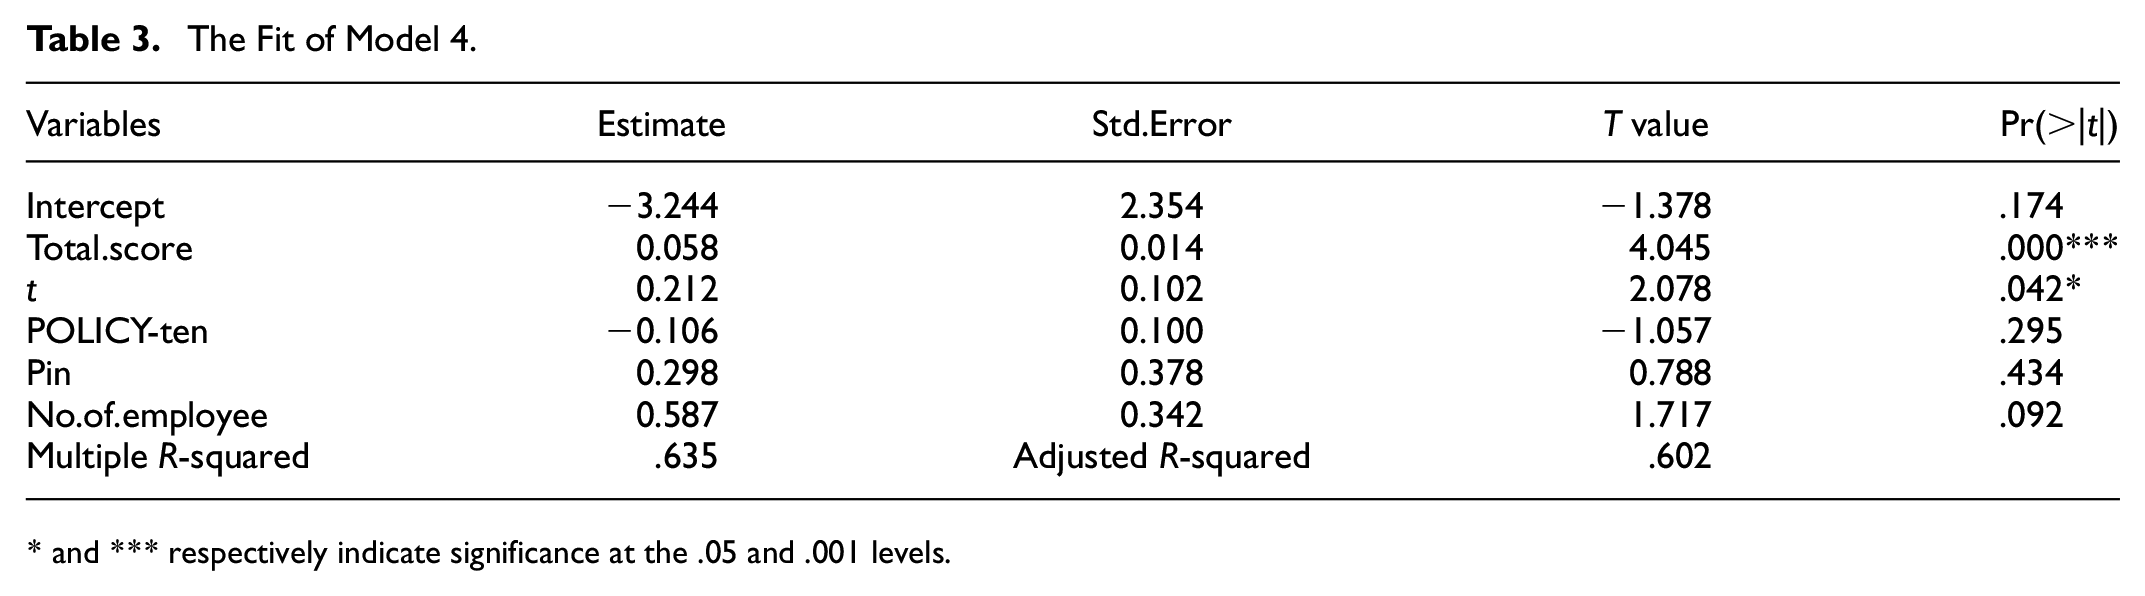
and *** respectively indicate significance at the .05 and .001 levels.
Figure 6 illustrates the fit of model 4 and the residuals of each variable.

Model 4 residual error fitting.
The Breusch–Godfrey test was used to check the auto-correlations in model 4. The p-value of .911 indicated no col-linearity was present; in other words, the overall fit was excellent.
Discussion
This study tries to understand the influencing factors of OGD effectiveness from the users’ perspective (Evans & Campos, 2013; Ganapati & Reddick, 2012; Luna-Reyes et al., 2012). Not the same as previous studies paid attention to users’ use intention of OGD, and we focus on more actual behavior, users’ download numbers of OGD. Like Thorsby et al.’s (2017) method, the results supported H1, H4, and H8. OGD use was positively correlated with the quality and age of the platform and the number of employees.
Notably, in both models 1 and 4, the intensity of smart city policy was negatively correlated with downloads, not consistent with Chu (2019). This result suggests the existence of “two skins” in smart city construction and government data opening in China. Because an OGD platform can be classified as a combination of an Internet and government service, the business belongs to the government department or office and big data bureaus. By contrast, a smart city mainly concerns the industry and information or urban construction departments (Wang, 2019).
The influence of the city information index and per capita income on the downloads of the OGD platform were both non-significant, not the same as studies by Venkatesh et al. (2003), Zuiderwijk et al. (2015), and Gurstein (2011). The results indicate that the development of these two aspects has matured in China. This can be attributed to the Chinese government’s promotion of a well-off society and all-out poverty alleviation. Finally, compared to Thorsby et al. (2017), the innovation between-city differences were also non-significant. This may be because almost all cities develop similarly in China. The main findings were as follows.
Improving Platform Quality Can Increase Use
As mentioned, platform quality in the present study was evaluated using the platform scores published in the “Report on China’s Local Government Data Opening (First Half 2019).” The 50 evaluation indicators corresponded to utilization, data, platform, and preparation layers. The comprehensiveness was relatively strong (Xia & Xing, 2019). According to the TAM, perceived usefulness underlies user acceptance of new technologies, and more substantial perceived value can increase the use and thereby release the value of the data. Data is exponentially related to its value and the number of times it is used as a reusable asset. Therefore, the quality of the platform determines the effect of the platform to some extent. The average quality score of 30.25 among the 61 platforms was low, indicating that room for improvement remains in platform quality concerning the number of datasets, data indexing, data classification, data association, application programming interface (API) opening, and data opening conditions.
Platform Promotion and Diffusion Can Increase Use
In line with the diffusion of innovation theory, the age of the platform and its linked variables, particularly, the spread of good user experience, positively impacted effectiveness. Smart city promotion was negatively correlated with effectiveness. Although this effect was non-significant, the link indicates that, to a certain extent, smart city promotion was inconsistent with the actual situation or that data opening was not considered in smart city construction. According to the diffusion of innovation theory, the government should promote OGD platforms through appropriate channels after their development to improve their effectiveness.
Diversified Data Types Can Improve Platform Use
The number of employees had the most significant impact on the platform use of all the variables. In the present study, on-the-job employees are referred to as working individuals paying social pension insurance. Compared with the average citizen, these individuals are more likely to download certain data types for work and convenience. Specifically, in line with the peaks of download density in Figure 4, more downloads were linked to corporate or personal public service businesses. The platform data indicated that OGD is primarily published in four formats: CSV, JSON, XLS, and XML. Furthermore, real-time data and desensitized social and commercial data are lacking. Therefore, governments should enrich data sources, improve interaction functions, and develop intelligent recommendations.
Platform Developers Should Design Functions for Individuals With Special Needs in the Interest of Social Equality
Network density and per capita disposable income were not significantly correlated with OGD use. According to the 44th “China Internet Statistics Development Report,” as of June 2019, Chinese Internet users numbered 854 million, of which mobile phone users constituted 847 million. The proportion of Chinese Internet users accessing the Internet from their mobile phones is approximately 99.1%. With the development of infrastructure, speed increases, and fee reductions, the Internet has become a vital element in the productivity and lives of people in China. Under this consideration, local governments should consider the needs of people with disabilities in developing OGD platforms. Notably, most 82 established OGD platforms had functions for particular groups.
Conclusion
Based on the literature review, this paper posited that user behavior would be a prerequisite for achieving OGD goals and that the number of downloads would directly indicate OGD use. Therefore, the number of downloads would now reflect platform effectiveness. A user-oriented conceptual model of OGD has been constructed accordingly; with this model as a foundation, a model was built to analyze data concerning the 61 OGD platforms developed in Chinese cities above the prefectural level. Models 1 and 4 explained 58.2% and 60.2% of the variance. Statistical analysis indicated that model 4 had satisfactory reliability. Notably, the quality and age of the platforms and the number of employees were positively correlated with platform use. However, the quality and effectiveness of the media remain generally weak, and substantial progress must be made before participatory governance, and collaborative innovation are attained.
According to the State Council of the People’s Republic of China, 446 documents in full-text documents issued since 2008 by the central government and the State Council contain OGD. In adherence to national requirements, increasing government departments above the prefecture level will gradually build OGD platforms. To achieve the purpose of OGD platforms and improve their effectiveness, as well as avoid openness for openness, these departments should do the following: (1) control the overall quality of the platform, increase the total number of datasets, improve data quality, strengthen data associations, standardize data classification, reduce usage thresholds, and enrich data types and sources; (2) improve platform interactivity and data visualization functions, enhance user experience, establish a credible reputation, and continuously improve user stickiness; (3) build OGD platforms that meet local needs according to the population structure; and (4) promote the construction of open data ecosystems, multiple open API interfaces, and multichannel proliferation of OGD platforms to increase its use.
In the real world, the “China Local Government Data Opening Report” and “China Open Data Index” are the first professional index and reports focusing on assessing the level of government data opening in China. Fudan University and the Digital China Research Institute of the National Information Center have distributed them every half year since 2017. Till October 2021, 193 prefecture-level and provincial-level cities have provided online data open platforms (Lab for Digital & Mobile Governance of Fudan University (Fudan DMG) 2021). Open data makes a forest. “Open Data Forests” means the ecological system of open utilization of government data in China. For example, in the “Regulations of Guizhou Province on Government Data Sharing,” Guizhou Province stipulated that the government data-providing department should promptly respond to the data opening application and supplement, check, and promptly correct incomplete or erroneous government data. Shandong Provincial Government promotes the opening of public data of provincial and directly affiliated departments to the society and encourages the development and application of public data. According to Fudan DMG (2021), data opening is a marathon, not a speed skating race. It requires a place that can provide high-quality data to society continuously and stably and promote the development and utilization of open data unremittingly.
Some limitations have to be notable. First, we use original data from governments, third parties, and reports. However, the reliance on these data should be a concern. Second, TAM is not the only theoretical model; further studies could check the results based on other theories. Finally, the present study only faces the OGD in China, and researchers still have to do more studies through between-country data.
Footnotes
Declaration of Conflicting Interests
The author(s) declared no potential conflicts of interest with respect to the research, authorship, and/or publication of this article.
Funding
The author(s) disclosed receipt of the following financial support for the research, authorship, and/or publication of this article: This study was supported by The National Social Science Fund of China (Grant No. 20BGL219).