
Abstract
Despite widespread skepticism linked to cryptocurrencies, they are constantly gaining the interest of scholars, investors, media, and regulators. Recognizing the importance that portfolio risk maintains for crypto participants, this study attempts to shed light on this issue. We investigate the risk-return tradeoffs of the most tradable cryptocurrencies based on portfolio diversification techniques. Three different crypto portfolios containing a diverse number of cryptocurrencies were created to analyze the diversification risk from a historical perspective. Data concerning daily prices and their trade volume was collected from the Coin Market Cap database and covered the period from 1 January 2016 to 31 December 2022. The results regarding the risk-reward tradeoff stand in line with the portfolio theory, where higher expected returns offset higher risk. On average, the portfolio composed of 10 cryptocurrencies offers better optimization than the one with five, as it generates the same returns with lower risk. The year 2018 reflects the maximum diversification benefits in the three portfolios, corresponding to the period when cryptocurrencies gained massive popularity. From the managerial perspective, results inform crypto and institutional investors of the possible diversification benefits of the 15 most traded cryptocurrencies.
Keywords
Introduction
Cryptocurrencies have maintained their dual functions since their inception, operating as a unit of account and speculative financial instruments. The complexity of this technology has challenged state authorities to establish a legal framework. The lack of legal protection has created an unsafe environment for institutional investors. This technology is designed to serve as a payment mechanism outside the control of any state entity. In 2008, Bitcoin (BTC) was introduced as an open-source mechanism, becoming the first digital currency using a decentralized peer-to-peer network system (Nakamoto, 2008). BTC emerged during the financial crisis of 2008 when trust in the banking system was at its lowest levels. In addition to the benefits of cryptocurrencies, concerns are linked to environmental issues and illegal activities. Foley et al. (2019) documented that 46% of BTC transactions ($76 billion) involve criminal activities. Despite this, BTC survived academic controversies, security issues, and government bans. It managed to keep the permanent focus of the media, social networks, and the vigilance of the regulatory authorities. Introducing new initial coin offerings (new ICOs) has gradually diminished BTC’s dominance and boosted the attention to Altcoins. As this article was written (January 2023), more than 4,000 cryptocurrencies were operating, with BTC still occupying the leading position. Scholars and practitioners are constantly monitoring the capacities of BTC to serve as a hedging instrument and diversification unit. The work by Brière et al. (2015) considers that involving a small portion of BTC improves the optimization of the asset portfolios. At the same time, BTC operates independently and is unaffected by the price changes of the other conventional financial assets. This allows portfolio managers to mitigate interdependence and correlation among financial assets and cryptocurrencies. The cryptos prices are derived by the identical mechanism as other financial assets, where demand and supply equilibrate market prices.
In contrast, stock prices are mainly influenced by the internal performance of the corporations and the macroeconomic settings (Aliu et al., 2022; Batten et al., 2022; Campbell & Shiller, 1988; Fama & French, 1993). Therefore, crypto investors are driven by a single motive: the desire for quick wealth, which corresponds with gambling activities. Shiller (2020) analyzed stories that go viral, and the narrative built around BTC caused the price explosion. Moreover, he considers that the boost and bust can only be explained through infectious diseases like Ebola. The lack of intrinsic value makes it impossible for cryptocurrencies to integrate all the possible information. The demographic structure of the participants and financial literacy might explain this. Scholars have examined their efficiency levels, recognizing that they are isolated from external phenomena. Palamalai et al. (2021) suggest that most cryptocurrencies exhibit weak-form efficiency in validating daily returns, as price movements do not adhere a random walk. The Efficient Market Hypothesis suggests that security prices tend toward fundamental value, and deviations from the equilibrium are subject to market corrections. Stock prices are a forward-looking indicator (cash and dividend projections), while cryptocurrency value is derived entirely from speculative trading. Many scholars consider that cryptocurrencies hold no intrinsic value and are exposed to bubble formations (Bouri et al., 2017; Fry, 2018; Fry & Cheah, 2016; Rowland et al., 2021; Yousaf et al., 2023). At the same time, Geuder et al. (2019) studied the bubble behavior in Bitcoin during the period 2016 to 2018 through two distinct testing methodologies, PSY and LPPL approach. Their results confirm the existence of frequent bubble periods in Bitcoin prices. On the other hand, Kinateder and Papavassiliou (2021) used a GARCH model to investigate the influence of calendar effects on BTC returns and volatility for 2013 to 2019. Their findings indicate that Bitcoin’s volatility is more intense at the beginning of the week while significantly declining during the weekend. Known for the dominance of BTC and ETH over the years, where altcoin prices gravitate toward them, the study contributes to the current literature two-fold. First, it analyzes the dynamic diversification risk of cryptocurrencies where BTC and ETH hold the leading position. At the same time, it shows if the exposure diminishes when other cryptos besides ETH and BTC are involved. Second, it predicts the performance of BTC and ETH in the next 7 months, recognizing the tremendous shock this industry has experienced since the war in Ukraine. However, the findings are limited to the crypto industry, where other financial securities are not analyzed. Similarly, the models used do not consider the risks related to the various scams and scandals involving crypto exchanges and ICOs. This is because portfolio diversification techniques are intended for securities that state regulators carefully monitor. Moreover, these techniques are designed for securities that maintain intrinsic value. Contrarily, cryptocurrencies’ only perceived value is the participants’ trust and the likelihood of quick profits. This could be an additional risk metric that standard diversification techniques must deal with.
Standard portfolio theories indicate that the number of financial assets influences the diversification risk. Although there still needs to be a consensus among scholars and portfolio managers on the number of securities that fully diminish portfolio risk. The correlation between asset classes and the volatility level are additional factors affecting portfolio risk. Correlation indicates short-run dependency among portfolio assets, while co-integration indicates long-term association. A high level of uncertainty measured through the standard deviations of returns raises portfolio risk and vice versa. Markowitz (1952) set the foundations of the modern portfolio theory (MPT), where portfolio optimization is built in the relationship between risk and returns. In this context, cryptocurrencies hold features of financial securities as diversification risk declines when the number of cryptocurrencies increases within the portfolio (Aliu et al., 2020b; Bouri et al., 2020; Elu & Williams, 2022; Khaki et al., 2022). However, a small part of the participants in this industry has ambitions to keep cryptocurrencies as a long-term investment. In this context, Corbet et al. (2018) identified that cryptocurrencies provide diversification benefits for investors with short-run objectives. Another study by El Khoury et al. (2023) explores the relationship between Fourth Industrial Revolution assets and global commodities, emphasizing the need for portfolio diversification during crisis periods. Their findings suggest that these assets are more advantageous when held in the long run. However, they indicate that conventional measures of connectedness may not capture extreme positive or negative shocks adequately. Complementing this, Yousaf and Yarovaya (2022) studied herding behavior within different classes of cryptocurrencies, identifying time-varying herding in conventional cryptocurrencies and Decentralized Finance (DeFi) assets. They notably found herding behavior in DeFi assets during periods of low volatility, underscoring potential market instability and highlight the importance of policies to mitigate the effects of short-term herding.
The integration of world economies and financial globalization has reduced the benefits of international diversification. Bitcoin offers diversification benefits as it is not correlated with other financial assets and is immune to economic downturns, which can provide diversification benefits in a portfolio (Bakry et al., 2021; Baur et al., 2018; Kinateder & Papavassiliou, 2021; Mensi et al., 2021; Qarni & Gulzar, 2021). According to Kim (2022), the cryptocurrency market offers a distinctive prospect for asset allocation due to its differences from traditional assets. Despite the higher returns, the extreme volatility imposes a fast acceleration of portfolio risk. On the other hand, Liu (2019) analyzed the investment potential and benefits of diversifying across 10 largest cryptocurrencies. The study found that diversifying a portfolio across multiple cryptocurrencies can improve investment returns. Akhtaruzzaman et al. (2020) used a VARMA DCC-GARCH model to examine the potential diversification with Bitcoin and bond indices. They identified low dynamic conditional correlations between Bitcoin and bond indices, which generates space for portfolio risk optimization. At the same time, Aliu et al. (2021) compared the diversification risk of the major European equity indexes with the crypto portfolios. The results show that crypto portfolios were 76 riskier than the FTSE100 index, 55 riskier than FTSEMIB, 44 times riskier than IBEX 35, and 10 times riskier than CAC40. The study by Ciaian et al. (2018) investigated short and long-term interdependency between Bitcoin and 16 Altcoins, using daily data from 2013 to 2016. Results indicate that BTC and 16 other Altcoins signify a strong short-term price relationship while no long-run association is detected. The work by Dyhrberg (2016a) considers that BTC possesses attributes of gold and the US dollar, which might be seriously treated as a hedging instrument. Similarly, Choudhury et al. (2022) consider that BTC reflects several characteristics of gold due to supply scarcity and hedging abilities. Dyhrberg (2016b), in another study, concludes that BTC can be used as hedging security for stocks listed on the FTSE100 index. In contrast, Bouri et al. (2017), relying on the dynamic conditional correlation, examined the hedging capacities of BTC with stocks, bonds, gold, and oil. Their findings highlight that BTC needs to be a more robust hedging instrument of financial securities and commodities. Malek et al. (2023) applied the alpha-stable distribution and ARMA-GARCH approach to calculate dynamic risk exposure for the top five traded cryptocurrencies. They leverage the MLE method to estimate parameters, concluding that dynamic methods surpass static ones. However, they note that the risk patterns of cryptocurrencies vary significantly across different periods, specifically pre-, during, and post-COVID pandemic. A study by Field and Inci (2023) investigated the role of cryptocurrencies in shaping the risk-return profiles of publicly traded firms. They used a cross-sectional analysis, examining returns, volatility, betas, and Sharpe Ratios, finding substantial variation across firms in returns and risks associated with cryptocurrency strategies. This study highlights the critical need for comprehensive risk disclosures about cryptocurrency holdings in companies’ financial statements. Currently, cryptocurrencies remain highly speculative instruments with opportunities for enormous gains and losses. This fact has attracted participants of all ages, continents, and social groups who consider cryptocurrencies a chance to accumulate quick wealth.
Due to the outbreak of the COVID-19 pandemic, the world economies were heading toward a recession while the BTC prices were rising rapidly. On March 2021, the BTC unit price surpassed $60k with a capitalization of over $900 billion, exceeding all analysts’ estimates. On the other hand, in less than a month (from January to February 2018), Bitcoin lost 60% of its market value. Since the outbreak of the conflict in Ukraine, BTC was constantly in decline, where on 13 January 2023, the price was only $18,904. Despite this, practitioners, scholars, and regulators continue carefully analyzing crypto behaviors. Several authors have confirmed the diversification benefits they provide for traditional financial securities. Nevertheless, participants in this market tend to hold portfolios that consist only of cryptocurrencies. The lack of clear regulations and protection for investors has led many institutional investors to remain cautious about entering the cryptocurrency market (Almeida & Gonçalves, 2023; Giudici et al., 2020; Gonzálvez-Gallego & Pérez-Cárceles, 2021; Raza et al., 2023). Meanwhile, cryptocurrencies have demonstrated potential as a diversification tool. The crypto market is largely unregulated, which can make it vulnerable to fraud, manipulation, and hacking. They are subject to enormous price swings and may not provide the same liquidity level as traditional financial assets (Białkowski, 2020; Díaz et al., 2023; Huang et al., 2022). This study focuses on two main objectives. The first deals with the risk-return diversification benefits generated by portfolios with the five, ten, and fifteen most tradable cryptocurrencies. The work uses diversification techniques to analyze the portfolio risk returns annually from 2016 to the end of 2022. Moreover, the risk is measured based on the ranking structure that cryptocurrencies have each year. So, the structure and weight of cryptocurrency change every year, but the measurement techniques remain unchanged. To this end, crypto investors might investigate the risk dynamics by shifting their positions among various portfolios. Second, the Facebook prophet package was performed to estimate the performance of Bitcoin and Ethereum for 210 trading days. Although, the future is uncertain as it depends on the decisions made by people, government, natural events, wars, etc. As this paper is being written, cryptocurrencies are at a critical moment. The shift in focus to the Russia-Ukraine war has caused cryptocurrencies to lose media attention. Moreover, they are in murky territory concerning prices, social benefits, and regulatory issues. The authors have predicted only BTC and ETH closed prices as they remain dominant leaders in the crypto industry. Forecasts are made for only the next 7 months, as these may be the moments of price recovery or their disappearance. Results may generate valuable implications for regulatory authorities, policymakers, and crypto investors. Since the participants in this industry are young and maintain a high level of financial literacy, it increases the need for diversification. Furthermore, the ongoing scandals and frauds related to crypto exchanges and ICOs make diversification one of the solutions. However, our findings are limited to the diversification opportunities offered by the 15 most traded cryptos. Other scholars can conduct trials with different numbers of cryptocurrencies to better investigate the risk dynamics. But above all, this would provide a comprehensive overview of whether other combinations generate better performance than those with five, ten, and fifteen cryptocurrencies. In light of the identified problem, the following questions were asked:
RQ1: What is the risk-return tradeoff of the 15 most traded cryptocurrencies from 2016 to 2022?
RQ2: What will BTC and ETH s performance be in the next 7 months?
The rest of the paper is organized as follows. Section 2 contains the methods used and data collection. The diversification risk findings and forecasts with Facebook prophet are in Section 3. Finally, the concluding remarks, limitations, and future research can be found in Section 4.
Methodology
The methodology is organized into two sections, where Section 2.1 describes the data collection, while Section 2.2 explains the methods used.
Data
This study aims to identify the risk and returns generated by three different cryptocurrency portfolios. Three portfolios contain diverse cryptocurrencies based on the trade volume from 2016 to 2021. Figure 1 shows a schematical diagram of how crypto portfolios were organized, the methods used, and the data collection. Portfolio A1 comprises five cryptocurrencies with the most significant trade volume from 2016 to 2021, named Crypto 5. The portfolio’s structure changes as the trade volume remains unchanged over the years. In this context, Portfolio A1 consists of the five most traded cryptocurrencies in the respective year. Portfolio A2 consists of the 10 cryptocurrencies with the highest trade volume, identified as Crypto 10. The same logic follows the construction of Portfolio A3, which is presented as Crypto 3. The structure of cryptocurrencies is not identical over the years, as their weight, measured by the trade volume, varies. Standard diversification techniques were used to identify the risk-reward tradeoff of the separate cryptocurrency portfolios.

Schematic diagram of the three different cryptocurrency portfolios.
Table 1 shows the descriptive statistics of daily returns of the 10 well-capitalized cryptocurrencies from 2016 to 2022. The daily average returns are positive for all the cryptocurrencies ranging from 0.217% (BCH) to 0.573% (ADA). The BTC maintains the highest median (0.185%) compared to all other cryptos. The positive average returns indicate that the cryptocurrencies, on average, gained value over the period analyzed. The median provides a better measure of the central tendency for skewed data as it is not affected by outliers. Skewness indicates the asymmetry of the data distribution, with all cryptocurrencies having a positive skewness except for BTC which showed a negative one. The negative skewness for BTC could indicate that the returns were distributed more toward the lower end. The kurtosis of all cryptocurrencies marked a higher value, forming a heavy-tailed distribution, which indicates that the log returns of all the cryptocurrencies are more centered around the mean than the normal distribution. The Jerque-Bera and corresponding p-values confirm that cryptocurrencies’ daily closing returns data do not show a normal distribution at a 1% significance level. It is essential to consider the descriptive statistics in combination with volatility and overall trends when evaluating their performance.
Descriptive Statistics of Daily Closing Returns of the 10 Most Well-Capitalized Cryptocurrencies.
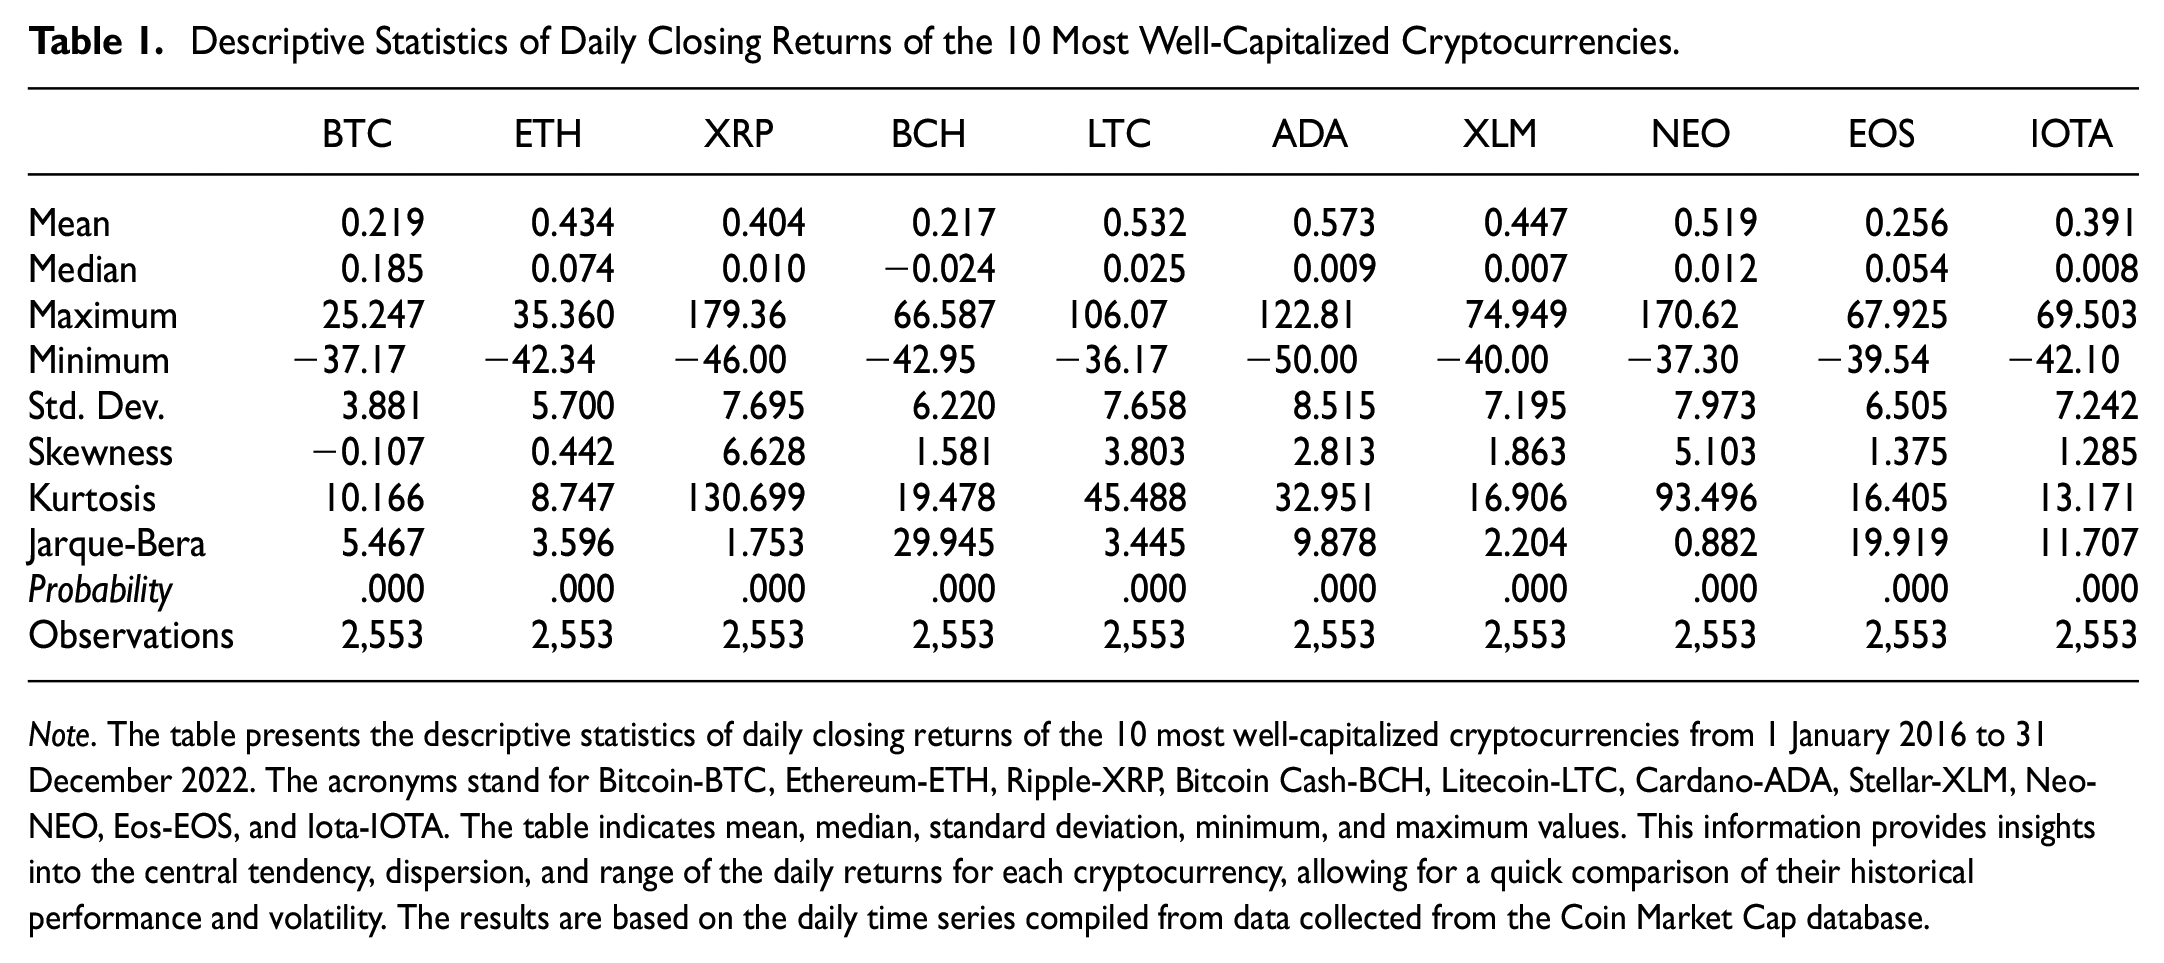
Note. The table presents the descriptive statistics of daily closing returns of the 10 most well-capitalized cryptocurrencies from 1 January 2016 to 31 December 2022. The acronyms stand for Bitcoin-BTC, Ethereum-ETH, Ripple-XRP, Bitcoin Cash-BCH, Litecoin-LTC, Cardano-ADA, Stellar-XLM, Neo-NEO, Eos-EOS, and Iota-IOTA. The table indicates mean, median, standard deviation, minimum, and maximum values. This information provides insights into the central tendency, dispersion, and range of the daily returns for each cryptocurrency, allowing for a quick comparison of their historical performance and volatility. The results are based on the daily time series compiled from data collected from the Coin Market Cap database.
Table 2 presents the correlation matrix by summarizing the variance, variance inflation factor (VIF), and pairwise correlations of the 10 most capitalized cryptocurrencies based on daily returns from 2016 to 2022. According to cross-correlations analysis, on average, all cryptocurrencies are positively correlated and provide less space for diversification. However, there is a lower variability in all correlation pairs with ADA and XLM, whose correlation spans from +.368 to +.545. This can be explained by their lower median values of 0.009 and 0.007, respectively. Moreover, BTC and ETH are leading instruments since their price changes influence the movements of the other coins. Finally, the VIF test highlight values below the five thresholds (VIF < 5), confirming that multicollinearity is not a concern. However, the method used in our case ignores multicollinearity issues.
Matrix of Correlations Between the 10 Most Well-Capitalized Cryptocurrencies.

Note. The table shows the cross-correlations analysis of the 10 most capitalized cryptocurrencies from 1 January 2016 to 31 December 2022. The correlation matrix measures the strength and direction of the linear relationship between the daily returns of each pair of cryptocurrencies. A positive correlation indicates that the returns of the two cryptocurrencies tend to move in the same direction and vice versa. This information helps assess the diversification potential of a cryptocurrency portfolio, as investments with low correlations can help reduce the portfolio’s overall risk. The results are based on the daily frequencies compiled from data collected from the Coin Market Cap database. The results have been generated in R studio using the “corr” function and the “ggplot2” package.
Additionally, correlation coefficients give insights into the potential diversification benefits of combining diverse cryptocurrencies in a portfolio. This information helps evaluate each cryptocurrency’s risk and return characteristics and perform regression analysis. Understanding the variance and VIF of cryptocurrencies can help create a diversified investment portfolio and identify potential risks.
Figure 2 indicates the daily series of the top five cryptocurrencies with the most significant trading volume in 2022. From 2017 to 2022, Bitcoin and Ethereum experienced significant growth in price and adoption. The BTC prices exploded in November of 2021, reaching an all-time high of $66,900. This was primarily due to increased institutional investment and public interest in cryptocurrencies. Ethereum, on the other hand, had a slower start, but its price surged in late 2021 and early 2022, reaching $4,700 in November 2021. Both experienced a pullback in price in the second half of 2022, but overall, the period from 2017 to 2022 was characterized by significant growth. The USDT (Tether) and USDC (USD Coin) are all cryptocurrencies pegged to the US dollar. They were developed as stablecoins, designed to maintain a stable value relative to the US dollar. From 2017 to 2022, USDT and USDC raised the interest of crypto gurus as more people turned to stablecoins to protect them from price volatility.
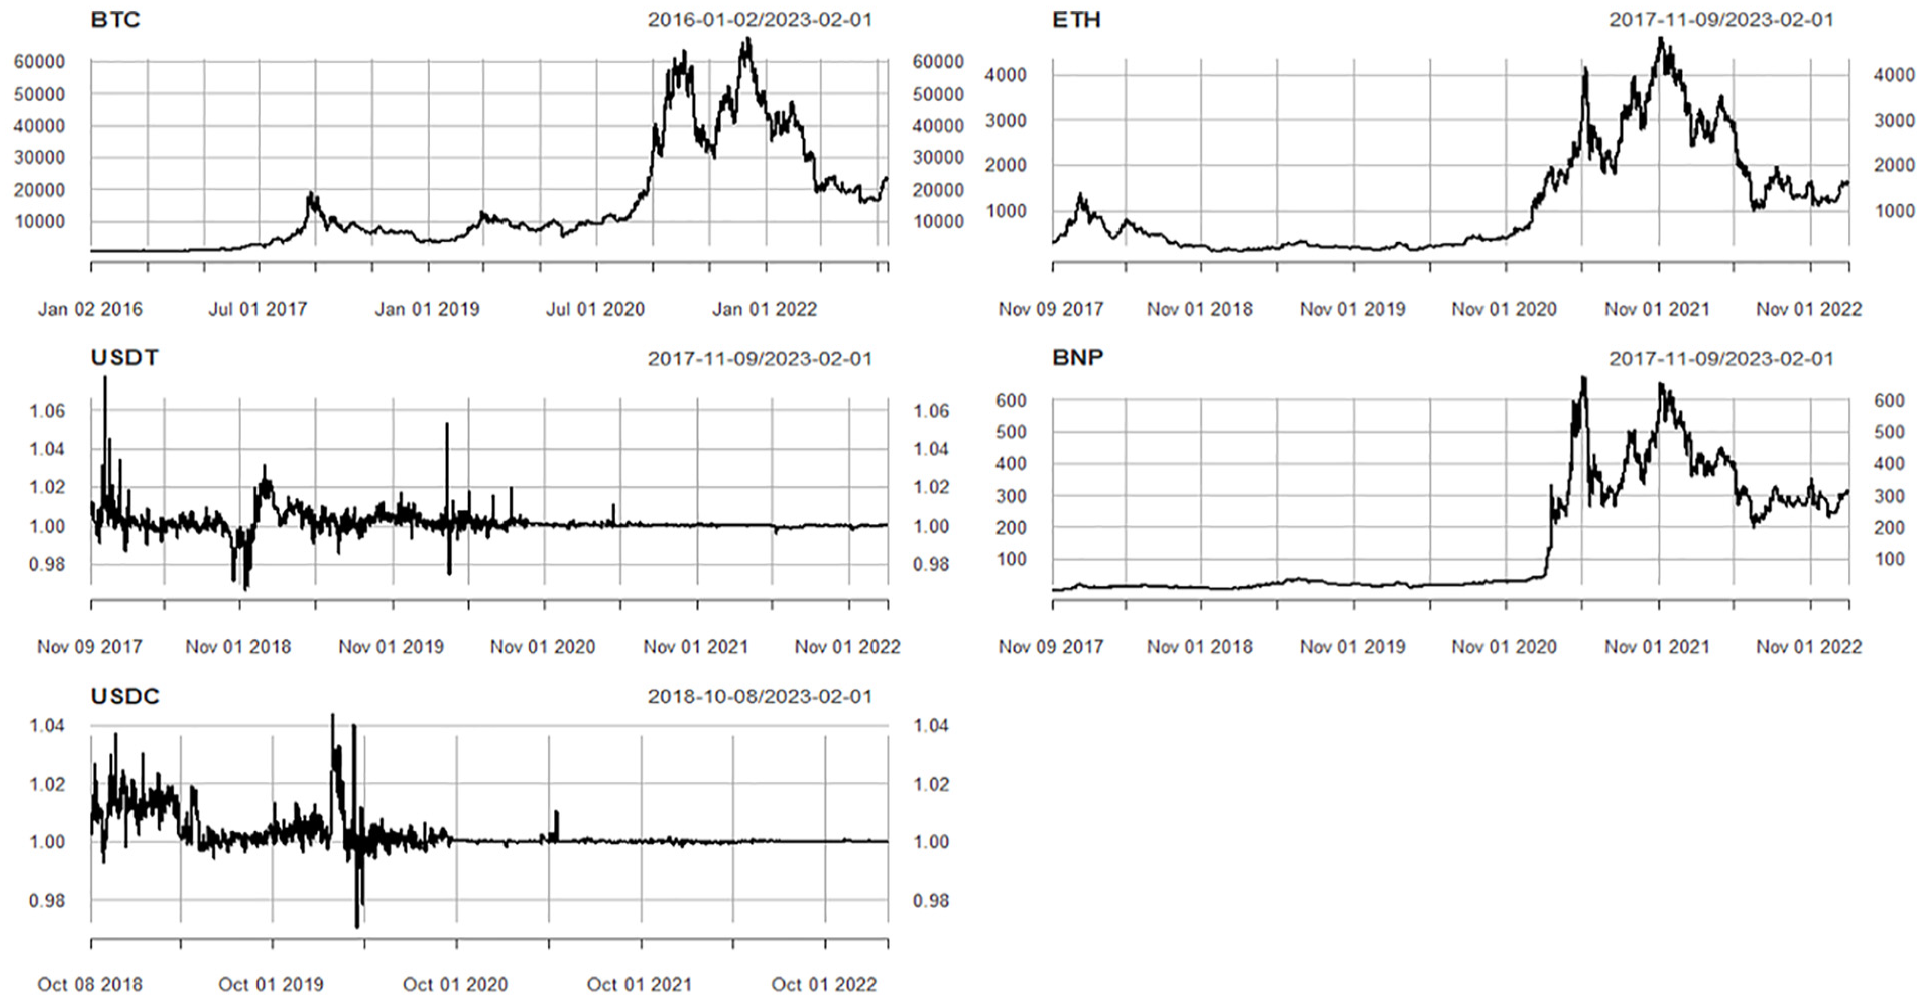
Time series of top five cryptocurrencies with the highest trading volume in 2022.
Methods
This part is divided into two sections, where the portfolio diversification model is presented in Section 2.2.1., while Section 2.2.2. presents the Facebook Prophet prediction model.
Portfolio Diversification Model
The Markowitz diversification formula is applied to all portfolios independently from 2016 to 2022. The formula is implemented for each portfolio based on ranking cryptocurrencies (trade volume) in the respective year. The correlation coefficient, weight concentration, and the standard deviation of returns determine portfolio risk. Correlation is computed from the cryptocurrency’s daily logarithmic returns. The higher the positive correlation between cryptocurrencies, the greater the diversification risk and the other way around. In addition, higher weight concentration and volatility carry more considerable portfolio risk and vice versa. The following diversification formula was used to calculate the portfolio risk of cryptocurrencies:

Where:

Where:
Cryptocurrencies hold diverse trade volumes from 2016 to 2022 within the Coin Market Cap database (Coin Market Cap database [CMC], 2021). For this purpose, weighted average returns are used since cryptocurrencies have different weights in each portfolio:

Where:

Where:
Estimations With Facebook Prophet
The Facebook prophet is a prediction technique based on the additive regression model where the series can be annual, monthly, daily, or hourly. The prophet method is robust to missing data, problems with outliers, and dramatic shifts in time series. Moreover, it is open-source software constructed by Facebook’s Core Data Science team (Taylor & Letham, 2018). Facebook has generated the model for its purposes, where it finds application in planning and goal targeting. We have implemented prophet in R studio through the packages “prophet,”“lubridate,” and “ggplot2.” The algorithm of this model is built on three main parameters, such as growth rate

Where:

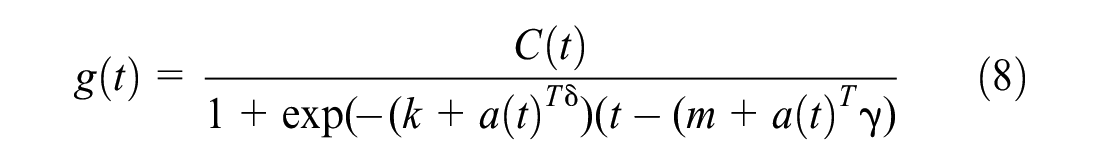
The logistic growth model is identified by carrying capacity

While the growth rate in the logistic model takes the formula:
The changing capacities
Results
The results are divided into two parts: Section 3.1. stand findings from the portfolio diversification model of the portfolios with 5, 10, and 15 most tradable cryptocurrencies; in Section 3.2. predictions with the Facebook prophet.
Estimated Diversification Results
The study explores the diversification benefits of creating three different crypto portfolios. Portfolio A1 contains the five most traded cryptocurrencies named Crypto 5; Portfolio A2 holds the 10 most traded cryptocurrencies (Crypto 10), whereas Portfolio A3 holds the 15 most traded cryptocurrencies (Crypto 15). Figure 3 shows the portfolio risk, volatility level, and average daily returns of the portfolio with five cryptocurrencies (Portfolio A1) from 2016 to 2022. Portfolio A1 in 2018 is characterized by the highest portfolio risk (diversification risk), corresponding to the period when cryptocurrencies reached high popularity. Diversification risk (dR) moved from 3.4% in 2016 to 5.8% in 2017, an increase of 70%. The volatility level of cryptocurrencies was very high during 2017/18, with Bitcoin leading the movements in the crypto market. As a result, the diversification risk of Portfolio A1 from 2018 to 2019 declined by 20.7%. From 2018 to 2020, there was a substantial reduction in the diversification risk and concentration level of Portfolio A1. During the COVID-19 pandemic (2020 and 2021), increased risk exposure is justified by higher trading activity.
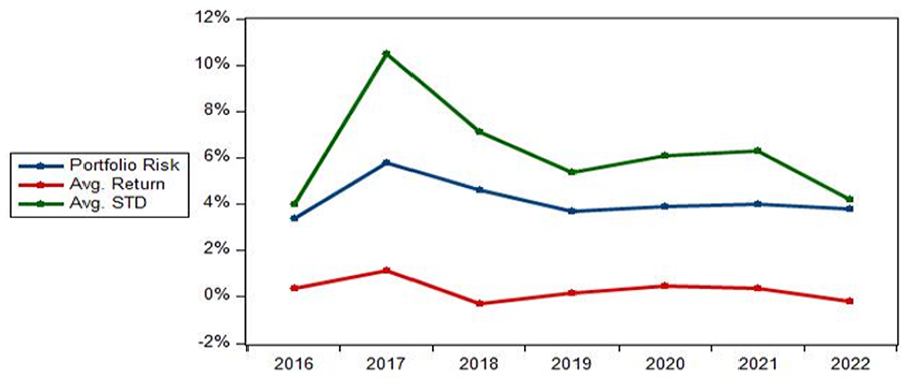
Estimated risk level and average daily returns of the portfolio with five cryptocurrencies (Portfolio A1).
Average daily returns (WAR) stand in line with standard portfolio theory, where high returns offset high-risk levels. An additional component of diversification risk is the concentration level measured through the HHI index. Based on Figure 4, the concentration of Portfolios A1 drops from HHI = 6261 in 2016 to HHI = 3871 in 2021. Portfolio A1 had the highest average HHI value, indicating that it was more concentrated than Portfolio A2 and A3. Portfolio A2 had a lower average HHI compared to A1, indicating a better-distributed market share in the portfolio. Portfolio A3 had the lowest average HHI, representing the lowest portfolio concentration. The diversification risk of Portfolio A1 decreased from 2016 to 2022, as evidenced by a drop in the HHI index. The average diversification risk of Portfolio A1 was 4.17%, with an average volatility of 6.23% and average daily returns of 0.29%. Bitcoin remains a leader in the crypto market, contributing to a minor decrease in concentration levels from 2019 to 2022, where the average market concentration was4,488 points. There is no specific reason for the decline in the concentration of cryptocurrencies from Bitcoin to other cryptocurrencies from 2016 to 2018.

Herfindahl-Hirschman Index (HHI) of selected portfolios of cryptocurrencies.
However, factors contributing to this decline may be linked to regulatory scrutiny, market manipulation, speculation, lack of adoption, security, and scalability concerns. Additionally, the crypto market was overheating and undergoing correction during that period. Another reason for the decrease in risk after 2017 is related to the weakened dominance of BTC and ETH. At the same time, during this period, many ICOs are presented that attract the interest of investors. In less than 2 months, from December 15, 2017, to February 2018, BTC lost nearly 50% of its value, falling from $19,650 to $9,240. The same shock followed ETH as well, where its market capitalization decreased by 47.8% for the same time interval. This fact caused many crypto exchanges to be closed during this period and many scams to be visible. Since then, investors were much more cautious, and the narrative that BTC prices are always on the rise faded. Consequently, these events can be an extra element for the diversification risk to decline.
Figure 5 presents the portfolio’s risk-return volatility and concentration level with 10 cryptocurrencies (Portfolio A2) named Crypto 10. Even though in Portfolio A2, the number of cryptocurrencies is higher than in Portfolio A1, the outcomes move in almost similar trends. The year 2017 holds the highest diversification risk (

Risk level and the portfolio’s average return with 10 cryptocurrencies (Portfolio A2).
The average volatility rate increased by 4.6% from Portfolio A1 to Portfolio A2, while the average concentration dropped by 11.3%. The results suggest that investing in Portfolio A2 might expose crypto investors to lower diversification risk and decline market concentration while still offering similar average daily returns as in Portfolio A1.
Figure 6 covers Portfolio A3, which includes the 15 most traded cryptocurrencies from 2016 to 2022. The average diversification risk of Portfolio A3 stands at the level of 3.65%, and the average volatility is 6.44%, the average daily returns are in the range of 0.28%, and the concentration level of3,625. Increasing the number of cryptocurrencies in the portfolio (moving from Portfolio A1 to A2 and then to A3) diminishes the diversification risk and the HHI index. As a result, portfolio A3 holds a lower diversification risk than Portfolio A2 and A3 but also generates lower weighted average daily returns. Although portfolios with the most significant number of cryptocurrencies (switching from A1 to A2 and then to A3) increase average volatility. Regarding diversification risk (

Risk level and the average return of the portfolio with 15 cryptocurrencies (Portfolio A3).
Table 3 presents the analysis of risk components for Portfolios A1, A2, and A3 for the period from 2016 to 2022. The results indicate that Portfolio A3 had the lowest average risk, standard deviation, and HHI, while Portfolio A1 had the highest risk inputs. The return and performance ratios (Sharpe Ratio and Jensen’s alpha) are risk-adjusted performance metrics used to evaluate the performance across the portfolios. The Sharpe ratio for Portfolio A2 was highest on average (0.5) compared to Portfolios A1 (0.3) and A3 (0.2), indicating that Portfolio A2 had the best risk-adjusted return over the period. A higher Sharpe ratio indicates a better tradeoff between return and risk. In addition, an upbeat Jensen’s alpha indicates that a portfolio has generated returns higher than its benchmark, while a negative Jensen’s alpha indicates underperformance compared to the benchmark. For example, Jensen’s alpha for Portfolio A2 was highest on average (0.4) compared to Portfolios A1 (0.3) and A3 (0.3), indicating that Portfolio A2 outperformed the benchmark portfolio. The differences between the participants in the crypto market and conventional financial securities are substantive. This issue stands as one of the main limitations of this study. Financial securities demand is primarily occupied by institutional investors, where trading is part of the daily routine. So even if they don’t generate the expected returns 1 day, they return the next day and reinvest. On the other hand, the crypto industry consists mainly of individual investors, and most do not understand the price mechanism. If they generate losses, most of them may not return to invest due to budget constraints.
Analysis of Risk Components for the Portfolios A1, A2, and A3 From 2016 to 2022.

Note. This table presents the analysis of risk components for Portfolios A1, A2, and A3 from 2016 to 2022. The columns show the data for each year, and the final column displays the average for each metric. The Avg. STD measures the volatility of the portfolio’s returns, with a higher standard deviation indicating a higher level of risk; Avg. Return is the portfolio’s average return; HHI stands for the concentration level. Sharpe ratio is a measure of the risk-adjusted return of a portfolio, with a higher Sharpe ratio indicating a better risk-return tradeoff. On the other hand, Jensen’s alpha is a measure of the portfolio’s performance relative to a benchmark. The results are based on the daily returns series compiled from data collected from the Coin Market Cap database.
Estimated Forecast With Facebook Prophet
This section makes two estimated predictions for BTC and ETH for 210 trading days (7 months ahead). The level data in Figure 7 are based on daily frequencies, covering the period from 1 January 2017 to 1 November 2022. It highlights that the BTC and ETH market prices in May 2023 are 10 toward zero value. The BTC will reach $80 while ETH will stand in hostile territories.

Estimated predictions for BTC and ETH through the Prophet package.
Standing on the prophet’s estimated forecasts, BTC and ETH will go toward destruction. Since BTC and ETH are the main drivers of this industry, the entire crypto market may be at risk. We can say yes if these estimates make sense in the current context. First, since the outbreak of the war in Ukraine, cryptocurrencies have lost the attention they had in social forums, TV news, and public discourse. Second, lack of awareness and the speculative behavior of instruments with no intrinsic value has made BTC under $20k while ETH under $1,500. Third, the complexity of this technology and the need for price stability made it impossible to find broad applications. Fourth, BTC and ETH might have reservation prices related to mining activities (investors sunk cost) that could prevent the rapid drop in market prices. Additionally, investors who genuinely believe in the future of this technology might as well restrain the price decline. These are critical moments for this crypto industry and its existence.
Figure 8 represents the daily and monthly seasonality patterns related to BTC and ETH. The price trend is down, while the day of the week experiences a distinct way. On Wednesdays, BTC, as well as ETH, usually reach the peak of price growth. After Wednesday, both cryptos experience price declines, whereas for BTC, the decrease continues until Thursday, while for ETH until Friday. The ETH market prices from Sunday to Tuesday have very little volatility. On the other hand, Bitcoin experiences another high spike on Monday but is always more minor compared to Wednesdays. As for monthly seasonality (day of the year), both cryptos significantly declined from May to June. The reduced activity likely justifies this due to the beginning of the summer season. However, when people return to work in September (the holidays are over), the BTC and ETH prices take another high spike. In other words, market prices increase during the winter and fall during the summer.
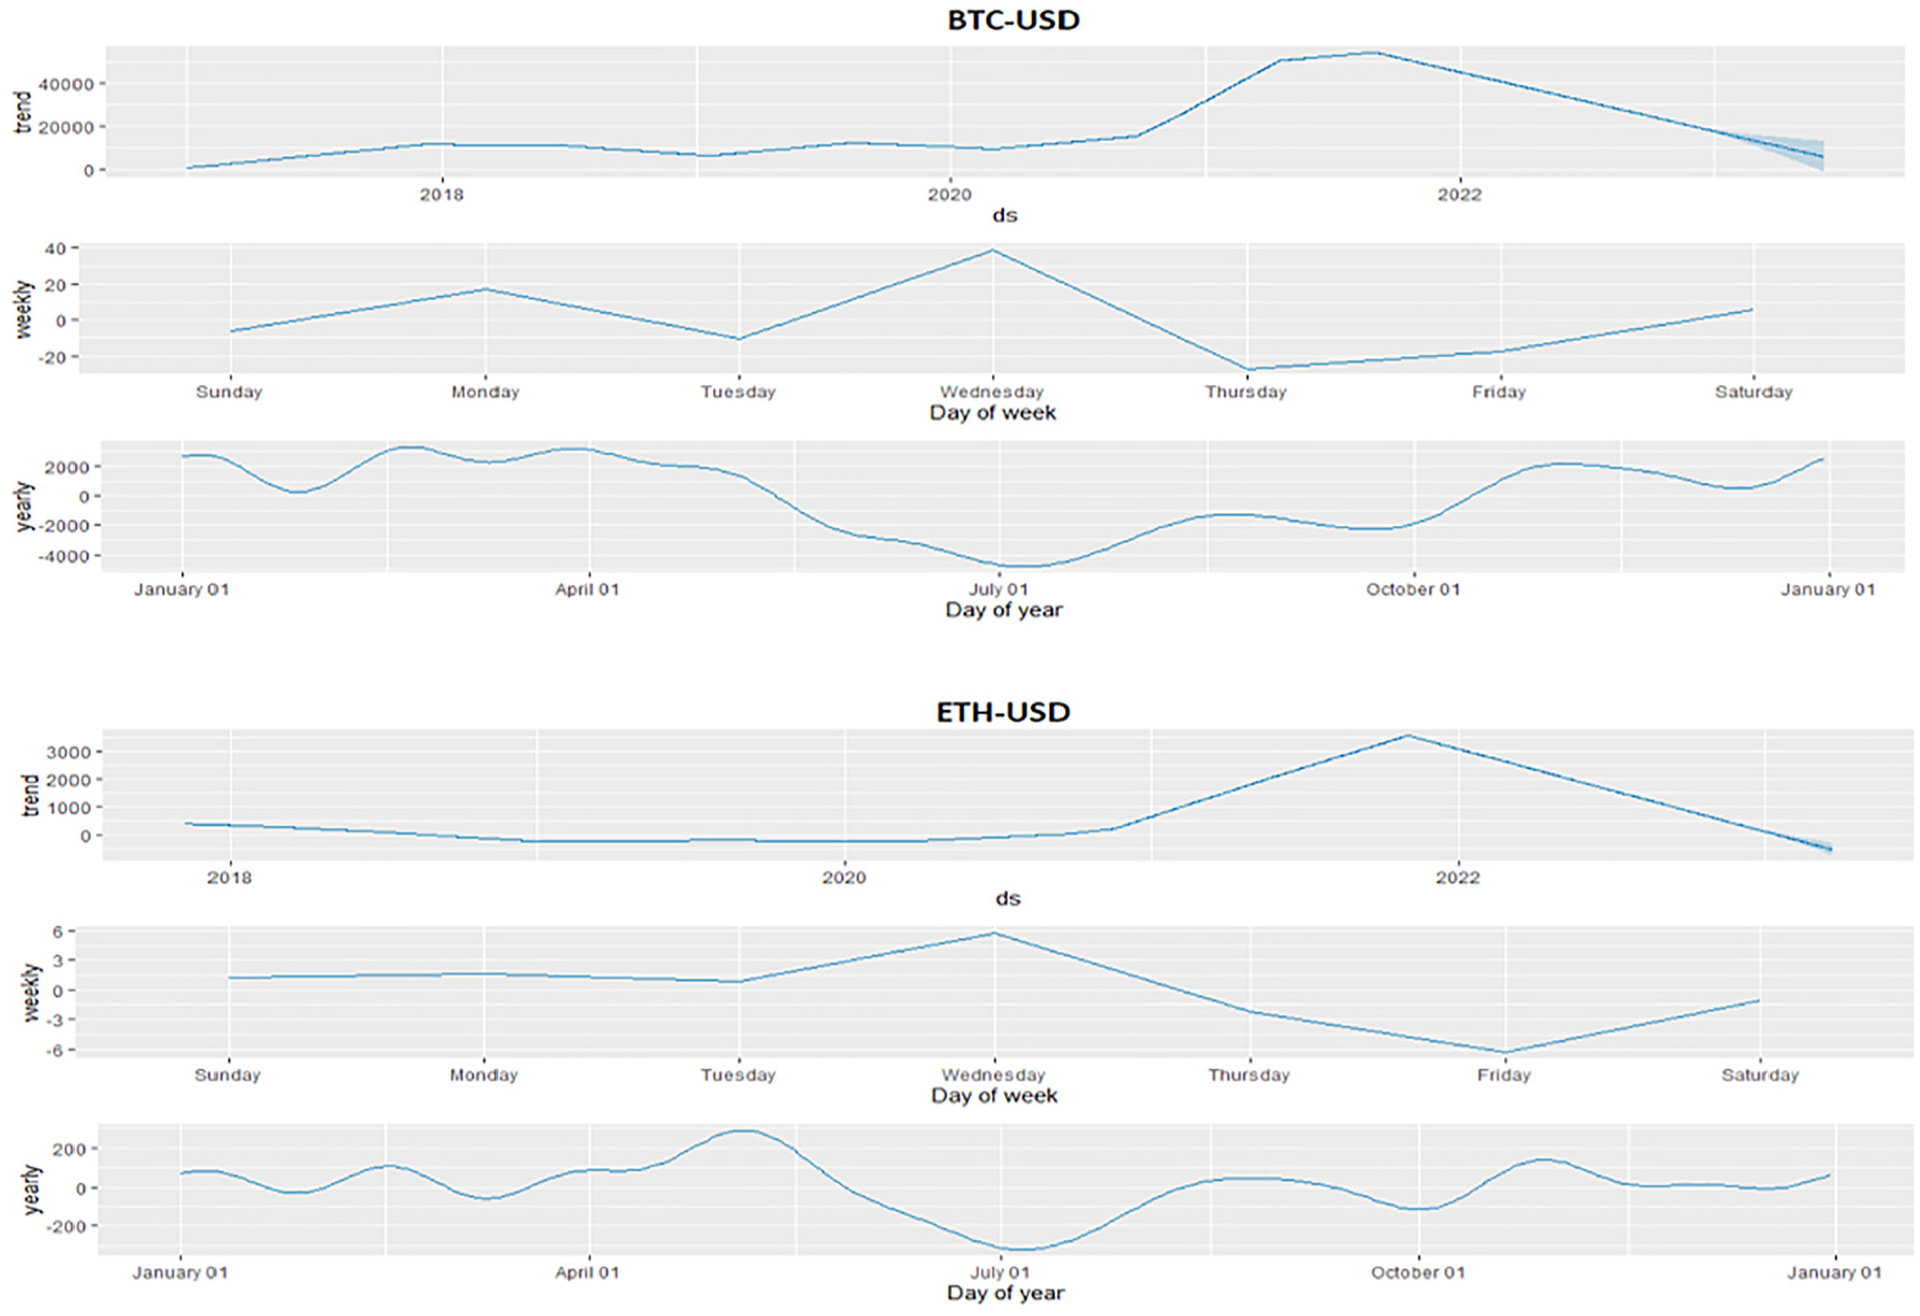
Seasonality patterns of BTC and ETH based on the Facebook Prophet model.
Conclusions
Cryptocurrencies have emerged as the last decade’s most popular and exciting technology. They are gradually becoming acceptable payment mechanisms, speculative instruments, and hedging securities. Besides the advantages that digital currencies offer, there are numerous risks that this technology entails. Bitcoin, along with other Altcoins, contains a sophisticated technology incomprehensible to most participants. The study analyzes the diversification risk-return tradeoff for the five, ten, and fifteen most traded cryptocurrencies. The results indicate that the relationship between risk and returns of the crypto portfolios stands in line with the portfolio theories. Higher returns and vice versa offset the increase in the diversification risk of the three different crypto portfolios. On average, the portfolio with the 10 most traded cryptos generates better optimization than those with 5 and 15. At the same time, portfolio A2 (Crypto 10) offers, on average, identical returns to Portfolio A1 but, at the same time, generates lower moderate risk. However, Portfolio A3 contains lower risk than Portfolio A1 and A3 but also provides lower returns. Portfolio management theories confirm that increasing the number of financial securities diminishes diversification risk and lowers returns. To this end, previous portfolio theories apply when moving from Portfolio A1 to Portfolio A3 but find no confirmation when moving from Portfolio A1 to A2. The highest diversification risk is presented in 2018 in all three portfolios, corresponding to when cryptocurrencies became popular speculative securities. The high Sharpe ratio of Portfolio A2 indicates that it generates higher excess returns relative to its risk compared to the other portfolios. The high Jensen’s alpha of Portfolio A2 suggests that it outperforms the benchmark portfolio. To this end, Portfolio A2 might be an attractive allocation choice for those seeking high-risk-adjusted returns relative to a benchmark. Additionally, it is crucial to understand the limitations of these metrics. The Sharpe ratio only considers the return-to-risk ratio and does not consider other factors, such as volatility clustering or skewness. On the other hand, Jensen’s alpha assumes that the portfolio’s beta is equal to 1, which may not always be the case, and does not account for other systematic risks. Therefore, it is essential to use a combination of metrics and to thoroughly analyze the portfolio’s risk and return characteristics before making any investment decisions.
The outcomes of our work provide signals for investors who focus only on crypto investments concerning the risk-return patterns from 2016 to 2022. However, changeable weights were used for all crypto portfolios, while a more realistic approach would be to place equal weights. The portfolio optimization is a complex issue and analysis requires tracking the risk pattern in dynamic path, probably on a monthly basis. Our work used historical data to analyze the risk-return tradeoff of the most traded cryptocurrencies, potentially failing to accurately predict future market trends due to the volatile nature of cryptocurrencies. Our assumption of changeable portfolio weights may not mirror real-world investment scenarios where such frequent changes are less feasible. Additionally, the study didn’t account for factors like volatility clustering or skewness in calculating the Sharpe ratio and assumed a constant portfolio beta when computing Jensen’s alpha. Lastly, our focus on the top 5, 10, and 15 cryptocurrencies may limit the applicability of our findings to the broader range of available cryptocurrencies. Future research should consider a more realistic approach with equal portfolio weights, broader cryptocurrency selection, and diverse risk-return metrics. Investigations into predictive modeling, impact of evolving regulations, monthly tracking of risk patterns, and the effectiveness of cryptocurrencies as hedging instruments could provide more comprehensive and valuable insights.
Footnotes
Declaration of Conflicting Interests
The author(s) declared no potential conflicts of interest with respect to the research, authorship, and/or publication of this article.
Funding
The author(s) disclosed receipt of the following financial support for the research, authorship, and/or publication of this article: This research was supported by the project IVSUZO2301—The impact of the circular economy on the share prices of companies listed on the stock exchange.