
Abstract
In this paper, we examine the effect of explosive behaviors in the Bitcoin market on the top 10 largest stock markets of developed and emerging countries. The daily dataset, including the Dow Jones Industrial Index (DJIA), Nasdaq (NSQ), Shanghai Composite Index (SSE), Nikkei 225 (N225), Hang Seng Index (HSI), Shenzhen Composite Index (SZSE), Euronext Amsterdam Index (AEX), London Stock Exchange (LSE), Toronto Stock Exchange (TSX), and Bombay Stock Exchange (BSE), spans July 21, 2010, to December 9, 2022. We first investigate the existence of explosive price behaviors using the bubble detection test of Phillips and Shi and the results provide evidence of multiple bubble episodes, coinciding with the monetary policy actions of the FED and ECB. Then, we address the question of whether the explosive behaviors detected affect the variance of equity returns by employing a GARCH model. The impact is negative, albeit its magnitude and significance vary among stock indices.
Introduction
Asset bubbles are a critical issue for investors and other relevant authorities because they have unpredictable effects on the financial stability of an economy (Xiong et al., 2020). In financial markets, a bubble is defined as a continuous and systematic deviation of the market value of an asset from its fundamental value. These price fluctuations cannot be explained by fundamental factors (Diba & Grossman, 1988). Such deviations are primarily due to optimistic investor sentiment, which increases the aggregate demand for assets (Kyriazis et al., 2020). Studies that identify asset price bubbles generally have two steps. The first assesses the empirical characteristics of the asset price series. For this purpose, the bubble detection test by Phillips et al. (2015) is widely used. Secondly, since a bubble is defined as a deviation of prices from their fundamental value, any statement about asset price bubbles requires an understanding of the fundamental value of the underlying asset (Gronwald, 2021). Speculative bubbles occur primarily when investors consider selling digital currencies with limited supply, such as Bitcoin, above the price at which they were purchased (Geuder et al., 2019). Speculative bubbles can thus be described as a prolonged rise in asset prices followed by a fall in prices (Chan et al., 1998). Speculative bubbles have been the focus of attention of researchers, investors, and market regulators for many years. For this reason, numerous studies investigate the existence of bubbles in various markets. For example, bubbles have been identified in stock markets (see, e.g., Chan et al., 1998; Diba & Grossman, 1988; Homm & Breitung, 2012; Kılıç, 2020; G. Wu & Xiao, 2008), housing markets (see, e.g., Abraham & Hendershott, 1996; Mikhed & Zemčík, 2009; Shi, 2017), foreign exchange markets (see, e.g., Bettendorf & Chen, 2013; Meese, 1986; Woo, 1987; Y. Wu, 1995), crude oil prices (see e.g., Miller & Ratti, 2009; Su et al., 2017; Zhang & Yao, 2016), real estate markets (see, e.g., Herring & Wachter, 2003; Kim & Suh, 1993), and agricultural commodity prices (see, e.g., Adämmer & Bohl, 2015; Baldi et al., 2016; Gutierrez, 2013).
In recent years, the growing interest in cryptocurrency markets has led researchers (see, e.g., Cagli, 2019; Cheah & Fry, 2015; Corbet et al., 2018; Fry & Cheah, 2016; Gronwald, 2021; Kyriazis et al., 2020) to investigate the presence of speculative bubbles in cryptocurrency prices. Cryptocurrencies are among the most remarkable financial innovations of the last decade (Enoksen et al., 2020). Given their exceptional return potential and unpredictable sharp price drops (Shu & Zhu, 2020) during periods of extreme price increases (Cagli, 2019; Hakim das Neves, 2020; Makarov & Schoar, 2020), they have attracted considerable interest in financial circles as an alternative to traditional investment instruments. Schinckus et al. (2021) suggest that anonymous cryptocurrencies are very good assets in terms of diversification, while Ali et al. (2023) state that Bitcoin emerged as an alternative safe asset in 2008. Bitcoin, Ethereum, Tether, Ripple, and Litecoin are among the cryptocurrencies with the highest market values. However, with the rise of cryptocurrency investors, this list is continuously changing. Bitcoin was the first known cryptocurrency to be based on mathematical cryptology. It is an alternative to government-backed currencies (Cheah & Fry, 2015) and a decentralized digital currency (Corbet et al., 2019; Holub & Johnson, 2019) which originated in an article published by Nakamoto (2008). It ranks first among cryptocurrencies in terms of both market value and price. The main feature that differentiates Bitcoin from other payment methods and makes it popular is its remittance and transaction system which does not require third parties (Corbet et al., 2019; Dwyer, 2015; Faghih Mohammadi Jalali & Heidari, 2020). Bitcoin’s background is blockchain technology, which offers key advantages, such as transparency of information, the ability to make international payments, the anonymity of users, no need for third parties, irreversible payments, no or low transaction costs, no transaction tax, and low risk of theft (Faghih Mohammadi Jalali & Heidari, 2020). Blockchain technology can be considered a combination of a network and a new way of managing databases (Schinckus, 2021). The increasing adoption of blockchain technology and its use in cryptocurrencies enables international investors to exchange cryptocurrencies 24/7 (Begušić et al., 2018). Baek and Elbeck (2015) state that Bitcoin is a flow that can replace financial institutions, an alternative to money, and a hedging method for economies with high inflation. Kılıç and Çütcü (2018) remark that the formation of unique exchanges of cryptocurrencies and the increase in transaction volumes should raise doubts about the future of traditional investment instruments and stock markets. However, the cryptocurrency market still lacks market depth, maturity, transparency, and regulation. In addition, uncertainties such as the dispersion of information among cryptocurrency users influence decision-making mechanisms (Bouri, Gupta, & Roubaud, 2019).
Cryptocurrencies were not considered a threat to financial stability in the early years. The European Central Bank (2012) stated that cryptocurrencies would not threaten financial stability because they have limited links to the real economy, have low transaction volumes, and are not widely accepted by users. However, if we examine the price development of cryptocurrencies in recent years, we can observe a meteoric rise and subsequent fall (Enoksen et al., 2020; Makarov & Schoar, 2020). After the explosion of the Bitcoin price, discussions about the intrinsic or fundamental value of cryptocurrency intensified. While many experts claimed that Bitcoin was a fraud and that its value would eventually fall to zero, others believed that Bitcoin’s growth and further proliferation would continue (Wheatley et al., 2019). In a pioneering study, Cheah and Fry (2015) find that the fundamental value of the speculative bubbles which exist in Bitcoin markets is zero. Similarly, many studies (Bouri, Shahzad, & Roubaud, 2019; Cagli, 2019; Chaim & Laurini, 2019; Cheung et al., 2015; Corbet et al., 2018; Fry, 2018; Fry & Cheah, 2016; Geuder et al., 2019; Gronwald, 2021; Holub & Johnson, 2019; Li et al., 2021; Shu & Zhu, 2020; Xiong et al., 2020) confirm the existence of speculative bubbles in various cryptocurrency markets. As a result, researchers argue that Bitcoin is more of a speculative investment instrument than a medium of exchange (Baur et al., 2018; Glaser et al., 2014; Yermack, 2013).
Apart from these studies, there are several research papers dealing with the link between cryptocurrencies and other financial assets. For example, Zeng et al. (2020) examine the connectedness between cryptocurrencies and conventional financial assets and find that the connectedness between Bitcoin and conventional assets is weak. Corbet et al. (2018) explore the connectedness between cryptocurrency and financial assets and conclude that crypto assets are relatively isolated from financial and economic assets. Hussain Shahzad et al. (2020) examine the safe-haven and hedge properties of gold and bitcoin for G7 countries’ stock markets with data from 2010 to 2018 and find that Bitcoin has a safe-haven role and acts as a hedge against the equity market in Canada. Conlon et al. (2020) study the safe-haven property of Bitcoin and Ethereum for 6 international stock markets (MSCI World, S&P 500, FTSE 100, FTSE MIB, IBEX, and CSI 300) for the period between 2019 and 2020, and reveal that both cryptocurrencies lack the safe-haven property. Bouri et al. (2017) investigate the hedging and safe-haven role of Bitcoin against major stock market indices, bonds, oil, gold, the general commodity index, and the dollar index for the period July 2011 to December 2015 and find that Bitcoin is a weak hedging instrument but plays a strong safe-haven role against Asian stocks.
Our main hypothesis is that the explosive price behaviors in the Bitcoin market significantly and adversely affect the variance of equity returns. To explore this hypothesis, we use the bubble detection test proposed by Phillips and Shi (2020) and GARCH (1,1) model.
This empirical research complements the existing literature in at least two major ways. Firstly, we employ a bubble detection test which is widely used by academic researchers and regulators as a warning device for detecting such episodes and thereby retaining stability in economy and financial markets. Secondly, we consider an extended sample period, covering several financial and geopolitical events as well as before, during, and after the period of the COVID-19 pandemic spanning July 2010 to December 2022, providing a deeper understanding of how speculative bubbles affect the variance of stock index returns. No other recently published paper systematically addresses speculative bubbles in the Bitcoin market or measures their effects directly on the volatility of major stock indices. This ambiguity encourages us to establish a link between cryptocurrency and stock markets. We consider that this makes a significant contribution to the literature.
We investigate the effect of explosive price behaviors in the Bitcoin market on 10 major stock markets over a sample period between 2010 and 2022 at a daily frequency taking two econometric approaches. The results of the bubble detection procedure provide evidence of multiple bubble episodes, which originate during the expansionary monetary policy implementations of the leading central banks. Then we address the question of whether the explosive behaviors detected affect the variance of equity returns by employing a GARCH-GED model. We find that the existence of bubbles adversely affects the return variance at the conventional levels of significance. The volatility of returns strengthens after the termination of bubble episodes and this result is robust to using a larger window length.
Following the introduction, the second section provides a brief review of the data and methodology, the third presents the empirical results, and the last section presents our conclusions.
Data and Methodology
We use daily adjusted closing prices of the 10 largest stock markets in terms of market capitalization. The dataset, downloaded from Yahoo Finance, includes DJIA, NSQ, SSE, N225, HSI, SZSE, AEX, LSE, TSX, and BSE and spans July 21, 2010 to December 9, 2022, with a total of 2,517 daily observations. We select stock indices from the largest markets, including developed and emerging markets, for an appropriate representation of data. Daily logarithmic returns are calculated by taking the difference in the logarithms of two consecutive prices, plotted in Figure 1. We present summary statistics for each return in Table 2.

Index returns.
We follow Phillips and Shi (2020) (PS hereafter) and define a bubble as an explosive behavior of an asset price, representing exuberance in the speculative behavior driving the market. This definition identifies bubbles by their time series characteristics, as the price of an asset follows a mildly explosive or random-drift martingale process, as opposed to the martingale behavior observed during normal market conditions.
To date-stamp bubbles, we use the real-time bubble detection method proposed by PS, which has the advantage of overcoming both unconditional heteroscedasticity and the multiplicity problems encountered in other bubble identification procedures. This procedure is used by central bank economists, policymakers, and financial industry professionals.
The recursive ADF regression is given as:

where k is the (transient) lag order,
Phillips et al. (2015) define GSADF as the largest ADF statistic obtained as the result of a double recursion in the range

where
The BSADF test determines the start and end dates of the bubbles during the sample period.

The start and end date-stamps of the bubbles are estimated as:

where
In the case of the existence of explosive price behaviors, we add dummy variables to the variance equation to determine the impact of these bubble periods on stock markets. Together, we test for structural breaks that might result from the dynamics of the stock markets themselves. Explosiveness in Bitcoin prices and breakpoints in equity markets could lead to unreliable results if they coincide. To detect discrete changes in the variance of a stock return series using the GARCH (1,1) model, the ICSS algorithm proposed by Inclán and Tiao (1994) computes the test statistic as:

where

A series of uncorrelated random variables having a mean of 0 and a variance of
Sansó et al. (2004) also use the iteration approach developed by Inclán and Tiao (1994) in their search for breakpoints in variance. They describe Kappa-1 (K1) and Kappa-2 (K2) as the adjusted test statistics for the distributional and conditional variance characteristics of the underlying series. The K1 test statistic, which shows that the series is not normally distributed and there is no ARCH effect, is defined as:
where


If the series is not normally distributed but has the ARCH effect, the K2 test statistic is derived as:

where
where
Empirical Results
The empirical results section is organized into two parts. Firstly, we describe the variables, present the summary statistics and visualize the return series, then discuss the bubble detection findings and the real-time bubble detection tests. Secondly, we address the impact of bubble formations on stock markets using the GARCH (1,1) model.
The results presented in Table 2 (Panel A) show that all stock returns are, on average, positive, except the R.HSI index, but close to zero over the sample period at a daily frequency. The R.LSE index exhibits the highest (14.27%) and lowest (−15.52%) daily changes and is also more volatile (0.0187) than the others, followed by R.SZSE (0.0175) and R.SSE (0.0144) in terms of standard deviation. None of the indices returns follow a normal distribution, as suggested by significantly negative/positive skewness, significantly positive excess kurtosis values, and the JB normality test statistics at the 99% confidence level. The probability values for the Ljung-Box test for returns, Q (20), and squared returns Q2 (20), show a rejection of the null hypothesis, given that they are smaller than 0.05, and indicate that the residuals are not independently distributed, that is they exhibit serial correlation at predetermined lag 20. Moreover, the Engle’s ARCH test probability values signify the existence of conditional heteroskedasticity (ARCH effects) and indicate the presence of volatility clustering or mean reversion in return series (see Figure 1). All returns series are stationary at the conventional significance level (Dickey and Fuller, 1979; ADF, hereafter; Phillips and Perron, 1988; PP, hereafter) and significantly positively correlated (Panel B) (Table 1).
Descriptive Statistics and Correlation Coefficients of Return Series.
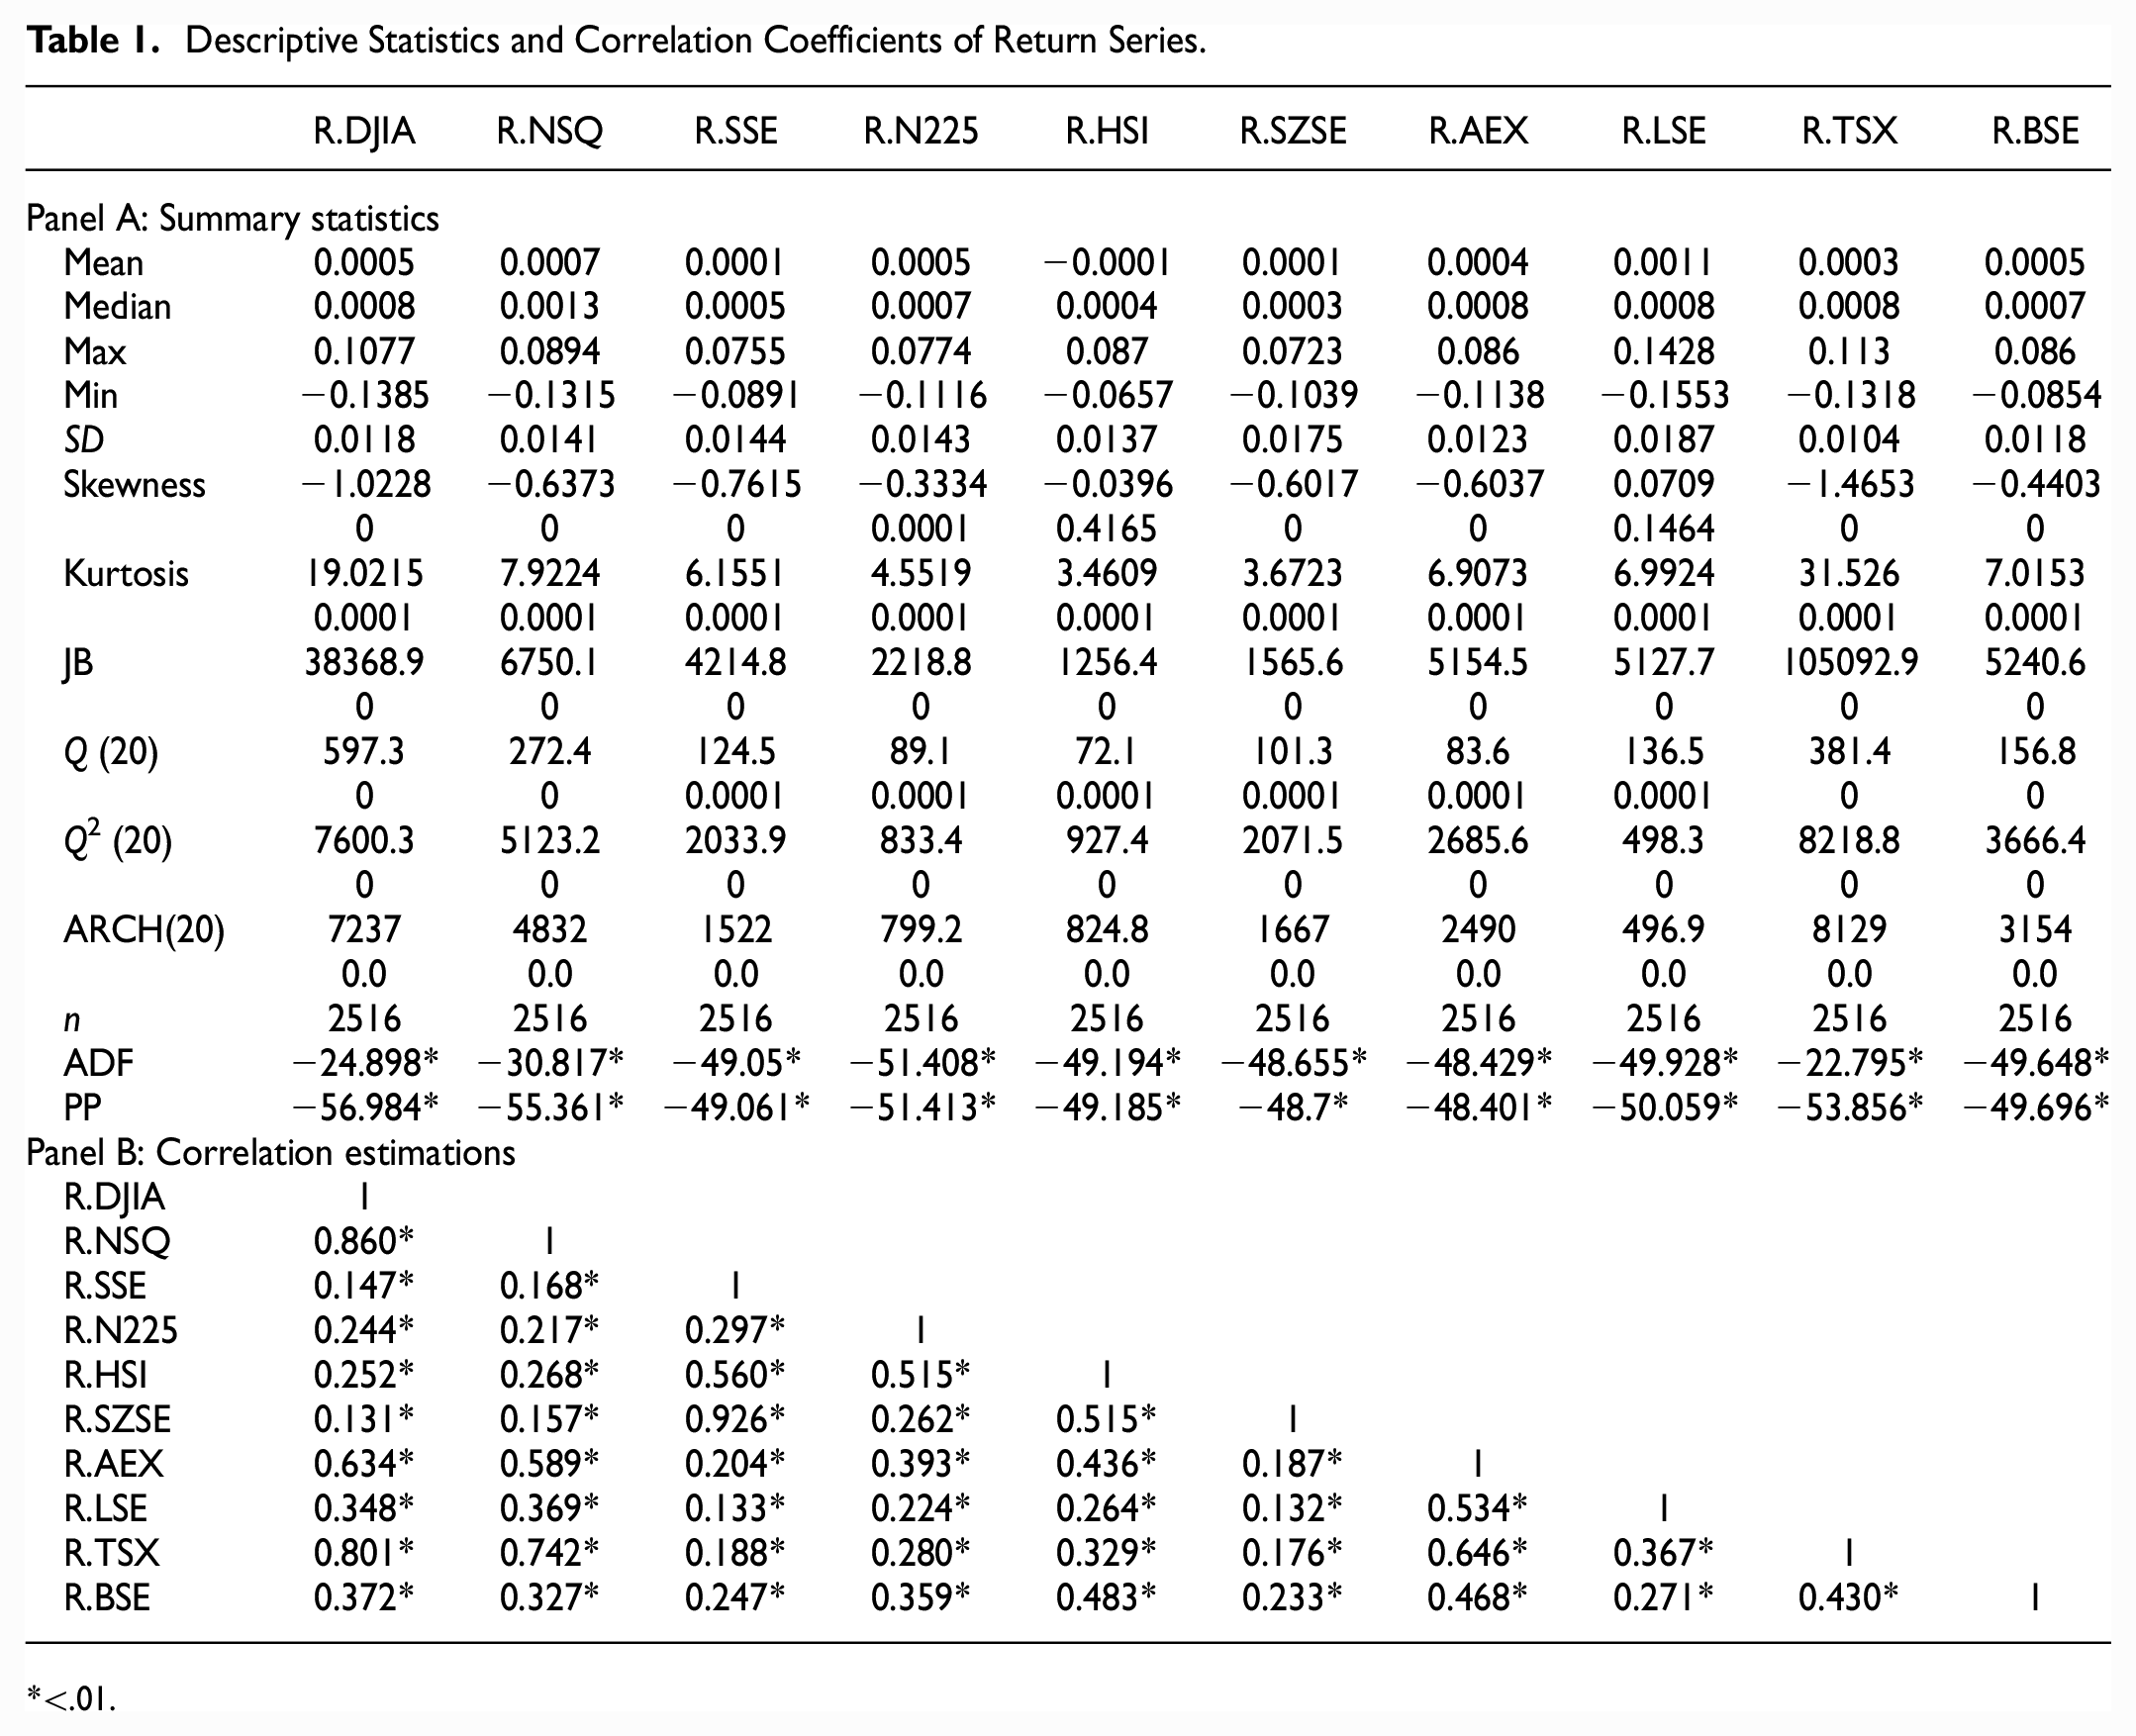
<.01.
GSADF Bubble Detection Test Results
Following the suggestions of Phillips et al. (2015) (PSY, hereafter) and Phillips and Shi (2020), we employ the GSADF test to the Bitcoin market as a first stage and present test statistics along with the critical values obtained using the wild bootstrap procedure execution of Harvey et al. (2016) with 2,000 replications in Table 2. Given that the test statistics for both lengths of window exceed the critical value at 5% significance, we strongly reject the null hypothesis of the nonexistence of bubble behavior in Bitcoin prices. The results provide evidence of multiple episodes of explosive behavior, in line with previous studies such as Gemici (2020), Anyfantaki et al. (2021), Diniz et al. (2022), and Gök (2022). Then we use the real-time bubble detection method, which is immune to unconditional heteroskedasticity and multiplicity problems, to date-stamp bubbles. The results for two minimum window size, 115 and 165, defined based on the rule
GSADF Test Results.

Denotes rejection of the null hypothesis at the 95% confidence level. The test statistics and critical values are obtained by using two R packages of “psymonitor” by Caspi et al. (2018) and “exuber” provided by Vasilopoulos et al. (2018). To remedy the multiplicity issue in the recursive procedure, the empirical size is controlled over 35 days by taking tb = swindow0 + 35 − 1 = 149 (199) observations for each bootstrapped sample in the case of swindow0 = 115 (165) days. The number of lags is selected using BIC.
Explosive Periods in Bitcoin Prices at Two Window Lengths.
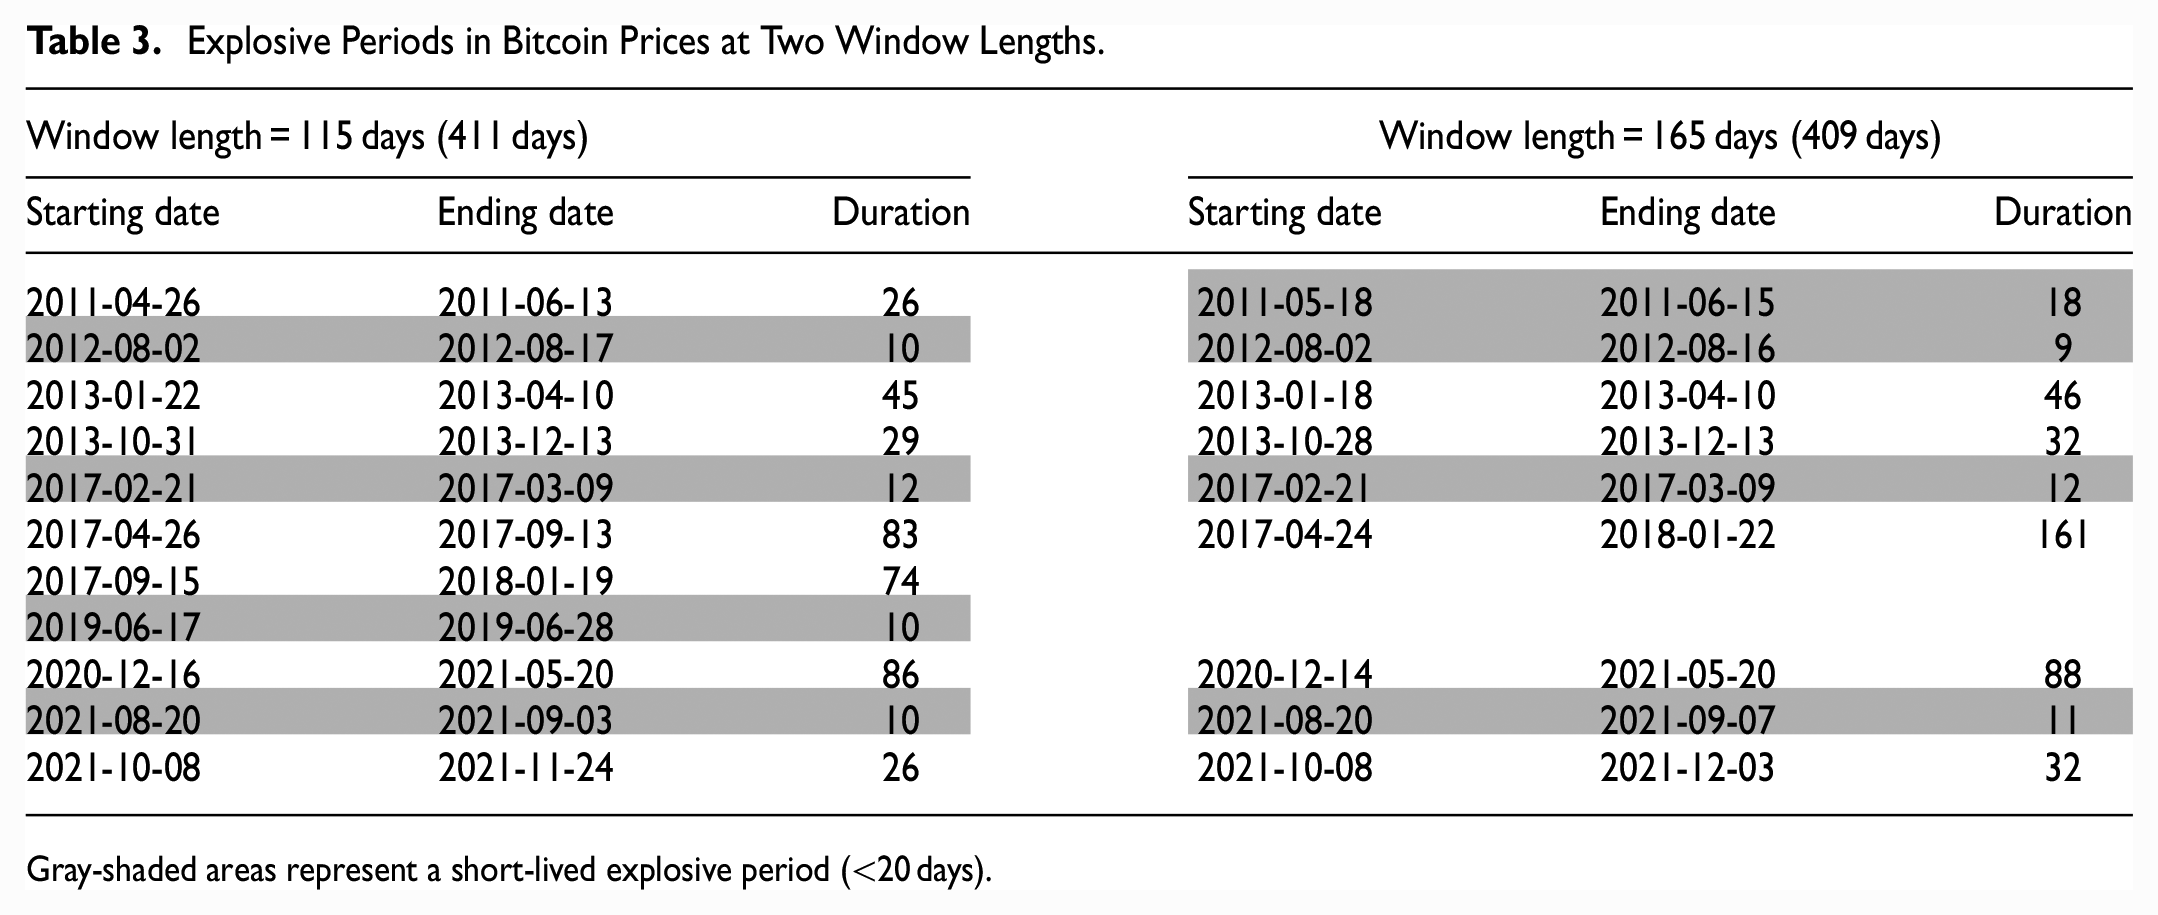
Gray-shaded areas represent a short-lived explosive period (<20 days).
In Figure 2, we illustrate the BSADF sequence (black solid line, left axis) and its critical values for a 95% confidence level (red dashed line, left axis) based on wild bootstrap simulations along with the time evolution of the underlying series (blue solid line, right axis). Note that we impose a minimum duration of 8 days, which is greater than the minimum duration achieved by the rule of thumb log(

Bubble detection test results for Bitcoin prices for window length of 115 days (upper) and 165 days (bottom) panel.
It is quite evident that the results of the bubble detection test are similar and robust to a longer window of 165 days, as the total number of days with explosive prices for this specification is 409 (9 periods) compared to 411 (11 periods) for the specification with the minimum window size (see Table 3).
Estimating GARCH models
In this section, the GARCH (1,1) model is used to examine the impact of bubbles in Bitcoin prices on the variance of stock market index returns. However, due to the impact of numerous financial and economic crises that occurred during the period covered by the study, there may be structural breaks in the variance of the indices’ return series. Therefore, these structural breaks need to be revealed to account for the impact of Bitcoin bubbles on the variance of stock index returns, because the volatility parameters in the GARCH model, which are estimated without taking structural breaks into account, turn out to be larger than they should be. To this end, the test developed by Inclán and Tiao (1994) and Sansó et al. (2004) is used to investigate whether there is a structural change in the variance of the index return series, and the results are presented in Table 4.
Structural Breaks in Variance Test Results.

Table 4 shows the Inclán and Tiao (1994) and Sanso et al. (2004) test results. The results of Inclán and Tiao’s (1994) test indicate that there are multiple breakpoints for each return series. However, this test tends to overestimate the breakpoints in the variance if the current series of returns are normally distributed and there is no ARCH effect. Therefore, we use the modified test results developed by Sanso et al. (2004). In this test, the Kappa-1 test is used when the series is not normally distributed and there is no ARCH effect, while the Kappa-2 test is used when the series is both not normally distributed and the ARCH effect is present. Therefore, we consider the result of the Kappa-2 test. Based on the results, a dummy variable is constructed to represent the breakpoints in the indices and Bitcoin bubble periods in the variance equation of the GARCH (1,1) model. In this way, the effects of structural breaks in the variance are eliminated from the model. By doing so, we determine which breakpoints in the variance equation are statistically significant.
The alpha (α) and beta (β) parameters in Table 5 and Table 6 are positive and their sums are less than one. This shows that the variance is stationary and the persistence of volatility has a high value. We use the GED distribution, which has the best error distribution because the indices’ return series do not have normal distributions.
GARCH (1,1) Model for Bubble Periods Using a 115-Day Window.

Note. Values in parentheses are probability values. V1 and V2 are structural breaks dummies in the variance. Q(50) and Qs(50) show the results of the Ljung-Box autocorrelation test for the returns and the squares of returns, respectively. G = generalized error distribution (GED); Ln(L) = the highest likelihood value of the model; D = dummy variable for Bitcoin bubble periods.
GARCH (1,1) Model for Bubble Periods in the 165-Day Window.

Note. Values in parentheses are probability values, V1 and V2 are structural breaks dummies in the variance. Q (50) and Qs (50) show the results of the Ljung-Box autocorrelation test for the returns and the squares of the returns, respectively. G = generalized error distribution (GED); Ln(L) = the highest likelihood value of the model; D = dummy variable for bitcoin bubble periods.
Tables 5 and 6 show the estimation results of the GARCH models for window lengths of 115 and 165 days, respectively. Note that the values in parentheses are the p-values of the estimates. The results in both tables show that explosive behaviors in the Bitcoin market, which are detected using the procedure of Philips and Shi (2020) and represented as a dummy variable (D), exhibit a significantly negative impact on the return variance of the stock markets, except for the three indices NSQ, HIS, and TSX. The monetary policy decisions of the FED and ECB, especially the quantitative easing programs, and the fact that traders trading on exchanges for speculative purposes turn to cryptocurrency markets during bubble episodes, may lead to a decline in the return variance of local exchanges. However, as is evident from Figures 3 and 4, the return variance of local stock markets rises during non-bubble periods. Notably, the empirical results of the conditional variance show that the price explosiveness in BTC affects the return variances of stock markets at varying significances and magnitudes. This result explicitly suggests that the impact is not related to the level of financial development of the financial market. In line with the findings of Umar et al. (2021), we conclude that investors should exit this market immediately to reduce portfolio losses and protect their assets in times of falling BTC.

Conditional variance of index returns and bubble episodes for window length of 115 days.

Conditional variance of index returns and bubble episodes for window length 165 days.
Conclusion
We find explosive price behaviors in the Bitcoin market, then gauge their impact on major stock market indices over the sample period 2010 to 2022. The bubble detection test results show evidence of multiple short- and long-lived bubble episodes in the Bitcoin market, and their origination and termination dates markedly coincide with the acceptance or rejection of Bitcoin as a payment instrument in particular, and the implementation periods of expansionary monetary policies, particularly those implemented by the FED. To measure the impact of the exuberance and collapse in Bitcoin prices on the variance of equity returns, a GARCH (1,1) model comprising two dummy variables is implemented, with each explosive price behavior in Bitcoin as well as structural breaks identified in stock markets taking values of 0 or 1. The results show that the effect is significantly negative for most stock markets, suggesting that Bitcoin bubbles play a vital role in the return volatility of equities regardless of market capitalization.
These findings have important implications for decision-making by policymakers and investors. Firstly, our results suggest using the PS test as a real-time bubble detector to help policymakers maintain economic and financial stability, since this algorithm allows timely policy action and effective risk management to avoid or reduce serious real and financial damage (Phillips & Shi, 2020). Furthermore, investors can use our findings to explain volatility in stock markets during and after the bubble episodes in cryptocurrency markets given that bubble formation and collapse can drive volatility in stock returns and thereby lead to higher losses in portfolios. As suggested by Gök (2021), investors may behave rationally when they perceive the early signs of explosive price behaviors in the Bitcoin market and leave the market, being content with the profits obtained before the collapse and therefore providing protection against downside risk. Investigating the impacts of bubbles on the return volatility of stock markets with novel econometric approaches and considering the relative importance of other variables, such as policy uncertainty or geopolitical risk indicators, would be a fruitful area for future empirical studies.
Footnotes
Declaration of Conflicting Interests
The author(s) declared no potential conflicts of interest with respect to the research, authorship, and/or publication of this article.
Funding
The author(s) received no financial support for the research, authorship, and/or publication of this article.