
Abstract
Developed to maximize learning performance, learning analytics dashboards (LAD) are becoming increasingly commonplace in education. An LAD’s effectiveness depends on how it is used and varies according to users’ academic levels. In this study, two LADs and a learning support system were used in a higher education course to support students’ cognitive and self-regulated learning (SRL) strategies. A total of 54 students’ learning logs on three systems and their learning performance scores were collected; descriptive statistics of learning behaviors, Mann-Whitney U test, and lag sequential analysis were used to explore how students with different learning performances used LADs to support their learning. Compared to low-performers, high-performers used the LADs more frequently during preview and review phases and conducted more monitoring and reflection strategies to support their learning. Finally, some practical implications for improving the design and use of LADs were provided.
Keywords
Introduction
Advances in information and communication technology (ICT) have expanded the possibilities to collect and analyze various educational data. For example, the learning analytics (LA) approach, which measures, collects, analyzes, and reports on learners and learning environments, can help optimize learning and develop educational models (Baker & Siemens, 2014). It can record and monitor students’ learning progress and identify their learning patterns. A learning analytics dashboard (LAD) can then use LA data to display undetected patterns in the learners’ learning progress and behaviors. This can help learners understand what they have been doing and what they should do (Teasley, 2017).
Several studies focused on the design and use of LADs in educational settings, such as monitoring learning data for instructors and learners as the main target users. These studies either focused on improving teaching and learning (e.g., Schwendimann et al., 2016), or verifying an LAD’s effectiveness in comprehension through the educational practice (Wang & Han, 2021). Susnjak et al. (2022) reviewed 17 dashboards targeting learners and instructors. The authors observed that all LADs incorporated interface-level descriptive analytics, usually in the form of graphical displays depicting students’ own information and comparisons with others. Meanwhile, several studies incorporated predictive analytics elements into their LADs, such as predicted final grades, identifying student risk status, and sending personalized messages to at-risk students, which can better provide learners with actionable insights for learning.
An LAD’s effectiveness varies in specific situations, such as students’ needs, knowledge, skills, and how they perceive and use the LAD (Rets et al., 2021). For example, when using an LAD to support learning, students’ different levels of learning performance influenced their motivation, satisfaction, and specific learning behaviors (Kim et al., 2016).
Learners’ awareness and learning behaviors are related to the learning strategies they employ while learning. As higher education progressively moves to blended and online environments, students must adapt to newer technology and resources and are expected to develop and use self-regulatory skills to gain higher learning performance. Mastering self-regulated learning (SRL) profoundly and positively affects learning performance by helping students recognize their strengths and weaknesses in learning, setting, and revising their learning goals accordingly, and then working to achieve them (Zimmerman, 2002).
SRL requires heightened metacognition and the motivation to orient thoughts, emotions, and behaviors to attain goals (Tobias & Everson, 2009; Zimmerman, 1998, 2002). Research shows that SRL is positively associated with high learning performance (e.g., Khiat, 2019; Schunk, 1996). Through metacognition, students plan, monitor, evaluate, and reflect on their learning using relevant skills and strategies, which most LADs aim to support. We can gain useful insights by understanding how students with different learning performances use LADs and how their learning behaviors relate to their SRL strategies.
Here, we focus on the behavioral analysis of using LADs to support the learning of high- and low-performance students. We aim to examine the different use of LADs by students with different learning performance, and the relationships between students’ behaviors and learning strategies. This study contributed to the integration and development of multidiscipline in the educational context, including educational psychology, educational engineering, and information science. Advanced technology was used to understand students’ cognitive and metacognitive strategies at the behavioral level. It showed great potential for education since it can be replicated and easily integrated into traditional classrooms to support teaching and help instructors and students understand cognitive and metacognitive strategies that were difficult to observe in the traditional classroom.
Specifically, we seek to answer the following research questions:
RQ1: What types of learning behaviors of the three learning support systems (two LADs and a digital material reader) are frequently used by students of high- and low-performance groups?
RQ2: What are the differences in learning behaviors in- and out-of-class between high- and low-performance groups?
RQ3: What are the differences in behavioral patterns between high- and low-performance groups?
Literature Review
Self-Regulated Learning and Learning Performance
In SRL, students apply their cognitive learning strategies to specific tasks, monitor learning behaviors and progress regarding their learning goals, and reflect on learning effectiveness (Zimmerman, 2002). When students can monitor and reflect on the detailed learning processes, their motivation improves (Schunk, 1982; Zimmerman, 2002).
Many researchers have demonstrated the effectiveness of SRL on academic achievement. For example, learners with higher self-efficacy tend to display better self-judgment, discard inappropriate learning strategies more quickly when solving problems, and exhibit improved learning performance (Zimmerman, 1989). Moreover, learners with higher goal-setting skills tend to set specific and proximal goals for themselves and self-record their effectiveness in achieving them, showing superior learning performance (Zimmerman, 2002).
The existing literature suggested that SRL was related to students’ academic performance in various learning environments. However, students’ learning performance was found to be affected by different SRL strategies in different environments. In online learning, strategies related to resource management, including the use of time management and effort regulation strategies positively affected students’ learning performance. As the online learning environment is highly autonomous, these resource management strategies are important to learning performance as these strategies focus on effectively scheduling, planning, and self-managing study time while correctly allocating resources and effort despite potential distractions. In blended learning, students’ learning performance was predicted by a wider range of SRL strategies, such as elaboration, organization, and metacognition strategies, indicating that planning, monitoring, regulating, and higher-order learning strategies such as note-taking and summarizing are important for success in blended learners (Broadbent, 2017). In flipped lessons, students’ SRL improved academic performance by helping students monitor and evaluate their behaviors and self-reflection on their performance (Yoon et al., 2021). As an integrated concept, SRL promotes learning performance based on not only its sole elements but also via the interactive effects of several elements, such as that of self-efficacy (Yamada et al., 2017).
However, a meta-analysis study indicated that not all SRL strategies are effective on all students’ learning performance (Li et al., 2018). Students showed individual differences in SRL usage because of several factors, including cognitive development, learning abilities, and changing demands in the classroom (Paris & Paris, 2001).
In classroom settings, students tend to evaluate their abilities by comparing themselves with others (Dijkstra et al., 2008). Importantly, students prefer to make upward comparisons of their performances; that is, comparing with those who perform better than themselves. These upward comparisons help them realize which abilities they need to acquire and judge whether they can do as well as their chosen target (Boissicat et al., 2020), learn better strategies, and gain better scores (Dijkstra et al., 2008). In particular, when students stuck in their learning utilize useful resources and seek help from others, they actively engage in their learning (Goda et al., 2013). High-performers tended to use higher levels of cognitive strategies on their own. Meanwhile, low-performers need more help and information from others, which affects the cognitive and metacognitive strategies they employ (Chen, Inoue, et al., 2020). Therefore, to improve students’ SRL, individual differences in their learning abilities should be considered. Furthermore, we should identify the most effective strategies for different students in various learning environments.
Supporting SRL Through Learning Analytics Dashboard
Metacognitive strategies are highly ordered processes that monitor and coordinate basic or complex cognitive processes (Zimmerman, 2002). To develop and improve students’ metacognitive skills, we need to understand their metacognitive processes and strategies and recognize the advantages and challenges of these processes and strategies. Many studies have used the LA approach to collect and analyze learning logs to explore students’ cognitive and metacognitive learning behaviors. According to the 1st International Conference on Learning Analytics and Knowledge (2011), LA is “the measurement, collection, analysis, and reporting of data about learners and their contexts, for understanding and optimizing learning and the environments in which it occurs.” LA can realize the continuous and automatic collection of data in formal and informal learning environments without interfering with learners’ engagement or external instructors (Shimada et al., 2015; Yamada et al., 2016). Thus, the LA approach provides opportunities to see how learning design impacts not only outcomes but also learning processes (Ifenthaler et al., 2021). Although the LA approach has effectively explored the metacognitive-related or self-regulatory processes, effectively providing and displaying the information regarding the learning processes remains a challenge.
An LAD is a visualization technique that displays learning traces based on LA data to help learners monitor and reflect on their learning processes and progress toward learning goals (Verbert et al., 2014). This helps learners monitor their learning processes, including what they have been doing and should be doing based on their learning goals (Klerkx et al., 2017), which are important phases in SRL. Therefore, one critical aim of LADs is to help students monitor and regulate their learning processes and support their SRL, especially the metacognitive strategies (Bodily et al., 2018). Previous research has focused on the design and development of LAD, and the effects of its use in educational environments on improving instructors’ teaching and learners’ learning. While designing an effective LAD, one should consider learners’ needs and expectations, including statistical data information, recommendations for related learning contents, feedback and advice on how to improve and interpret the results, and more understandable and meaningful information in the LAD (Rets et al., 2021; Teasley, 2017). Effective feedback is critical to LAD’s success (Sedrakyan et al., 2020). It includes not only feedback based on learners’ performance indicators but also feedback that could help them monitor and reflect on their learning, such as feedback that is grounded in the regulatory mechanisms underlying learning processes and an awareness of the learning goals (Sedrakyan et al., 2020), or continuous feedback on interpreting the data presented (Teasley, 2017). Wang and Han (2021) developed an LAD based on process-oriented feedback in a higher education context. Their LAD provided visual and textual feedback for different learning activities, personalized learning suggestions, and enabled a better understanding of learners’ individual learning progress. Importantly, the authors demonstrated that their LAD helped improve learning effectiveness. Susnjak et al. (2022) analyzed recent LADs for their ability to provide actionable insights using a literature review and proposed an LAD that addressed many of the shortcomings. Their LAD proposed integrated descriptive, predictive, and data-driven prescriptive analytics into one display.
Most LADs aim to improve the quality of the learning experience and thereby maximize learners’ academic performance. Some have shown that LADs effectively support online learning in higher education by visualizing students’ behaviors on the LADs (Bodily et al., 2018; Kim et al., 2016). However, we still do not clearly understand whether any effects can be attributed to the dashboards or other human-related factors, such as learners’ abilities and how they use the LADs. Kim et al. (2016) found that among learners who frequently used the LAD, high-performers were less satisfied with the LAD. Notably, low-performers did not know their learning status and tended to be easily motivated by the LAD; meanwhile, high-performers were strongly motivated by their own goal set up, which were related to the SRL strategy use. Therefore, one should consider learner-related factors, such as academic performance levels, when examining the effect of LAD.
Research Methods
Study Context and Participants
This study was conducted in an education course at a Japanese university. A total of 88 undergraduate students (86 freshmen and 2 sophomores) enrolled in the course. The course was conducted over a 7-week period, with a 90-minute lecture per week.
The course aimed to understand the social systems and institutions, media, areas, ideas, cultures, and histories in contemporary educational studies using academic language and perspectives. During the course, students studied basic knowledge, theoretical background, and challenges in modern education and discussed related topics with other students. The course followed a blended learning design, and students were required to bring their laptops to the class. First, students were required to preview the e-learning materials before attending a weekly face-to-face lecture. During the face-to-face lecture, the teacher first explained the contents of the learning materials, and then students were required to discuss a related topic. The discussion was conducted through an online chat system. Students were randomly distributed into groups weekly, with four to five students per group. After each lecture, students were required to submit a minutes-paper as their weekly assignment, which included the main contents of the lecture, reflection on the lecture, and implementation of the learning schedule. At the end of the course, students were required to submit a final report. Due to missing data and student absence, final data were collected from 54 participants.
Systems Used in the Course
Three systems were used during the whole course: the BookRoll (BR), ReadingPath (RP), and MAI Helper (MH). BR is a digital material reader used to store and distribute learning materials. Students can use functional tools on the BR system while reading, such as highlighting content, and adding memos and bookmarks within the materials (Ogata et al., 2017). Figure 1 depicts the BR interface.

Interface of the BookRoll.
RP and MH are the two LADs used to support students’ SRL and time management activities. RP aims to support students’ social comparison of learning status by providing information about how they read learning materials on the BR system (Chen, Lu, et al., 2020, 2021; Lu et al., 2020). Specifically, it visualizes the reading path of the learning materials, including the path between two pages within one learning material, the time spent on reading each page, and whether markers and memos were added to each page. When students click a page node, a detailed view of the page is presented, including the specific numbers of markers and memos and the average time spent on that page. Students can compare their information with that of the class and evaluate how they read the learning materials. The RP interface is shown in Figure 2.

Interface of the ReadingPath.
MH aims to support students’ time management in their SRL strategies and helps them manage their schedules and add reflections. In addition, it provides heatmaps that visualize the access information of the student and their class related to each learning support system (BR and LADs). This can help students understand their own and others’ learning status. The MH interface is shown in Figure 3.

Interface of the MAIHelper.
Students were required to use BR before, during, and after each lecture (preview, learn, and review the learning materials) as the main learning support system. Students could use RP to check the information about how they and the class read learning materials through the BR, while they could use MH to check the access information of the three systems during all learning activities. Finally, students were required to submit their weekly minutes-paper after each lecture through the MH. All activities of students on the three systems were collected and analyzed to represent students’ cognitive and metacognitive learning behaviors during the whole course. The procedure of the course and the three systems used to support each phase are shown in Figure 4.

Course procedure supported by the three systems.
Data Collection
Two types of data were analyzed: learning logs and learning performance scores. First, learning logs included all operations performed by students on the three systems. The learning logs on BR represent students’ cognitive behaviors of reading learning materials, those on RP represent students’ metacognitive learning behaviors of monitoring their reading behaviors, and those on MH represent students’ time management and reflection behaviors. We initially collected 40 types of learning logs on the three systems (in Table 1). During the analysis process, some learning logs were excluded based on the following criteria: First, logs with an average below 1 were excluded because these behaviors were considered rarely used during the course. Second, logs related to the open and close functions (BR_Open, BR_Close, MH_login, and RP_Open) were excluded because when students opened the system, the default page was shown, which was not relevant. Therefore, the behaviors after opening were considered the start of their learning activities. After the exclusions, 20 types of learning logs were considered in the data analysis process (marked with * in Table 1).
Learning Logs Used in the Study.

Denotes logs that were actually analyzed.
Metaboard is an LAD platform that visualizes the logs of learning support systems, such as the BookRoll system. There are several LADs on the Metaboard, including RP and MH.
Second, learning performance scores were assessed and calculated from three resources: the discussion, weekly assignments, and final report. The contents of the discussion were assessed based on the coding scheme for social presence (Shea et al., 2010). The weekly assignment and final report were assessed based on the submission time and contents.
Data Analysis
This study aimed to identify how students with different levels of learning performance used LADs to support their learning in a university course. A total of 54 students were divided into different groups according to their learning performance scores. The students whose learning performance scores were in the top and bottom 25% (first and last quartiles, respectively) were classified into the high- and low-performance groups, respectively. Thus, each group had 14 students.
RQ1-RQ3 explore how students with different learning performances use LADs to support their learning. To answer RQ1, descriptive statistics were used to show the relatively frequent learning behaviors of high- and low-performance groups. To answer RQ2, the differences in learning behaviors on the 20 types of behaviors in- and out-of-class between high- and low-performance groups were examined using the Mann–Whitney U test. To answer RQ3, students’ learning behavior patterns in high- and low-performance groups were examined using lag sequential analysis. This study used the LA approach to understand students’ characteristics of using LADs, which provided implications for the design and use of LADs. Moreover, the experiment can be replicated when considering the utilization of LADs in the educational context.
Results
Distribution of Behavior Frequency of High- and Low-Performance Groups
We recorded the learning logs of the BR, RP, and MH to represent students’ cognitive and metacognitive learning behaviors during the whole course. Table 2 lists the frequency and percentage of each behavior in the high- and low-performance groups. Note that Heatmap pagedate change behavior was not presented since its frequency was zero in both groups.
Frequency and Percentage of Learning Behaviors in High- and Low-performance Groups.
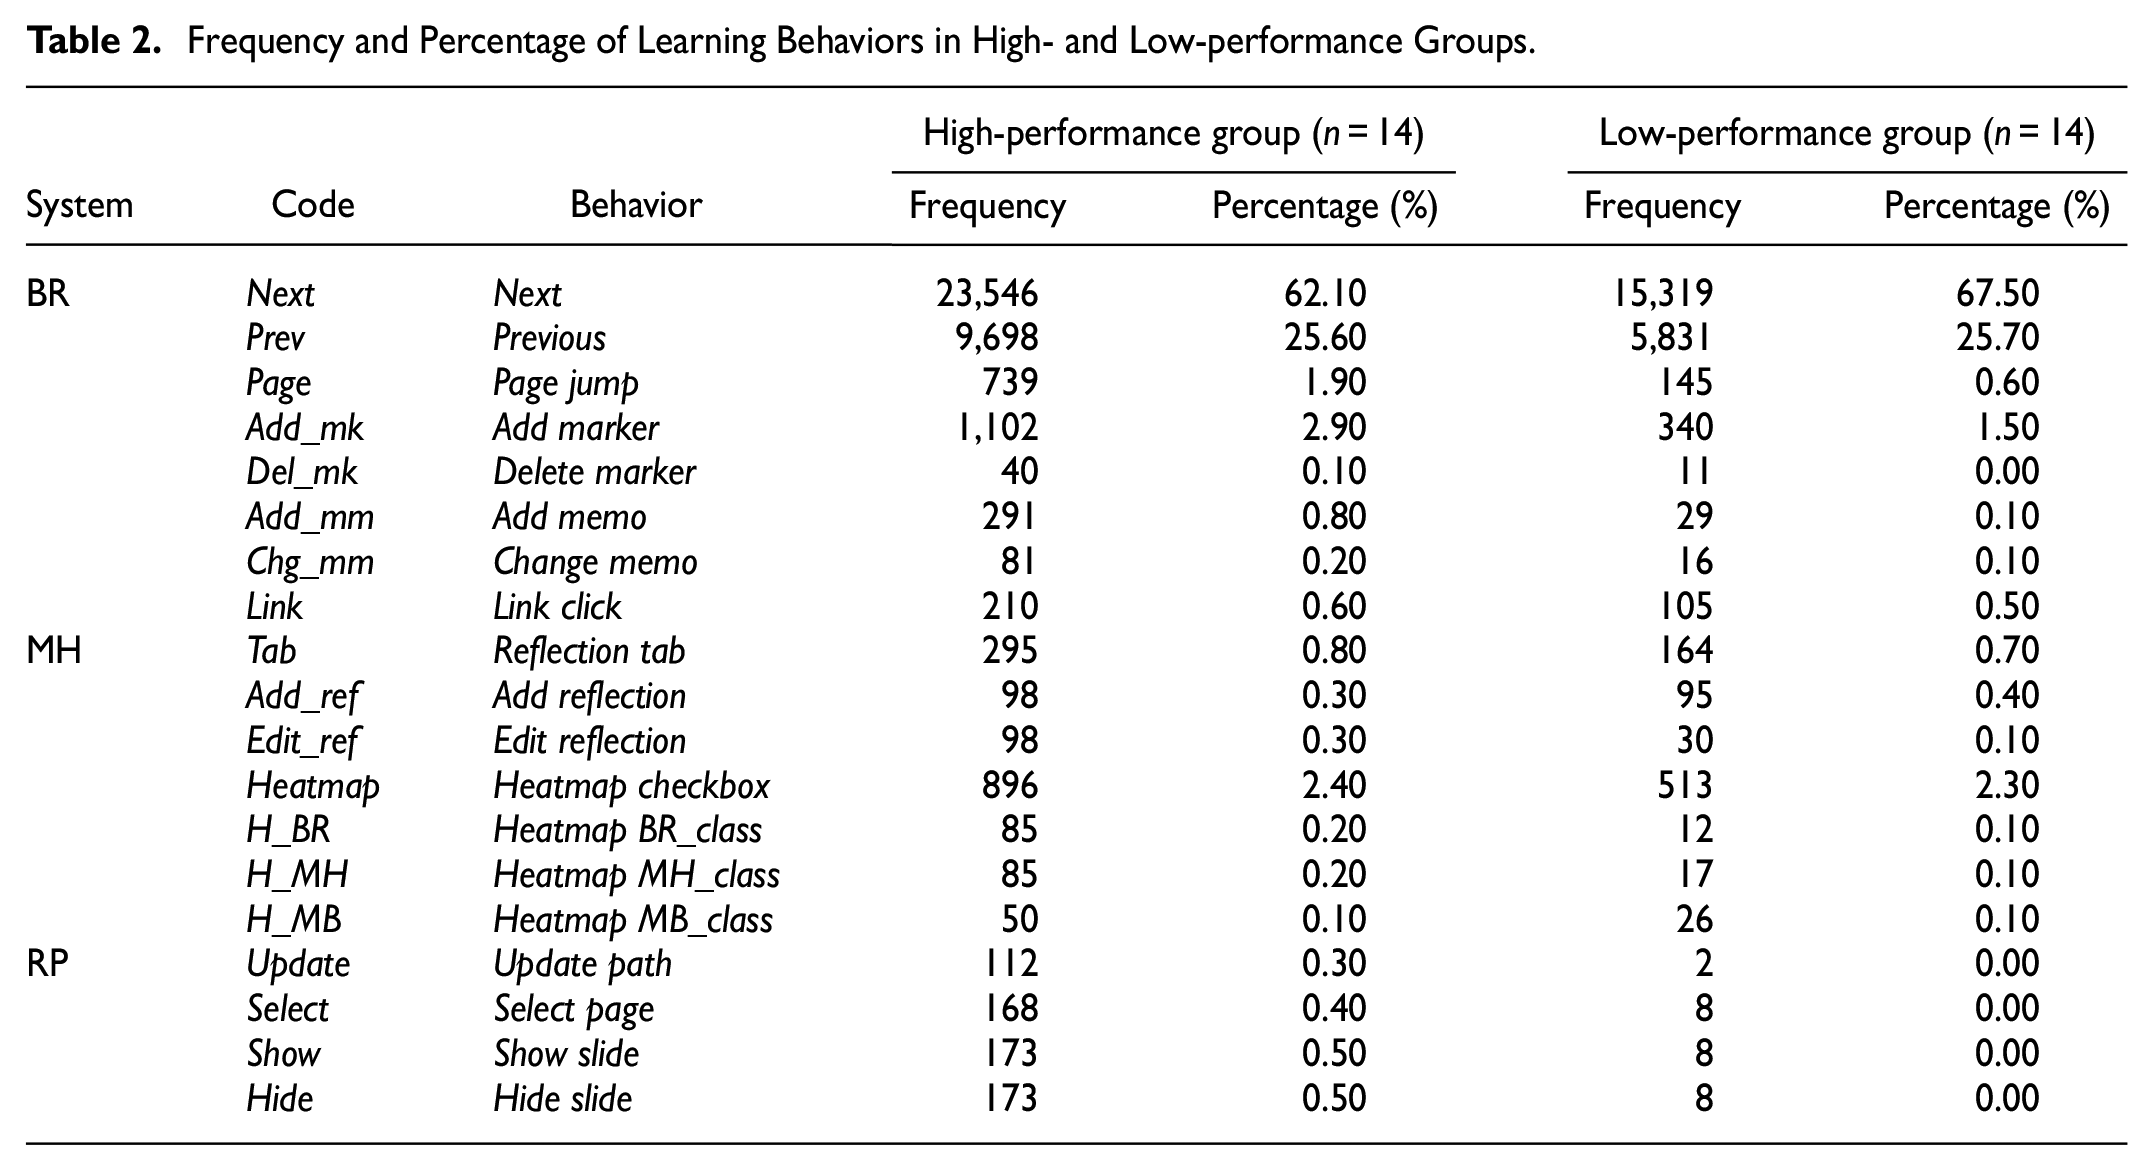
Next (62.10%) and Prev (25.60%) were the two most frequent behaviors in both groups, followed by Add_mk (2.90%) and Heatmap (2.40%) in the high-performance group, and Heatmap (2.30%) in the low-performance group. The frequencies of other behaviors were below 2%.
Only 17 students used the RP to monitor their learning during the whole course, including five high-performers and one low-performer. Therefore, the frequency of each behavior on the RP accounted for a small percentage.
Learning Behaviors In- and Out-of-Class of High- and Low-Performance Groups
Students used BR more frequently than RP and MH in both groups. In this study, BR was used as the main learning support system to support reading learning materials, the RP dashboard was used mainly during the three preview phases, and the MH dashboard was used mainly during the review phase. Considering the different roles of these systems in different learning phases, we need to understand how the in- and out-of-class behaviors differed between high- and low-performers.
Mann-Whitney U test was used to assess these and the results are shown in Table 3. Notably, in-class, no learning behavior differs between the two groups. Meanwhile, out-of-class, the high-performers conducted some types of behaviors on the BR and MH more frequently than low-performers. Specifically, high-performers more frequently conducted the following behaviors on the BR Next (Z = 2.665, p < .01), Add_mk (Z = 3.534, p < .001), Del_mk (Z = 3.780, p < .001), and Link (Z = 3.762, p < .001). Next, they conducted the following behaviors on the MH more frequently: Tab (Z = 2.973, p < .01), Heatmap (Z = 3.045, p < .01), and H_MH (Z = 2.379, p < .05). Interestingly, the behaviors of the two groups on the RP did not differ.
Differences in Out-of-Class Behaviors Between High- and Low-Performers.

Note. Behaviors which are significantly different are in bold.
p < .05. **p < .01. ***p < .001.
The aforementioned results indicate that during the preview and review phases, students with higher learning performance used the marker function, clicked the provided links on the BR, and used reflection and heatmap functions on the MH more frequently than those with lower learning performance. However, we still do not understand what students did before and after these behaviors. Next, to see their aims of using the specific functions, we investigated the sequence or process of how students conducted these learning behaviors.
Behavioral Patterns of Using LADs to Support Learning
To explore the learning behavioral patterns of using the BR and two LADs (RP and MH) during the course, lag sequential analysis was conducted to show the significant sequential relationship between the two analyzed behaviors. This method is used for assessing patterns in sequences of codes. The results were analyzed by using LagSequential R package.
First, the frequency and percentage of coded 20 types of learning behaviors were calculated (presented in Table 2). Second, the adjusted residuals were calculated, and a value of 1.96 or higher was considered a significant sequence at the 5% level of significance (Bakeman & Gottman, 1997). Finally, behavioral transaction diagrams were drawn based on the z-scores. Using this, the learning behavioral patterns of the high- and low-performance groups were analyzed and identified.
The adjusted residual tables for the two groups are presented in Tables 4 and 5, respectively. The behavioral diagrams of the high- and low-performance groups are shown in Figures 5 and 6, respectively, which were produced based on the z-scores indicating significant sequences. Notably, 60 and 53 significant behavioral transformation sequences were observed in the high- and low-performance groups, respectively (p < .05). The arrows represent the direction of the transformation, while the numbers on the arrows represent the adjusted residuals.
Adjusted Residuals for the High-performance Group Students’ Behaviors.

Adjusted Residuals for the Low-performance Group Students’ Behaviors.


Behavioral transition diagram for the high-performers.

Behavioral transition diagram for the low-performers.
Next, we analyzed the behavioral transition diagram of the high- and low-performance groups, and identified the common and different behavioral patterns between the two groups. Considering the roles of the three systems, the results are discussed based on the three systems in different learning phases and the interactive use among these systems: (1) RP for supporting the preview activities, (2) MH for supporting the review activities, and (3) BR for supporting the cognitive activities during whole phases.
RP for Supporting the Preview Activities
Here, we present the behavioral sequence of only using the RP, and the interactive use between the RP and the other two systems (behavioral sequence start from the RP). The RP was designed and developed for students to support their preview work, such as monitoring the information about reading learning materials and comparing the information with others in advance. In the RP, using Update means students update the interface to view the overall path after selecting the specific learning material, considered the first step of using the RP.
Figures 5 and 6 show that both groups showed similar behavioral sequences in using RP. Specifically, three main cycles of three behavioral transitions were observed for both groups: Update→Select→Hide→Update (
Regarding the differences in behavioral sequences between the two groups, high-performers showed some significant behavioral sequences between the interactive use of BR and MH, but no behavioral transition from RP to the other two systems. The observed sequences were Update→Update (
MH for Supporting the Review Activities
The MH was designed for students to manage their schedules before the lectures, and add reflections during and after the lectures. However, in this course, students were only required to submit reflections after each lecture, and the schedule function was rarely used. Therefore, we considered that MH mainly supported students’ review work.
Two main functions, heatmap and reflection, were used. The following common behavioral sequences were observed in both groups: Heatmap→Heatmap (
Among these results,
In addition, the cycles Tab→Heatmap→H_MH→Tab (
Regarding the differences in behavioral sequence between the two groups, the high-performers first showed Tab→Update (
Two sequences, Tab→H_MH and Add_ref→H_MH, were observed for low-performers, which constituted the cycles Tab→H_MH→Heatmap→Tab (
Further, low-performers exhibited the following interactive uses between MH and the other two systems: Tab→Page (
BR for Supporting the Cognitive Activities During Whole Phases
BR was used to distribute all learning materials in this course. Students read the learning materials using three functional tools: marker, memo, and link. They were required to preview the learning materials before the course and access the learning materials during and after the course if necessary. Therefore, BR supported students’ learning during all learning phases.
The following behavioral sequences were observed for both groups: Next→Next (
Regarding the differences between the two groups, only high-performers exhibited the following sequences: Add_mm→Add_mk (
The low-performers showed greater interactive use between BR and MH via the following sequences: Tab→Page_jump (
Discussion
RQ1: What Types of Learning Behaviors of the Three Learning Support Systems Are Frequently Used by High- and Low-Performance Groups?
Regarding the frequency and percentage of each behavior, Next and Prev were the two most frequent behaviors in both groups, followed by Add_mk and Heatmap in the high-performance group, and Heatmap in the low-performance group.
Compared to other functional tools (such as marker and memo), Next and Prev were the simpler operations of reading learning materials in BR. Similarly, compared to the reflection function, heatmap required students’ less time and effort in MH. Thus, it was used more frequently. Simply viewing the information was the most frequently used function in the learning support systems.
RQ2: What Are the Differences in Learning Behaviors In- and Out-of-Class Between High- and Low-Performance Groups?
In-class, no learning behavior differed between the two groups. Meanwhile, the following differences were observed out-of-class. First, regarding BR-related behaviors, besides simply reading the contents, marker and link were the two more frequently used functions by high-performers. Compared to simply reading and memorizing content, highlighting the content is more effective in promoting comprehension and learning performance by helping students decide what to focus on (Yue et al., 2015) or in finding the required information from a large amount of information (Chen et al., 2019). In this course, students were required to add markers on the contents that they considered important (red markers) or did not understand (yellow markers) and then delete old markers when they reviewed the contents. Therefore, the behaviors of adding and deleting markers indicated that students had conducted cognitive and metacognitive strategies, including understanding and reflecting on the contents. Importantly, we found that compared to students with lower learning performance, those with higher learning performance tended to conduct more cognitive and metacognitive strategies (e.g., highlighting the contents and reflecting). It is consistent with the result that sufficient knowledge helps learners select and construct appropriate learning strategies for learning (Dinsmore et al., 2014; Simonsmeier, 2022).
Another BR function, the link, was also more frequently used by high-performers. Links were provided by the instructor within the learning materials, which included additional information related to the contents of the learning materials. Higher performers tended to view the additional information when reading the learning materials. With sufficient knowledge, learners can use their knowledge as a starting point to solve problems or to make connections to other related information (Land & Zembal-Saul, 2003); that is one possible reason for high-performers to look for additional information more frequently. Providing students with resources or references during their learning can help them be aware of what to do next (Roberts et al., 2017), and has been demonstrated to be effective in improving SRL awareness (Chen, Taniguchi, et al., 2020).
Regarding MH behaviors, Reflection tab, Heatmap checkbox, and Heatmap MH_class were more frequently performed by high-performers. When students clicked the reflection tab (Reflection tab), they could view the items they needed to submit and then add, edit, or delete the reflection contents. We found that high-performers clicked the reflection tab more frequently to view the items during the review work compared to low-performers.
Regarding the heatmap, high-performers viewed the heatmap of the MH more frequently than low-performers. Viewing the heatmap is the behavior of monitoring the use of learning time and is a time management strategies. By helping them monitor and pay more attention to their activities, heatmaps can help students submit their exercises earlier and gain more points (Auvinen et al., 2015).
Students monitored their own learning duration and that of the class through the heatmaps, which can help them understand their current state and schedule future plans. Through reflection, students could reflect on their specific learning schedules, what they have learned, and their learning strategies. This can help them judge whether their learning schedules and learning strategies are reasonable and effective. Thus, students with higher learning performance utilized more cognitive and metacognitive strategies, including having a general grasp of what to reflect on and monitoring others’ learning time.
RQ3: What Are the Differences in Behavioral Patterns Between High- and Low-Performance Groups?
RP for Supporting the Preview Activities
Regarding the behavioral sequence of using the RP, three cycles (Update cycle, and Select cycles 1 and 2) were observed in both groups. These three cycles represent the operations of checking the reading paths of several or specific learning materials. RP’s main role is to support students’ metacognition by monitoring and comparing their own and others’ learning situations (Chen, Lu, et al., 2020, 2021). Self-monitoring helps students better recognize their strengths or limitations in learning and then regulate their learning behaviors and strategies during the next phase (Hofer et al., 1998; Winne & Stockley, 1998). When students assess themselves as better performers, they can be encouraged to set higher standards and learn useful learning strategies. This can help them improve performance (Dijkstra et al., 2008; Boissicat et al., 2020). Even if they compare themselves with peers of similar levels, they can get supplementary information that can be used in other ways, such as protecting their self-image and enhancing their sense of competence (Boissicat et al., 2020). In this regard, the different types of social comparison can affect students’ choice of different learning strategies, such as adjusting their learning pace based on their learning abilities compared with others or reviewing additional important materials (Hofer et al., 1998; Thiede et al., 2009). Together, this can help improve their learning performance.
Regarding the different behavioral sequences between the high- and low-performance groups, high-performers showed more significant behavioral sequences between the interactive use of RP and MH, while low-performers showed more significant behavioral sequences of using the RP independently.
Compared with low-performers, high-performers showed more sequences between using the RP to view the reading path and the Heatmap function on MH. This demonstrated that when high-performers tried to monitor their learning situation, they viewed the reading paths of specific learning materials and checked the time of using each learning support system. This seems related to a useful time-saving strategy: scheduling time to facilitate learning and applying new strategies (Oyarzun et al., 2020), especially based on continuous reflection (Baran et al., 2011). Research shows that time management skills and strategies positively affect learning performance (Claessens et al., 2007). Short-range planning in higher education seems to predict academic grades rather than long-range planning. This is because the higher education environment is one in which changes in expectations and demands fluctuate and is less stable (Britton & Tesser, 1991). Therefore, a short-term planning skill is more optimal to gain higher learning performance in higher education. The two LADS, the RP and the MH, help students remain aware of their learning schedules in the forethought phase and support their time management in the performance phase, which are important in SRL (Schumacher & Ifenthaler, 2018).
MH for Supporting the Review Activities
Regarding the behavioral sequences using the MH, several common behavioral sequences between the use of heatmap and reflection functions were found, indicating that students were using these two functions repeatedly. Continuous reflection can transform the understanding of processes related to online learning (Baran et al., 2011). In this study, students were required to write the reflections of each lecture. The instructor set the specific items for students with clear navigation to help them organize the contents of reflection. This can be related to effective pedagogical strategies for time management (Oyarzun et al., 2020). When students conducted reflections, they used the heatmap function to check the learning time using each system. The repeated use of the reflection and heatmap functions indicated the interactive use of time management strategies.
Regarding the differences between the two groups, high-performers interactively used functions between MH and PR, while low-performers used those between BR and MH. When conducting reflections, high-performers tended to monitor their learning progress through time management and the learning plan. These are effective time management strategies (Oyarzun et al., 2020). Monitoring is primarily the transitional phase between planning and regulating. However, it should be conducted during the planning and regulation phases instead of separately (Belfiore & Hornyak, 1998). Therefore, the integrative use of the two LADs was considered to be effective while monitoring. By contrast, low-performers tended to read the specific contents of the learning materials again when they reviewed the learning. This indicates that lower performers focused more on the cognitive strategy rather than metacognitive strategy during the review phase. The effectiveness of SRL varies based on learners’ individual differences, including their cognitive development, changing learning demands, and explicit classroom instruction (Paris & Paris, 2001). Therefore, it is not sufficient to merely provide the LADs to the low-performers, but it is necessary to provide them with explicit instruction and support on how to use the LADs and SRL strategies.
BR for Supporting the Cognitive Activities During Whole Phases
Finally, regarding the behavioral sequences related to using BR, several common behavioral sequences between the use of functions, including changing pages, links, markers, and memos were found. This indicates that students were using these cognitive functions interactively. Students tended to read the contents repeatedly or use specific functional tools repeatedly, such as links, markers, and memos. Notably, students tended to delete or change a marker or memo after adding a new one. This suggests that students reviewed the contents and then changed their idea or understanding; this action is related to the metacognitive strategy (Chen et al., 2019).
Regarding the differences between the two groups, high-performers exhibited fewer sequences between the BR and MH than low-performers. Low-performers used the reflection functions on MH and cognitive tools on BR in conjunction, while high-performers put more effort into the cognitive processing of learning contents on BR.
For example, after students changed a memo on BR, high-performers tended to add a new one to write down their new understanding of the specific contents, while low-performers tended to add the reflection function on MH. Students were required to submit reflections as their weekly reports on the MH. Therefore, low-performers aimed to use the memo function to help them complete weekly reports, whereas high-performers concentrated on revising their understanding of the contents when using the memo function. In a previous study, it was found that effective use of the memo function required learners to spend a certain amount of time and effort (4–5 minutes on each slide page), rather than fast reading browsing (less than 4 minutes) or long-term page stays (more than 5 minutes), and this cognitive process could enhance students self-efficacy, and eventually improve their learning performance (Yamada et al., 2017). It is understandable since reading comprehension requires a complex process of input information, including word recognition and knowledge integration (Van Gelderen et al., 2007). Using a memo tool helps students comprehend the learning contents and make sense of clear and unclear contents of the learning materials. Therefore, compared to using memos to complete the reports, spending more time and effort on understanding and revising the contents is more effective.
The only sequence between the BR and MH of high-performers is the sequence of using the link function on BR to add reflection on MH. As we discussed in RQ2, the link function, which aimed to provide students with additional information, was used more frequently by high-performers. High-performers were more likely to connect the different information when solving problems or constructing knowledge (Roberts et al., 2017). Therefore, one strategy of high-performers to submit reflections as their weekly report is to use the additional information through the link function. From the results above, it is indicated that high-performers concentrated on cognitive understanding when reading learning materials, while low-performers paid more attention to completing the reports.
Conclusion and Limitations
We examined how students with different levels of learning performance use LADs in a higher education setting. Specifically, we provided students with two LADs to support their metacognition and time management strategies during learning. The LADs (RP and MH) visualized their operations of the LADs and a digital learning material reader (BR). We then explored the learning behaviors of using RP, MH, and BR of students with different levels of learning performance. First, we found that simple behaviors, such as changing the pages of the learning materials and viewing the heatmap to monitor the learning time, were relatively frequent behaviors in both learning performance groups. Second, compared to low-performers, high-performers used the marker function, clicked the provided links on BR, and used the reflection and heatmap functions on the MH more frequently during their preview and review phases. Third, high-performers exhibited more behavioral sequences related to monitoring and reflection strategies during preview and review phases, while low-performers focused more on the contents of the learning materials when reflecting during the review phase.
Importantly, this study provides crucial practical evidence on LAD design and vital implications for using LADs to support student learning in higher education. First, considering students’ common habit of using simple functions in the learning support systems, functions requiring more effort, such as reflection, should be simplified. Alternatively, we can connect these higher-order cognitive strategies with simple functions. Second, we find that students benefit more from LADs during out-of-class than in-class learning, especially those with higher learning performance. Thus, instruction designers can integrate more metacognitive activities into in-class learning, such as providing additional resources, establishing clear and specific expectations (e.g., to-do list, rubrics), using more collaboration tools (e.g., chat features, Google Drive) to help students share their knowledge, and providing feedback on students’ preview work.
Finally, this study has some limitations. First, our sample size is small and the experiment’s duration was short, which may limit the generalizability of our study. This study focused on providing direction to integrate the LADs into the classrooms and clarify the learning processes through the LA approach during the current phase. Future studies should increase the sample size and expand the experimental duration to gain a more generalizable conclusion. Second, the two LADs and digital learning management readers were provided separately, which limited the interactive use of the three systems. Besides revising and improving the functions of the LADs, future research should consider integrating the two LADs.
Footnotes
Acknowledgements
We would like to acknowledge the students who participated in this study.
Declaration of Conflicting Interests
The author(s) declared the following potential conflicts of interest with respect to the research, authorship, and/or publication of this article: Drs. Yamada, Lu, and Shimada receive the research Grant from JSPS, and Dr. Shimada and Mr. Geng receive the research grand from The Japan Science and Technology Agency (JST).
Funding
The author(s) disclosed receipt of the following financial support for the research, authorship, and/or publication of this article: This study was supported by Japan Society for the Promotion of Science (JSPS) [grant number 21KK0184, 21K18134, 22H00552].
Note
This research was conducted while Dr. Yamada was at Faculty of Arts and Science, Kyushu University. He is now at Data-Driven Innovation Initiative, Kyushu University.