
Abstract
In a concert auditorium, conditions at different seats vary greatly, and are mostly affected by the view of the stage and the received sound of the performance, the former of which has been much less studied. With a focus on visual seat location, this study systematically investigates the effects of three visual factors: distance, lateral angle, and vertical angle, on the subjective seat preference of a symphony music performance, with one additional reference auditory factor: loudness (audio gain). Experimental investigation used virtual reality presentations of a 3D static orchestra on a stage with simplified orchestral audio, so that each factor could be changed independently. Results show that all factors significantly affect preference: smaller distances, smaller lateral angles, and vertical angles around 18° are preferred. Experiment results agree with those of an online questionnaire using corresponding stage-view images. A prediction model based on the results is proposed.
Introduction
A concert hall is usually judged by its acoustics and architectural appearance. However, the variation in auditory and visual conditions at different seat locations within one concert hall may be even larger than the variation between equivalent seats of different concert halls. Each audience member only experiences a given concert at a single seat location. Therefore, it should be an important goal for auditorium design to have as many seats with good visual and auditory conditions as possible, avoiding seat locations with unacceptably poor visual and auditory conditions. This introduces the need for evidence-based prediction methods for the quality of seat locations.
Compared to auditory preference, visual preference in auditoria has been much less studied, but is nevertheless important for the overall enjoyment of a concert. This study aims to fill this gap, by experimentally investigating the relationship between subjective preference and three of the most apparent stage-view factors that differ between different seats in an auditorium: distance to stage, vertical angle from stage level, and horizontal angle from the mid-plane of symmetry. While the main focus of this study is on the visual factors, one auditory factor that was already known to influence preference, listening level, is included for reference, to enable quantitative connection between visual and auditory effects. The use of virtual reality made it possible for each factor to change independently and orthogonally without the limitation of real concert hall seating plans, and thus the individual effect of each single factor could be studied.
Preference at Different Seats in an Auditorium
The earliest seat preference theories are mostly based on professional experience of their authors (Burris-Meyer & Cole, 1964; Veneklasen, 1975). While the quantitative information in such theories was not proven by empirical testing and might include personal bias, it stems from extensive practical experience of auditoria, providing insights and directional guidance for subsequent studies.
Most later seat preference studies are based on empirical experiments conducted in laboratories with simulated stimuli (Ando, 1983; Jeon et al., 2005, 2008; Kuusinen & Lokki, 2015; Sato et al., 2012, 2013). This is arguably the most popular method in seat preference studies, and also the method used in the current study. The recreated stimuli may differ from real situations in ways dependent on the method, and these experiments usually only include a small test sample. However, the researchers could have high levels of control over the stimuli and variables, and participants could experience and compare between different stimuli. Apart from the study by Ando (1983) which used orthogonal factor control for four auditory factors, the other studies were all based on certain selected seats in real auditoria, and thus the parameters were not independently varied. While Ando (1983, p. 198) and Kuusinen and Lokki (2015) used auditory stimuli only, Jeon et al. (2005, 2008) and Sato et al. (2012, p. 20, 2013) included visual stimuli. However, the visual stimuli were only presented as photographs which could not fully present the spatial information, and the auditory stimuli still had much greater accuracy, control, and realism.
In two questionnaire studies (X. Chen & Wu, 2013; Kawase, 2013) participants made their evaluation based on their own general experience, instead of evaluating specific stimuli. Questionnaires can usually cover a larger sample, but the information that can be obtained from questionnaires is more limited compared to laboratory experiments, and the results are greatly affected by individual experience and suppositions, rather than being directly related to perception.
An observational study by Vaupel (1998) used time-lapse photography to gather data on progressive seat selection as audience gradually enter and fill an auditorium before a concert while unaware of the study. Unlike laboratory experiments which could only test for a few selected seats, the observation covered the whole audience area, and constructed a prediction model for preference based on the order of selection. The results may be accurate for the auditoria used in the study, but were dependent on the specific situations, and the factors were also not independent.
The particular experiment settings and results of the abovementioned studies are summarized in Table 1.
Reference Summary of Seat Preference Studies in Auditoria.

Note.
1. Symbols used in results: ↑, positive trend within the given range; ↓, negative trend within the given range; max, optimal value; ×, no correlation within the given range; >, better than
2. For audio-visual experiments: V, visual stimuli only; A, auditory stimuli only,;C, combined.
Abbreviations: D: distance; L: lateral angle from center plane; V: vertical angle from stage plane; c-value: line-of-sight clearance height; LL/SPL: listening level/sound pressure level of auditory stimuli; Δt1: initial time delay gap, also commonly abbreviated as ITDG; Tsub: subsequent reverberation time; PD: distance to stage projected on center plane; SR: ratio of stage area to the whole visible area in the presented image; ΔSPL: difference in sound pressure level between solo and accompaniment; BIR: binaural room impulse response; SRIR: spatial room impulse response.
To summarize, most studies found a positive relationship between auditory preference and sound pressure level, so long as it did not exceed the optimal listening level of 79 dB(A) proposed by Ando (1983). Kuusinen and Lokki (2015) found a negative correlation between auditory preference and auditory perceived distance, which is usually also negatively correlated with sound level. Both (Jeon et al., 2008) and (Sato et al., 2012, 2013) found that for various seats in one auditorium, among all the common acoustic parameters, sound pressure level was the main factor affecting auditory preference, which may mask the effect of other non-orthogonal factors. Most studies agree that visual preference is negatively affected by the lateral angle from the center plane of the auditorium (Burris-Meyer & Cole, 1964; X. Chen & Wu, 2013; Jeon et al., 2008; Kawase, 2013; Vaupel, 1998; Veneklasen, 1975). However, the effect of vertical angle from the stage plane is more controversial (Jeon et al., 2008; Sato et al., 2012; Veneklasen, 1975), which may be due to the fact that vertical angle often varies with distance in real auditoria. Studies agree that the overall preference is affected by both auditory and visual preferences (Jeon et al., 2008; Sato et al., 2012, 2013).
Generally speaking, because of the traditional emphasis on acoustics in auditoria, seat preference studies in auditoria had developed much further for auditory preference than visual preference. Limited studies have used visual stimuli in the experiment, but their visual stimuli and analysis of visual preference was much more simplified than the auditory part. Furthermore, most of the existing seat preference studies were based on real auditoria, where seat locations were limited to the layout of particular halls, and the different predictors were not mutually independent. This may limit the generalizability of those studies’ prediction models.
Preference in Different Auditoria
Compared to preference at different seats in the one auditorium, preference between different auditoria has been studied much more extensively, especially in terms of acoustics.
When comparing between different auditoria, auditory preference was commonly found to be positively related to sound strength or loudness of the auditorium (Beranek, 1992; Y. Chen & Cabrera, 2021; Farina, 2001; Ryu & Jeon, 2008; Sotiropoulou et al., 1995), so long as it does not exceed the optimal listening level of around 79 dB(A) (Ando, 2010, 2014).
Reverberation parameters such as T30, T20, or EDT, and acoustic clarity parameters such as C80, D50, or Ts, are also found to affect auditory preference. Furthermore, because reverberation and clarity parameters usually change in opposition, they are believed to have optimal ranges for certain spaces (Ando, 2010, 2014; Bagenal & Wood, 1931; Farina, 2001; Knudsen, 1932; Kocher & Vigeant, 2015; Schroeder et al., 1974; Sotiropoulou et al., 1995; Soulodre & Bradley, 1995).
Various spatial parameters have been found to affect auditory spatial impression, which is important for auditory preference (Choisel & Wickelmaier, 2006, 2007; Kocher & Vigeant, 2015; Sotiropoulou et al., 1995), such as early lateral energy fraction (JLF or JLFC), an indicator for apparent source width (ASW; Barron, 1971; Barron & Marshall, 1981; Keet, 1968; Marshall & Barron, 2001), late lateral sound level (LJ), an indicator for listener envelopment (LEV; Bradley & Soulodre, 1995a, 1995b; Morimoto, 1989), and interaural cross-correlation coefficient (IACC; Ando, 1977, 1982, 2010, p. 20, 2014; Ando & Gottlob, 1979; Hidaka et al., 1992, 1995; Okano et al., 1998; Schroeder et al., 1974).
There are also other factors that have been found to affect auditory preference, such as spectral attributes (Beranek, 1992; Choisel & Wickelmaier, 2007; Hawkes & Douglas, 1971; Hidaka & Beranek, 2000; Soulodre & Bradley, 1995), or inter-subjective differences (Ando, 1998; Barron, 1988; Lokki et al., 2012).
Visual preference, on the other hand, has not been studied as thoroughly as auditory preference. It is commonly believed that visual obstruction affects visual preference negatively, and the visual obstruction between audience members is largely dependent on the rake of the seats, which is determined by the c-value (line-of-sight clearance height; John et al., 2007; Russell, 1838; Sheard, 2001). Auditorium interior color was found to influence visual preference (Y. Chen & Cabrera, 2021), and the effect was related to the commonness of the color in existing auditoria.
Research Objectives
From the above summarized state-of-the-art research background, it can be seen that subjective preference for different seat locations within the same auditorium, especially visual preference, has been much less studied in comparison to other aspects of auditorium research, but potentially contributes greatly to the overall experience of concert appreciation. In particular, distance, lateral angle, vertical angle, and loudness have all been identified as significantly correlated to seat preference in certain studies. However, because most previous studies are case studies of specific auditoria, and these factors covary in real auditoria and cannot be independently controlled, the results may not be applicable to other auditoria beyond the case studies. The effect of each factor, their relationships and interactions have yet to be studied in a controlled context.
Therefore, this study aims to address this gap in the literature, by investigating the effect of seat location by individually controlling distance, lateral angle, vertical angle, and audio gain, using subjective preference evaluation in virtual-reality environment. It is the first to quantify the effect of view on seat preference using orthogonal methods instead of specific case studies, along with a prediction model that may be applicable to various music auditoria. With virtual-reality testing method, it is possible to produce visual stimuli with spatial information (compared to photographs), and to control the parameters individually (compared to in situ). This study also innovates on the experiment method, by using virtual-reality with online volunteer recruitment to adapt to the situation of COVID-19 pandemic.
Materials and Methods
Materials
The experiment used head-mounted virtual reality display for visual stimuli, with headphones for auditory stimuli.
A model of a 98-piece symphony orchestra with a stage space 15 m wide × 11 m deep × 6 m high was built in Rhinoceros (McNeel & Associates, 2019) 3D modeling software, then exported to and rendered in Unity Technologies (2019) virtual reality software (Figure 1). The stage size with an area of 165 m2 was chosen to represent a classical symphony concert hall stage, being close to the stage size of Wiener Musikverein (163 m2), Amsterdam Royal Concertgebouw (160 m2), and Boston Symphony Hall (152 m2; Beranek, 2012). In order to exclude the influence of other visual factors and the limitation of a seating plan, no auditorium model was used. Apart from the stage, the rest of the camera view was rendered black.
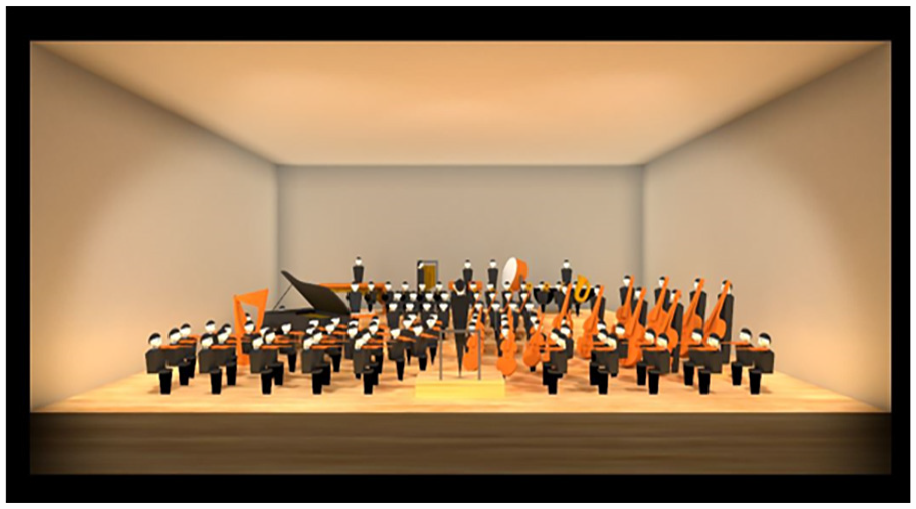
Model of orchestra with stage in 2D.
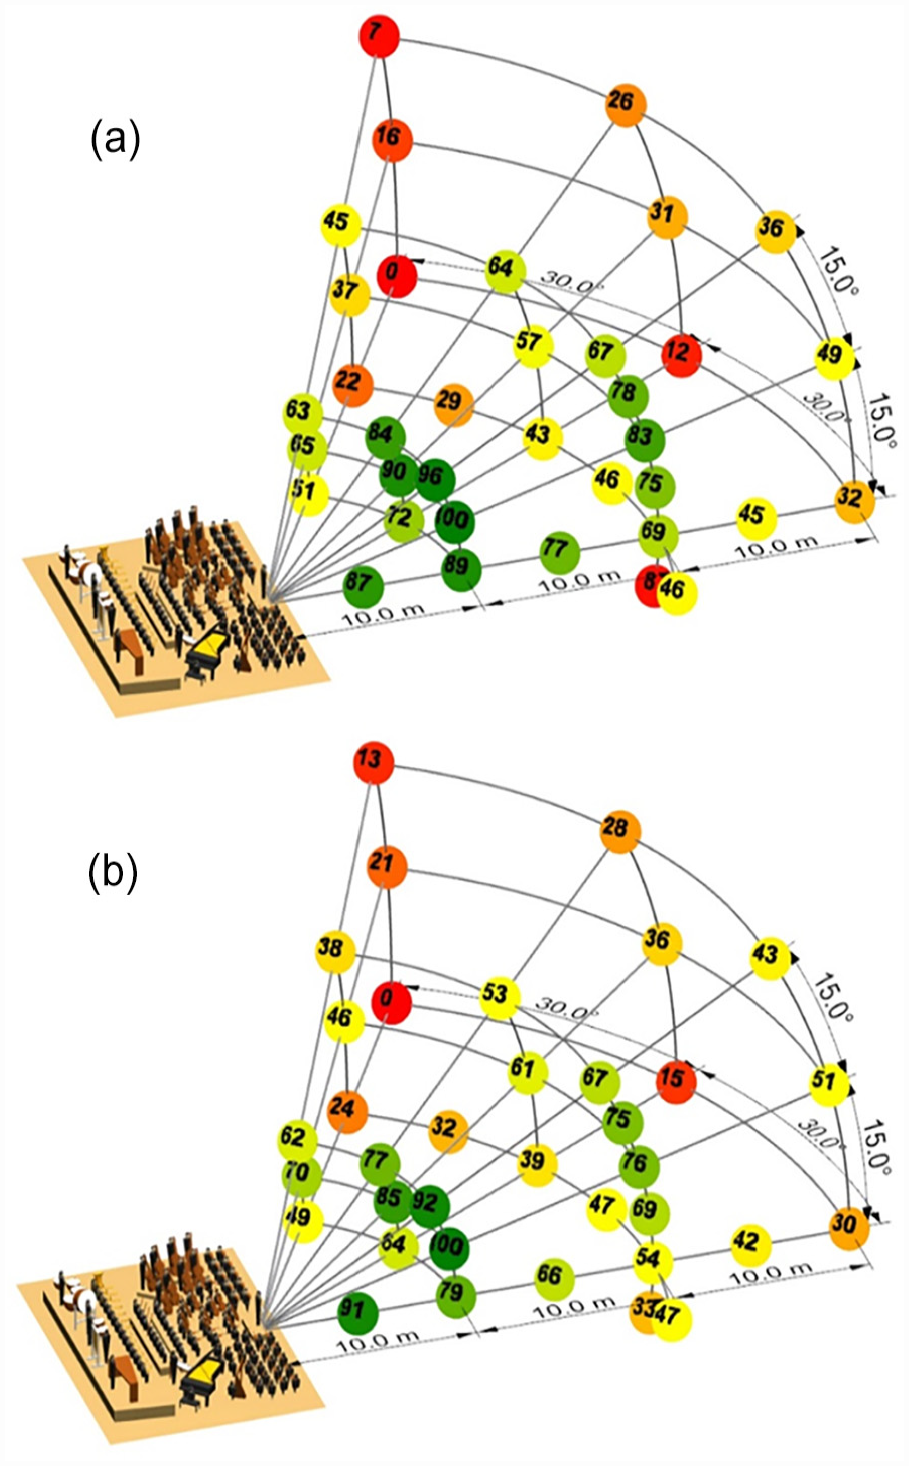
Thirty-six locations were chosen for the experiment (Table 2). The point of focus was set to be the location of the conductor, at the height of seated eye level above stage. In order to examine the individual effect of each factor, an orthogonal 27-point grid of three levels of distance (10 m, 20 m, and 30 m) × three levels of lateral angle from the center symmetric plane (0°, 30°, and 60°) × three levels of vertical angle from the horizontal plane (0°, 15°, and 30°) were chosen (points 1–27 in Table 2). On top of the main grid, nine additional points were added to increase precision and range (points 28–36 in Table 2).
Location Settings for the Experiment.

Example views at 12 of the 36 locations are given in Figure 2 (with the location numbers from Table 2). These are only the 2D screenshots with a 60° angle-of-view, but the participants saw the scenes in 3D in virtual reality.

Example views of 12 locations used in the experiment, rendered as 2 days static images. The numbers correspond to the stimulus identifiers in Table 2.
With lateral angle, even though lateral bias toward the right side has been observed for many human behaviors, including seat selection in cinemas (Harms et al., 2014; Karev, 2000), no obvious lateral bias was found in the seat selection studies mentioned above apart from piano solo performance (Kawase, 2013; Vaupel, 1998), and therefore it can be assumed that the effect of lateral bias is relatively small compared to the effect of differences in auditory and visual stimuli, and the left and right side of center line can be considered symmetric. Hence, to limit the total experiment time of each participant, only locations on the right side of the center line facing stage were used, apart location 31 which is the symmetric location of location 32 (Table 2).
The music used for the experiment are recordings from the 2018 Weiner Philharmoniker New Year’s Concert conducted by Vienna Philharmonic and Muti (2018), with four pieces excluded because of their popularity (No. 6, 18, 19, and 20). Viennese classical music was chosen because of the relatively constant style, dynamics, and tempo. The two-channel stereophonic recordings were mixed down to a single channel, preserving the original reverberation time.
The music was played back in Unity, with binaural panning using Steam Audio (Valve Corporation, 2017). The audio played through the headphones included 70% of fixed stereo playback (exactly same audio in both ears independent of location and head rotation), and 30% of 3D source localization to match the visual position of the orchestra relative to the listener. The center of the source was set to the relative direction of the conductor to the listener (the same location that was used to calculate the visual factors), with a spread angle of 10°. The audio was designed to be as simple and non-varying as possible to avoid introducing any new variables (e.g., direct-to-reverberant ratio, early decay time, or parameters associated with lateral reflections), but still matching the source direction of the visual orchestra. Because of the emphasis of the present study on visual factors, and the exclusion of any auditorium model, there was no attempt to simulate the acoustics of a particular auditorium (beyond that already in the recordings), nor to simulate the acoustic effect of particular positions in an auditorium. The only variation in audio rendering was head-compensated orientation direction (to the conductor) and simple gain change, the latter only deployed in the second part of the experiment.
Procedure
In consideration of COVID-19 social distancing regulations, the volunteer recruitment process was done online. Thirty-three volunteers aged over 18 years with access to VR equipment and headphones with no self-reported hearing or vision impairment participated in the experiment.
The experiment stimuli were distributed as an executable file and sent to the participants through email with necessary instructions. The participants ran the program in their own time with VR headsets and headphones. Each participant entered their given Participant ID at the start, and the experiment loaded accordingly. They were instructed to adjust the computer volume to their comfort level at the beginning, and not to alter the volume settings once the experiment began. For each location, they returned a score in the range 0 to 100 using VR controllers based on how much they liked the sound and the view. They started at a randomly assigned location, then they were able to use VR controllers to choose and jump to any of the 36 available locations. They could also view the scores they had already given to other locations, and return to a scored location if they wish to use it for reference or change previously assigned scores.
Participants could spend as much time as they wished, and it was also possible for them to save their progress and complete the experiment in separate time slots. They could make any changes before submitting the results. When they were satisfied with all of their scores, they exported the results into a file and sent it back to the researchers through email. The files record their Participant ID, the scores given for each location, and the total time spent at each location. Participants also filled in an information questionnaire with their age, gender, the brand, and model of the VR equipment and headphones they used, and any feedback if they wished.
There were two parts in the experiment, with the same locations and visual stimuli. The difference was that the audio was kept constant in the first part, while the second part involved different gains applied to the audio. In both parts, the 16 short music pieces were played consecutively in randomly generated orders, and the music continued between location changes. In the first part, the only change in audio between different locations was the 3D orientation corresponding to the relative visual orientation of the stage to the listener. In the second part, four levels of audio gain (0 dB (same as in the first part), −3, −6, and −9 dB) were randomly applied to the 36 locations (9 locations for each level).
The gain adjustment in the experiment was designed as an additional reference for the visual factors, to construct a quantitative connection between the effect of visual factors and auditory factors on subjective preference, because the effects of various acoustic parameters, including sound pressure level, have already been studied extensively in previous auditorium acoustics studies.
Participants
Thirty-three participants aged 19 to 48 years took part in the experiment, with an average age of 32. The participants comprised 25 males and 8 females. Of the VR headsets the participants used, 26 were HTC (including Vive and Vive Pro) and 7 were Oculus (including Rift S, Rift CV1, and Quest). Of the headphones used, 10 were built-in with the VR headsets (including both HTC and Oculus), and 23 were standalone headphones (including Sennheiser, Bose, Beats, and AKG). All of the headphones were over-ear types.
As listed in Table 1, the sample sizes of similar in-lab experiments range from 8 to 60, with an average of 25. Therefore, a sample size of 32 for each part of the experiment was used (explained in Section 2.4), and was justified by the power analysis for the regression model in Section 3.4.
The average time spent on parts 1 and 2 was 23 minutes (SD = 10.5) and 14 minutes (SD = 4.8) respectively. Even though the number of locations was the same for the two parts, usually participants needed more time at the beginning of the first part for familiarization. The recorded time only includes the actual time the participants spent on the scenes, and does not include the time they spent reading the instructions, communicating with the researchers, or resting halfway through the experiment. Because the experiment was conducted remotely and the researchers had less control compared to other similar studies in laboratories, more detailed analysis of experiment time regarding background information and relationship with result consistency was conducted and presented in Appendix B. Results show that the time each participant spent on the experiments does not affect the results’ validity, therefore no exclusion was made based on the experiment time.
Statistical Considerations and Analysis
The three visual factors included in the experiment were designed to be independent and orthogonal, with the same degrees of freedom. For the second part of the experiment, while the four levels of audio gain were randomly applied to the locations, in order to prevent the influence of the arrangements on the results, every four participants were counterbalanced, so that each location was paired with all of the four gain levels in each group of four participants. One participant completed the first part only, another participant completed the second part only, and the rest of the participants completed both parts. Therefore, there are 32 results for each part, forming 8 balanced groups in the second part. As a result, audio gain could also be considered orthogonal to all of the visual factors.
Mixed-effects models were used to account for the repeated-measures experimental design wherein each participant provided subjective scores for all locations, which was explicitly modeled as random effects. Further, robust mixed-effects models were used to reduce the influence of any outliers (Koller, 2016). Modeling independently varying slopes (i.e., random slopes) for each participant was also attempted. However, since the residuals of such models did not meet parametric assumptions, they are not reported here, that is, only random intercept models are reported in the following. Starting with an intercept-only GLM (generalized linear model) without random effects, mixed effects models were created in a stepwise manner, with the model at each step increasing in complexity in terms of the fixed effects (independent variables) and random effects. The statistical significance of each fixed and random effect was determined using goodness-of-fit comparisons between models without and with the effect. For the goodness-of-fit comparisons, the chi-square log-likelihood test and the Akaike information criteria (AIC) were used, where the AIC value with and without an effect of ≤2 was used as the criterion to determine whether including the effect improves the overall model fit (Burnham & Anderson, 2004). Instead of explicit modeling steps, only the final models are presented and discussed. For the fixed effects in these models, bootstrapped confidence intervals were calculated, which are robust against distributional assumptions of parametric statistics (Efron & Tibshirani, 1994). The effect size of fixed effects is presented as the f2 value (Aiken et al., 1991), which compares the conditional
Results
Test-Retest Reliability
Since each participant (except for two; section 2.4) scored certain locations in both parts of the experiment (i.e., those with audio gain of 0 dB; section 2.2), it is possible to assess the test-retest reliability of the experimental task based on the interclass correlation coefficient (ICC) for these repeated locations. This was done by fitting a mixed-effects model to compare the participants’ scores (dependent variable) across the two parts (fixed effect). The random effects due to the same participant scoring in both parts for a selection of locations were explicitly modeled as independently varying intercepts. The ICC of the resulting model was 0.5, which can be considered ‘fair to good/moderate’ based on common criteria across research disciplines, mostly involving clinical trials (Fleiss, 2011; Koo & Li, 2016). The moderate test-retest reliability is considered adequate due to the various sources of variability in the current design (e.g., headset types, etc.).
Relationships Between Objective Factors and Preference
In order to show the effect of each individual factor on preference, the mean and 95% confidence interval for each level of each factor are plotted in Figure 3 (black points and lines). For the three visual factors (Figure 3a–c), the round dots represent the levels in the 27-point main grid, for which all the combinations are experienced by all participants (each point = 9 locations × 32 participants); while the crosses represent the levels of the additional 9 points, for which only one location is experienced by each participant (each point = 1 location × 32 participants). For audio gain, the dot represents 0 dB gain level, which was used for all the points in the first part of the experiment and 1/4 of points in the second part of the experiment (36 locations × 32 participants + 9 locations × 4 participants × 8 groups); while the crosses represent the additional levels in the second part of the experiment (each point = 9 locations × 4 participants × 8 groups). The separate results of each part and both parts together are presented in different colors, and it is evident that the results for the visual factors are very similar in the two parts.

Subjective preference scores (mean and 95% confidence interval) and prediction equations plotted against each level of each factor. (a) Preference score versus distance to stage. (b) Preference score versus lateral angle. (c) Preference score versus vertical angle. (d) Preference score versus audio gain.
It can be seen that the effects of distance on preference follow a linear trend within the tested range, with the exception of the smallest distance (5 m) which has approximately the same mean as 10 m. The effects of lateral angle and vertical angle follow quadratic trends, and the effect of audio gain follows a linear trend.
For lateral angle, it can be seen that −15° and 15° have very similar scores, verifying the assumption that the effect of lateral angle is approximately symmetric, and thus the absolute values of the lateral angle can be used. When using the absolute values, the effect of lateral angle follows a linear trend. For vertical angle, it can be seen that the maximum is reached approximately between 15° and 22.5°.
Prediction Model

The equation above shows the mixed-effects regression model (
Mixed-effects Model Coefficients to Predict Subjective Preference in Relation to the Independent Variables (Fixed Effects) and Random Effects (see Section 3.4).

Note. For the fixed effects, intercept and slope estimates (effect size as described in section 2.4) are provided along with the bootstrapped 95% confidence intervals. All fixed effects are significant at p < 10−2. For the random effects (see section 3.4), the standard deviation along with the bootstrapped 95% confidence intervals are provided.
From the prediction equation, it can be seen that

Standardized preference scores plotted against predicted values with linear regression and 95% confidence interval. (a) Individual observations and (b) average and 95% confidence interval of all participants.
Visualization of Results
In order to view the effect of different visual factors more intuitively, the effect of the audio gain is subtracted from the results. Then, the average score for each location is scaled back to 0 to 100 to provide a more familiar score (the least liked location being 0 and the most liked location being 100), and presented at each location in Figure 5a. The scaled average scores are presented through the rendering color of spheres (color scale: red–yellow–green for 0–50–100) and number notations. Figure 5b shows the prediction results using the equations calculated in Section 3.3, similarly scaled to 0 to 100. From the comparison of the two figures, it can be seen that the prediction equation captured the observed results well.
Visualization of the preference score at each tested location (without the effect of audio gain) (a) average of observed subjective evaluation and (b) predicted value.
Discussion
Comparison to Previous Findings and Possible Explanations
The results indicate that smaller distance to stage, smaller lateral angle (closer to the symmetric centerline of the auditoria), a moderate vertical angle not too high and not too low (around 18°) and louder audio are preferred. Results generally agree with previous findings and help to explain some discrepancies between previous studies.
The preference for smaller distance is relatively easy to understand. Human eyes have limited resolution (Yanoff & Duker, 2004), and when the target is further away, it appears smaller, and therefore less details are visible. Many standards and recommendations specify maximum viewing distances for particular types of audience space (e.g., Burris-Meyer & Cole, 1964; John, Sheard, & Vickery, 2007). However, some previous studies found a polynomial correlation between distance and preference, and indicated optimal distances (Vaupel, 1998; Veneklasen, 1975), or found no linear correlation between distance and preference (Sato et al., 2013). This may be explained by the case-based nature of those studies. In usual auditorium seating arrangements especially with raked seating, distance to stage and vertical angle are positively correlated. In other words, the seats further away from the stage have larger vertical angles. Therefore, the polynomial or non-linear effect of distance found in previous studies may actually be reflecting the polynomial effect of vertical angle. On the other hand, this study found a potential drop in preference when distance gets closer than 10 m. This could be related to the fact that when sitting very close to the stage, the visual targets occupy a large range in the field-of-view, and therefore a viewer can no longer see the entire scene without head movements and potential fatigue. This will need to be verified in future studies.
The preference for smaller lateral angle is in accordance with most previous studies (Jeon et al., 2008; Kawase, 2013; Vaupel, 1998; Veneklasen, 1975). In the arrangement of orchestras, usually most musicians face toward the conductor’s location on the symmetric axis of the auditorium. When a person is sitting on or close to the symmetric axis in the audience, his/her view of stage is more symmetric and he/she can see more musicians’ front side with the instruments. This may be the explanation for the preference for proximity to the centerline.
The polynomial effect of vertical angle on preference is an important finding that helps explain discrepancies in previous results. While Jeon et al. (2008) and Sato et al. (2012) both found a negative effect, Veneklasen (1975) proposed a positive effect. The range of vertical angle in Veneklasen’s paper is from −20° to 20°, which mostly falls into the range of positive effect of the polynomial effect found in the current study. On the other hand, both Jeon and Sato’s experiments have a range of seats higher than the optimal angle where the effect becomes negative. However, as the vertical angle and distance in the case studies are also correlated, the effect of vertical angle therein may be confounded. When the viewing point at stage level or below, there will be severe obstructions between the musicians, and most musicians in an orchestra will not be visible. This will likely result in low preferences. When the seats are located too high above the stage, even though most musicians will be visible, it will be further away from the normal horizontal angle of view and less details (e.g., facial features) will be visible.
The positive effect of audio gain is in line with most previous findings (Jeon et al., 2008; Sato et al., 2012, 2013). Due to the remote method of the experiment, it was not possible to calibrate the absolute levels of the headphones. However, the participants were told to adjust the volume to a comfortable level at the start of the experiment, and the gain changes are all negative. Therefore it is to be expected that when the less than the chosen level, the preference would decrease.
Comparison With Online Survey
To verify the results with a larger sample size, a relevant question was included in an online survey about people’s preferences in concert attending (Y. Chen & Cabrera, 2022). The respondents were shown pictures representing the stage view of eight locations from the current experiment, with the following text: “The following pictures represent views of an orchestra on stage at different seat locations. Please rate each of the views based on how much you like it (0 if you don’t like it at all, 100 if you think it’s perfect).” For each picture, they were shown an interactive slide, and they could drag the knob to change their evaluated rating between 0 and 100. The selected locations are all combinations two distances (20 m and 30 m), two lateral angles (0° and 60°), and two vertical angles (0° and 30°). The pictures shown to the respondents are the same as in Figure 2 (locations 10, 12, 16, 18, 19, 21, 25, and 27). No audio was presented in the online survey. From 142 valid responses, the results showed high correlation with the mean results of the current experiment (Figure 6a), and even higher with the prediction model (Figure 6b). The compatibility of results from different testing methods and sample sizes supports the reliability of the experiment and prediction model for visual assessment.
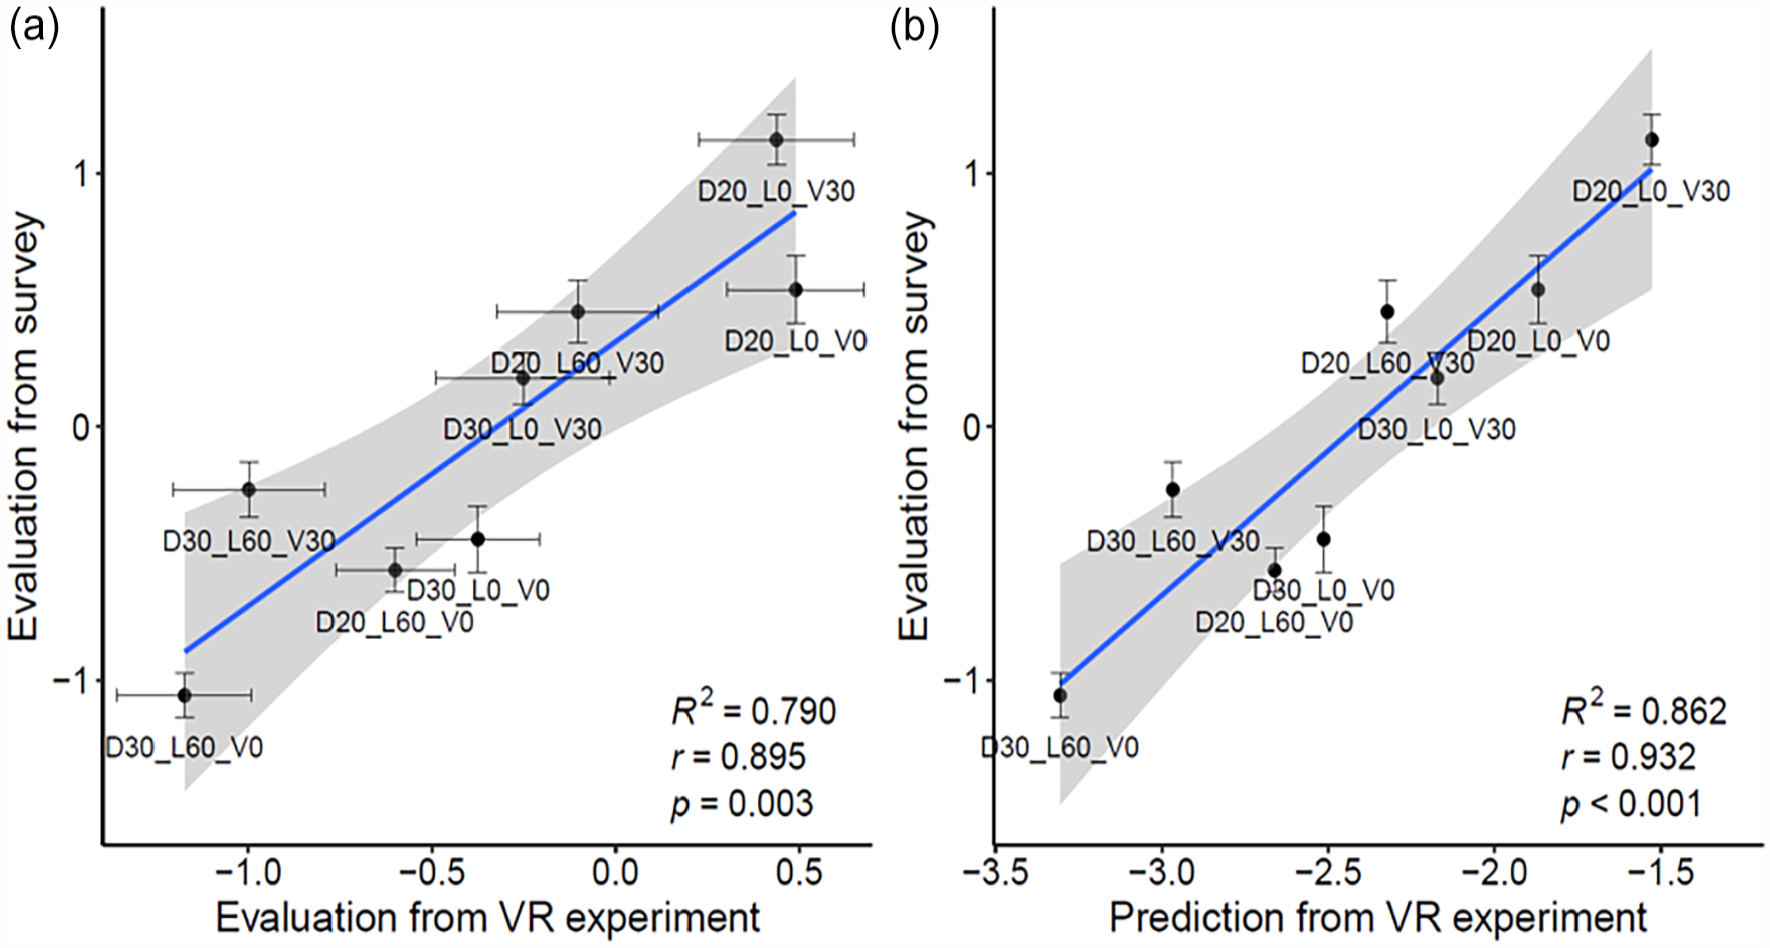
Mean and 95% confidence interval of standardized preference scores from online survey plotted against experiment results and prediction. (a) Survey results versus experiment results. (b) Survey results versus predicted results.
Prediction Example
An example of a typical-sized shoe-box concert hall was analyzed using the prediction model as an example, based on visual factors (distance, lateral angle, and vertical angle).
The dimension of the concert hall used was 50 m length × 25 m width × 18 m height (Wiener Musikverein: 49 m × 19 m × 18 m; Amsterdam Royal Concertgebouw: 44 m × 28 m × 17 m; Boston Symphony Hall: 38 m × 23 m × 19 m), with an audience area of 35 m × 20 m.
The audience area was meshed into approximately 1 m2 × 1 m2, and the preference prediction of each vertex was calculated using the following equation so that the values range approximately from 0 to 100:

The average value, maximum value, and minimum value of the whole audience area were calculated. A color map was also generated for the whole area for better presentation of the preference distribution (color scale: red–yellow–green for 0–50–100), together with a histogram using the same color scale.
Four scenarios of the same auditorium are analyzed for comparison: horizontal audience area with same level as the stage floor (Figure 7a), horizontal audience area 1 m below the stage level (Figure 7b), audience area inclined by 5° (Figure 7c), and audience area inclined by 10° (Figure 7d). While the current prediction model does not include the effect of visual obstruction from other audience members, this is likely to be a problem with scenario A. Commonly used methods to solve that problem include raising the stage or using raked seating, which are demonstrated by scenario B and scenario C to D. It can be seen that while having a raised stage may potentially ease the problem of audience self-obstruction, it is at the cost of visual preference (Figure 7b), especially for the seats close to the stage where audience members will not be able to see most of the orchestra because of the low vertical angle. On the other hand, having raked seating could improve the overall seat preference (Figure 7c and d), and the steeper the rake the better.
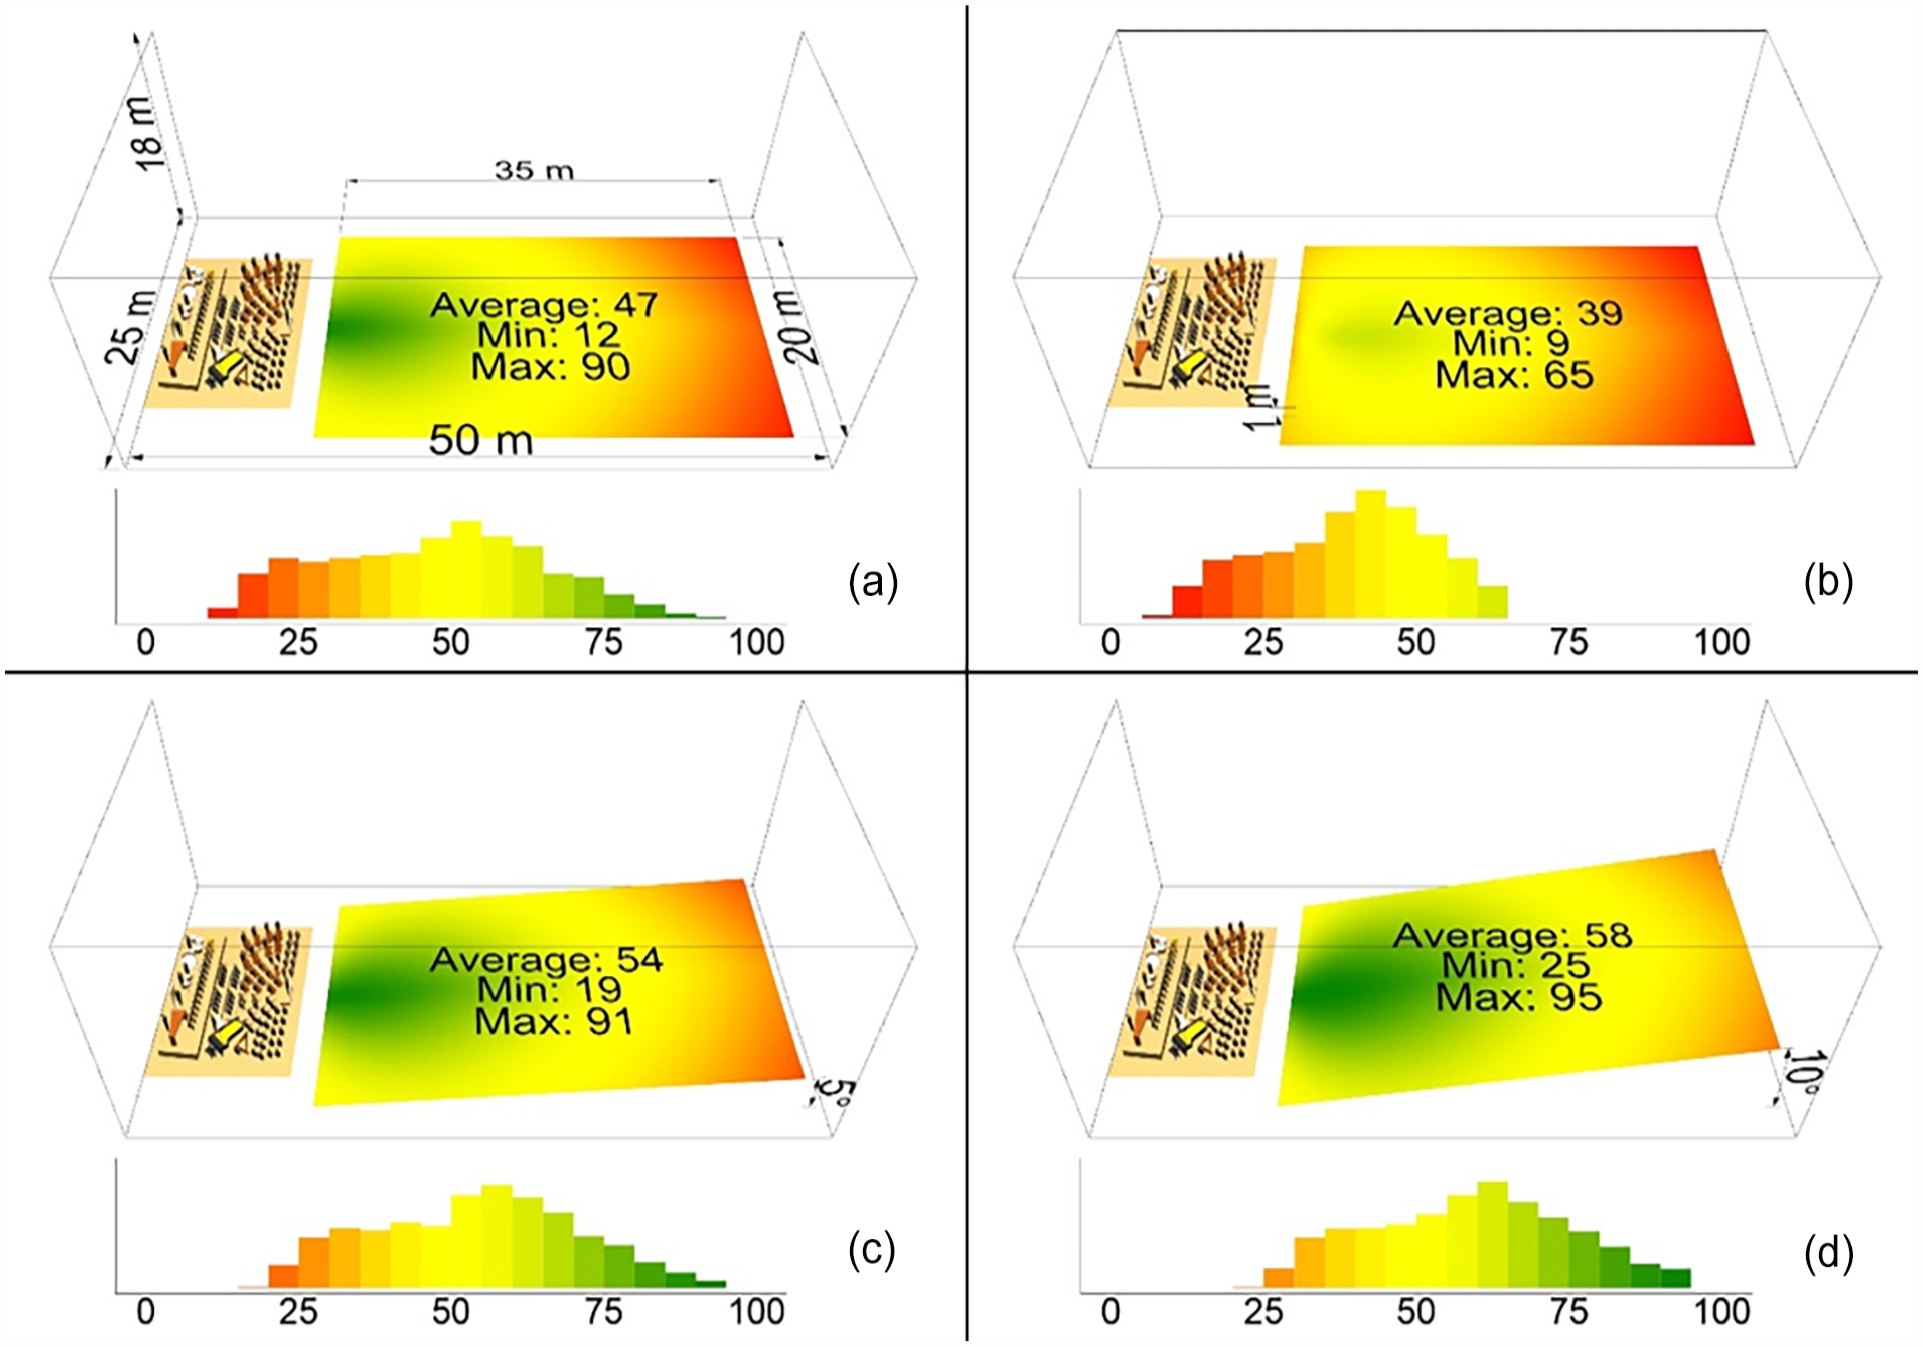
Example analysis using the view-based preference prediction model in different scenarios in a shoe-box concert hall (color maps and histograms): (a) Flat stage and no raked seats, (b) Stage raised by 1 m, (c) Raked seats (5°), and (d) Stage raised and raked seats.
Therefore, it can be seen that compared to raising the stage level (to ameliorate audience obstruction), having a raked audience area may be a better solution because it provides better stage views.
Further Options and Limitations
The current experiment is one of the first to use virtual-reality subjective experiment with online volunteer recruitment, as an innovative adaptation to the COVID-19 situation. The method is further tested and verified in comparison to more traditional laboratory-based experiments (Y. Chen, 2022; Y. Chen et al., 2022).
The current study proposed a prediction model for auditorium seat preference based on an orthogonally controlled experiment with virtual reality. While it has been compared with some existing case studies and an online survey, more future work needs to be done to verify and refine the prediction model in different types and sizes of real auditoria, to determine its applications and limitations, and add any additional influential factors that were not examined in the current study. Some follow up studies have already verified and refined the prediction model (Y. Chen, 2022; Y. Chen et al., 2022).
The current experiment shows only the view of the stage without the visual environment of the auditorium. When the visual environment is present, the perception of distance and preference may be affected. This effect is investigated in further studies (Y. Chen, 2022; Y. Chen et al., 2022), in which similar 3D orchestra was shown in virtual reality but with realistic auditoria renders instead of plain black background as in the current study, and results show that distance has a larger effect on preference when visual environment is present, which may be related to that visual distance perception is affected by environmental cues.
While the current prediction model does not account for the effect of visual obstruction on preference, it is possible to combine it with a sightline analysis tool that investigates visual obstruction (Y. Chen & Fearnside, 2019; Marshall Day Acoustics, 2020). Analysis of visual obstruction considers details such as seat staggering that are beyond the parameters considered in this paper. However, it should be noted that while visual obstruction is known to degrade visual preference in auditoria (Jeon et al., 2008), it has yet to be systematically studied and quantified using subjective methods.
The example given in Section 4.3 only includes the effect of the visual factors in the prediction model because it was not a real auditorium. For a given auditorium it would be possible to combine this with acoustic simulation results (e.g., using a geometric acoustics computer program), so that the effect of sound level is also included.
With the effect of distance on preference, the outlier of the closest distance (5 m) suggested the possibility that an optimal distance may exist within the range of 0 m to 10 m, which in broad terms would be consistent with the theories of Veneklasen (1975) and Vaupel (1998). However, because there was only one location in the experiment that had the distance of 5 m, and the confidence intervals (error bars) were relatively large, there was insufficient statistical support for an optimal distance, and hence a linear model was used. Therefore, the model is likely to be most reliable for distances in the 10 to 30 m range.
While the current study uses orthogonal factorial design and completely separates the effect from each investigated factor, some of the factors commonly covary in reality, especially distance and audio gain. In a semi-diffuse field (like most auditoria), sound pressure level decreases when distance increases from the decrease in direct sound partly due to the inverse square law (Barron, 1996), and people perceive a sound to be louder when distance increases without changing the sound level (Barron, 1988; Zahorik & Wightman, 2001). In addition, because the audio in the current study was largely simplified in order to control variables, even though the direction of the sound source was changed with the visual stimuli to add a certain degree of realism, the lack of other changes in audio (e.g., direct-to-reverberant ratio, early decay time, or parameters associated with lateral reflections) may also create incongruences from the participants’ expectations when the visual locations change. Therefore, apart from the effect of each factor on preference, there may exist an additional effect from the audio-visual incongruences. Mismatching auditory and visual stimuli has been found to decrease plausibility or pleasantness for audio-visual contents (Postma & Katz, 2017; Viollon et al., 2002), although the incongruence in the current study may be less obvious than the incongruences in the reference studies (source location or content).
The current experiment used a full-sized symphony orchestra on a proscenium-style stage with a straight stage front, so the prediction model may need further verifications and adjustments if applied to other types of performances (e.g., recitals, operas, or plays), or to seats to the side or back of the stage. The used stage dimensions were chosen to represent a classical symphony concert hall stage, while opera houses and some modern concert halls may have larger stages, while recital halls may have smaller stages (Beranek, 2012). In addition, no room information was added in the experiment for full control of the variables. In real situations, different stage sizes, interior design, and seating layouts may also result in deviations from the prediction model. The use of virtual reality could provide more accurate visual information compared to using photographs, but the visual distance and angle perception may still be slightly different from real situations. Also, the use of static model of the orchestra could not represent the dynamic changes and full details of real visual scenes.
Another limitation is that because the experiment was done in the participants’ own selected space with their own equipment, there was no calibration for the listening level. Therefore, the audio gain in the experiment was relative to the participants’ own preferred gain, and could not be compared with any absolute value. Also, no spatial information apart from the orientation of the direct sound was included in the auditory stimuli for full control of the variables. In addition, the VR headsets and headphones used by the participants are different, which may add to the variability of the experiment. The use of virtual-reality and digital audio playback with limited spatial information may affect the participants’ experience compared to realistic situations. The main effect may be related to lack of realism, and the effect of virtual-reality on distance perception.
One thing that needs to be considered in any audiovisual preference studies including the current one is that auditory and visual preferences in auditoria are not mutually independent: humans perceive the world through multiple senses, and integrate all the sensory inputs to get the most accurate and correct information of their environment (Stein & Meredith, 1993). Auditory preference and visual preference of architecture have been found to have a mutual positive effect (Y. Chen & Cabrera, 2021; Galiana et al.), and as described in Section 1.1, they both contribute to the overall preference. Studies in auditoria have found that various types of auditory perception, especially intimacy, listener envelopment, apparent source width, and distance perception, are all affected by visual input (Cabrera et al., 2004; Hyde, 2002, 2004; Maempel & Jentsch, 2013; Postma & Katz, 2017; Tokunaga et al., 2013; Valente & Braasch, 2010; Zahorik, 2001), and auditory perception in turn affects auditory preference. Visual inputs including color and lighting also directly or indirectly affect auditory preference (Ando, 1998; Y. Chen & Cabrera, 2021). While the current study mainly focuses on visual preference, the interaction between visual and auditory senses may have some effect on the experiment.
This study and the summarized previous studies in this paper are focused on the auditory, visual, or audio-visual conditions in auditoria. In practical situations, there are other factors not related to vision and hearing that might influence people’s seat preference or seat selection, including but not limited to economic, ergonomic, and cultural factors, such as the comfort of the seat and the environment (Giannis et al., 2016; Kavgic et al., 2008), ease of access to the seat (Vaupel, 1998), social status of the audience members (Williamson, 2009), or professional background of the audience members (Y. Chen & Cabrera, 2022; Galiana, et al.,2016). As these factors cannot be captured in laboratory experiments, they are usually considered part of random errors in the experiments.
A power analysis to determine adequate sample size was not conducted prior to the study. Since post-hoc power analyses are not recommended (Zhang et al., 2019), it is not possible to comment on whether the sample size used here was sufficiently large to detect significance. The effect sizes presented here, however, may be informative in future studies, wherein a power analysis is recommended to compare the results presented here with appropriately large sample sizes.
Conclusion
The effect of distance, lateral angle, vertical angle, and audio gain on overall subjective preference for a virtual symphony concert was studied using subjective testing with virtual reality and headphone playback. Results show that all four factors significantly affect preference, of which distance has the largest effect. No interactions are found between the factors.
Within the tested range of 5 m to 30 m, the visual distance to stage has a negatively sloped linear effect on preference. Within the tested range of 0° to 60°, the lateral angle from the center plane has a negatively sloped linear effect on preference, and the effect is symmetric on either side of the center plane. Within the tested range of 0° to 30°, the vertical angle from the horizontal plane has a quadratic effect on preference, with a maximum at around 18°. Within the tested range of −9 to 0 dB relative to the participants’ chosen listening level for the experiment, audio gain has a positive linear effect on preference. The combined effect of the four factors can be calculated from the sum of the effect of each individual factor. A prediction model is derived from the results, which accounts for the effects of the four studied factors.
The model is compared with the proposed models from two other studies (Vaupel, 1998; Veneklasen, 1975). It is proven to be mostly robust, and the differences are analyzed and discussed. An analysis example using a simple shoebox concert hall demonstrates the potential use of the model.
Footnotes
Appendix A
The following table provides Tukey-HSD post hoc test results for the ANOVA test.
Appendix B
Self-consistency of each participant including the participant with the lowest self-consistency who was excluded from the result analysis (calculation method explained in section 0) is plotted against the average time that they spent on each location (Figure B1), showing that the time spent does not affect the result consistency.
Average time per seat and result self-consistency was also plotted against background information (age, gender, and equipment; Figures B2 and B3). Only headphone-type significantly affected self-consistency, of which participants with headphones built-in with the VR headsets had higher consistency. This may be due to the fact that VR headsets with built-in headphones are used more by people who use VR extensively (e.g., as part of their work), who may be more familiar with the VR environment.
Acknowledgements
The authors thank the participants who volunteered their time for this project. They thank Shin-ichi Sato (Universidad Nacional de Tres de Febrero, Buenos Aires) for providing data from his published experiments. They thank relevant people from Marshall Day Acoustics for feedback and help on subjective testing.
Declaration of Conflicting Interests
The author(s) declared no potential conflicts of interest with respect to the research, authorship, and/or publication of this article.
Funding
The author(s) disclosed receipt of the following financial support for the research, authorship, and/or publication of this article: Yuxiao Chen was supported by a University of Sydney Research Training Program (RTP) International Scholarship and a H.J. Cowan Architectural Science Scholarship. Manuj Yadav was supported by a DFG (German Research Foundation) grant - Project number 503914237.
Ethical Approval
The ethical aspects of this study have been approved by the Human Research Ethics Committee of the University of Sydney [2020/449 and 2020/800].