
Abstract
Higher-level mathematics courses in upper secondary school serve as a critical filter to future educational courses and careers in Science, Technology, Engineering and Mathematics (STEM). However, the percentage of senior school students in Australia undertaking higher-level mathematics courses is decreasing. Given that these courses provide students with skills and knowledge integral to STEM disciplines, it is important to discover factors that serve to encourage or detract students in choosing higher-level mathematics courses. Considering that educational and career choices are influenced by personal interests, values, and expectations, the purpose of this study was to design and validate a bipolar format survey instrument to investigate motivational factors on mathematics course choices of Year 10 Australian school students based upon Situated Expectancy-Value Theory (SEVT). A 25-item survey instrument using a bipolar format was developed to measure: Expectancy for success (operationalized as Competence-beliefs); Intrinsic value; Attainment value; Utility value; and Cost in relation to mathematics. Confirmatory and exploratory factor analyses of data collected from Year 10 students (n = 886) revealed a four-factor model consisting of well-defined factors of Competence-beliefs, Intrinsic value, Attainment value, and Utility value. Unexpectedly, the items designed to measure the Cost factor dispersed variously into the factors of Competence-beliefs, Intrinsic value, and Utility value, and conceptually plausible explanations are offered for this finding. This survey represents a promising instrument for measuring predictors of mathematics course choices in senior school students. The study findings also suggest interrelationships between specific cost dimensions and other factors relevant to the measurement of SEVT constructs more generally.
Keywords
Introduction
A workforce equipped with the skills and knowledge in STEM has been acknowledged both in Australia and internationally as essential for the future economic growth of countries in the 21st century (Corrigan & Aitkens, 2020; Department of Education, Skills and Employment & Australian Government, 2021; Office of the Chief Scientist, 2014). The study of higher-level mathematics courses in school has been described as an important gateway to university courses in STEM (Petersen & Hyde, 2017; Roberts, 2014; Watt & Goos, 2017). For example, students who choose to study higher-level mathematics courses in school are reported to be more successful in STEM disciplines at the tertiary level (Government of Western Australia, 2019; McMillan & Edwards, 2019). Given this, it is of concern that enrolments in these mathematics courses in the senior secondary phase of education in Australia (Years 11 and 12) have declined over the past 20 years (Li & Koch, 2017; Marginson et al., 2013). Thus, avoiding higher-level mathematics courses has the potential to place limitations on school students’ future educational pathways and career opportunities in STEM (Watt, 2006; Watt et al., 2019). For this reason, it is important to investigate the motivating factors that influence school-age students’ decision-making about selecting, or not selecting, higher-level mathematics courses for Years 11 and 12.
A prominent theory to explain educational and career-related choices is Eccles, Wigfield, and colleagues’ Situated Expectancy-Value Theory (SEVT; Wigfield & Eccles, 2020). Originally developed to explain gendered preferences in school mathematics courses (Eccles et al., 1983), SEVT remains a well-accepted theoretical lens through which to explore the personal and social influences on school and university students as they make academic choices. The SEVT model of achievement-related choices explains both the psychological processes that underlie specific choices, and the wider social and cultural influences that serve to promote or inhibit these choices. Empirically, SEVT continues to be used to explore the influence of motivation-related beliefs about the study of mathematics in school- and university-level students (Conley, 2012; Gaspard, Dicke, Flunger, Brisson, et al., 2015; Gaspard, Dicke, Flunger, Schreier, et al., 2015; Jiang et al., 2018; Lauermann et al., 2017; Luttrell et al., 2010), as well as mathematics in addition to other academic domains (Gaspard et al., 2017; Gaspard et al., 2018; Kosovich et al., 2015; Trautwein et al., 2012; Wille et al., 2020). The main aim of this study, therefore, was to develop a survey instrument based upon SEVT constructs to be used to investigate the motivational factors associated with future mathematics course choices of Year 10 students, especially in relation to the higher-level mathematics courses. The design of a survey instrument for use with school students will provide researchers with the opportunity to consider local influences on decision-making and to potentially identify issues that contribute to lowered enrolments in higher-level mathematics courses.
Situated Expectancy-Value Theory and Mathematics Course Choice
The key components of SEVT considered to be the most proximal in influencing decision-making are conceptualized as, “expectancy for success” and “subjective task value.”
Expectancy for success refers to beliefs about the possibility of experiencing success in a task in the future. For example, being successful in mathematics in the past may lead an individual to expect further success in mathematics going forward, thereby increasing the possibility that they will pursue further studies in mathematics in the future. Such task-specific beliefs are influenced by an individual’s perceptions about their own ability in that task. This definition of task expectancy overlaps with current conceptualizations of “academic self-concept” (Marsh et al., 2019). A perception of domain-specific competence, such as mathematics self-concept, is a useful predictor of future mathematics choices and course-selections (Basarkod et al., 2022). This is because students who feel competent that they possess the required skills for success in a course are more likely to select that course than students who do not expect to achieve in the same course. In empirical studies self-concept responses are usually utilized as measures of expectancy for success (Eccles, 2009; Guo et al., 2015; Trautwein et al., 2012), such as, “How good in math are you?.” Other items used in studies reflect an expectation of achievement, for example, “How well do you expect to do in math this year?” (Wigfield & Eccles, 2000). Although these highly related constructs of academic self-concept and an expectation of achievement could be considered conceptually distinct, thus far this has not been borne out empirically (Eccles & Wigfield, 2020), and both types of items are used to measure an expectancy for success in research studies.
An important predictor of choice in academic courses is subjective task value (STV). This refers to the overall value assigned to a specific task. STV is a function of four key components, these are: intrinsic value, utility value, attainment value, and cost (Eccles et al., 2005; Wigfield & Eccles, 2000; Wigfield et al., 2017).
Intrinsic value refers to the anticipation of enjoyment in a task. Individuals who experience enjoyment when engaging in mathematics tasks are likely to ascribe a high level of inherent value to mathematics activities and to seek out similar activities in the future. Csikszentmihalyi (1997) captured a sense of the active involvement in a task for pleasure as “flow.” This is evidenced by deep engagement and persistence in an activity. The notion of intrinsic value also intersects with the work on interest. Interest in a domain, such as mathematics, can be situational, that is, associated with an immediate task, as well as enduring, in that interests can develop over a period of time (Jansen et al., 2016). Both these ideas are captured in an iteration of the SEVT model in which intrinsic value was named “interest-enjoyment value” (Eccles, 2005). Intrinsic value has been shown to be an important predictive factor in both educational and future career choices (Guo et al, 2015; Lazarides et al., 2017; Watt et al., 2012). Items designed to measure intrinsic value focus on liking, enjoying, or showing interest in a topic. These items allow respondents to reflect upon how much they want to do a particular activity and to make judgments as to their level and depth of engagement in an activity, such as, “How much do you like doing math?” (Eccles & Wigfield, 1995).
Attainment value is the personal importance that an individual attaches to doing well in a task. This component of STV is likely to be culturally embedded, in that it relates to a sense of personal identity as viewed by others (Eccles, 2005). It encompasses placing value on demonstrating competence in an activity that is commensurate with one’s own self-image. For example, students may place higher attainment value on doing well in a mathematics test if they have developed a social identity of being “good at mathematics.” Attainment value, therefore, relates not only to a sense of self, but also to the expression or demonstration of an important part of the self (Wigfield et al., 2009). The implication here is that students are more likely to choose a course of study that matches their view of themselves. Items to capture attainment value generally reflect a sense of personal competence in the topic of interest, such as, “Understanding math is very important to me” (Jiang et al., 2018), in addition to the importance of achievement, for example, “Performing well in math is important to me” (Gaspard, Dicke, Flunger, Schreier, et al., 2015). However, it could be argued that the conceptualization of attainment value as reflective of an individual valuing a task that is central to their sense of identity, and by engaging in that task the individual is expressing an important aspect of themselves, is less well-captured empirically (Eccles & Wigfield, 2020).
Utility value is a perception of the usefulness of a task in achieving personal goals. If a task is viewed as having high utility this means that it is evaluated as serving an important purpose and, as such, utility value is highly predictive of a choice to continue in course of study. An example of utility value as a motivating factor in a specific mathematics course choice is if it is a prerequisite for further valued studies, or if useful skills will be taught in that course that are necessary in a future career. As compared to other value components in SEVT, it could be postulated that utility value is more associated with extrinsic motivation than is the case with intrinsic and attainment value (Trautwein et al., 2012). This is because a perception of the utility value of a particular choice is dependent on its links to a wider range of goals that are extrinsic to the specific choice options (Eccles & Wigfield, 1995). A typical utility value item to rate the general usefulness of a task is, “How useful do you believe maths is?” (Watt et al., 2019). Utility value items may also be written with more specificity to the usefulness of different choices, such as alternative mathematics courses. Eccles and Wigfield (1995) adopted this approach by including utility value items in their instrument that referred directly to the utility of the advanced mathematics courses. It is likely that utility perceptions may vary about different mathematics courses dependent on extrinsic influences, for example, specific mathematics courses may be required for different purposes, and this may predict the choice of one mathematics course over another.
Cost is considered to be especially influential in choice-decisions. It encapsulates the potentially negative consequences of a decision to an individual, that is, what will be given up or lost if a given choice is made. Cost traditionally incorporates three dimensions in SEVT. These are “effort cost” (whether the effort necessary for task completion is deemed to be worthwhile or not), “psychological cost” (an anticipation of the negative psychological or emotional consequences of failure or success in the task), and “loss of valued alternatives” (LoVA; loss of valued activities that would have to be given up in order to do the target task). In SEVT cost operates to moderate the positive aspects of value through an enactment of a cost-benefit relationship (Eccles & Wigfield, 2020; Wigfield & Eccles, 2020; Wigfield et al., 2017). This involves a judgment of the expected positive consequences of choice alternatives, as weighed against the perceived negative consequences of the same to make a final decision. For example, individuals will weigh up how much they anticipate that they will be successful in an activity, or how important undertaking that activity is to them, against whether they can afford the costs associated with the activity. Consequently, individuals are more likely to avoid activities that they consider too costly relative to their benefits, as compared to alternative activities that have a higher perceived benefit to cost ratio (Eccles et al., 1983). This notion that potential benefits and costs are evaluated with respect to each other in decision-making is integral to the conceptualization of SEVT. It remains important, therefore, that cost is operationalized in empirical work in a way that accounts for the interrelationships between expectancies and values. This is because cost is an inextricable element of all value decisions.
Until relatively recently, cost was defined and measured according to specific aspects or dimensions (Wigfield et al., 2017), however, cost has been more comprehensively defined and measured in instruments that have included effort, LoVA, and psychological costs (e.g. Flake et al., 2015; Part et al., 2020; Perez et al., 2019). A significant contribution to the operationalization of cost made by Flake and colleagues that is often reflected in more recent instruments, is that cost, by its very nature, should reflect anticipated consequences that are negatively construed. Individuals who enjoy challenges, such as hard mathematics problems, may not perceive these as effortful or negative to them. Therefore, Flake et al., contend that for a task to be perceived as costly, the amount of effort involved would need to be judged as overwhelming or unwelcome. The inclusion of the words “too much” in a sample item such as, “This class is too much work,” ensures that the item captures an appraisal of a negative consequence that is fundamental to the conceptualization of cost.
In measuring cost, effort costs appear to be operationalized more consistently across studies than LoVA costs and psychological costs. Many scholars use the term “effort,” such as, “It requires too much effort for me to get a good grade in math” (Jiang et al., 2018). Others operationalize effort in terms of time invested, that is, “I’d have to invest a lot of time to get good grades in maths” (Meyer et al., 2019). Flake and colleagues also identified a further type of effort cost that they called “outside effort cost” defining this as, “Time, effort, or amount of work put forth for task other than the task of interest.” (Flake et al., 2015, p. 235). An example of an item to capture this type of cost is, “Because of other things that I do, I don’t have time to put into this class.” Items to measure LoVA costs tend to focus on loss of time for other tasks or activities that an individual might want to pursue, or must give up, due to the anticipated level of engagement required for the target task, such as, “I have to give up other activities that I like to be successful in math” (Gaspard, Dicke, Flunger, Schreier, et al., 2015). Some instruments use the term “opportunity costs” to capture this construct because other opportunities may be limited as a result of an anticipated choice. An example of lost opportunities could be defined as social costs in that friendships or social connections may be lost if a student chooses to undertake a different course from friendship groups.
Within the SEVT literature, psychological costs reflect the anticipated fear of failure or success, but also what are described by Eccles (1987) as “emotional costs.” These encompass anticipated anxiety around engaging in a choice activity, or fears about the negative consequences of success or loss of self-worth as a potential consequence of a choice. This may explain why this dimension of cost is referred to variously as psychological cost or emotional cost in different studies. Expanding the construct of psychological costs to include emotional costs implies, therefore, that this construct also relates to other mood states, such as anxiety, exhaustion, stress, and frustration, as shown in some of the cost items used by Flake et al. (2015). A body of evidence exists to suggest that mathematics anxiety, as defined as a sense of apprehension and fear experienced during mathematics activities (Xiao & Sun, 2021), causes the avoidance of mathematics tasks in the future (Goetz et al., 2013). Notwithstanding some of the challenges outlined in empirical measurement, SEVT remains an efficacious theory with strong empirical support on which to base an instrument to investigate influences on school students’ academic choices in relation to mathematics.
The Present Study
The main purpose of this study was to provide a new measure to investigate influences on school students’ academic choices in relation to mathematics, and to explore the interrelationships amongst SEVT constructs using this instrument. Based on SEVT constructs considered predictive of critical educational and career decisions (Wille et al., 2020), this survey instrument draws from both the original theoretical conceptualization of SEVT and from recent developments in measuring SEVT constructs empirically.
Taking the perspective that a survey instrument should be designed such that the response format matches the construct to be measured (Wetzel & Greiff, 2018), the SEVT-based instrument created is unique in that it adopts a novel bipolar statement format developed and applied in previous studies by the second author. It could be argued that the bipolar item format in the instrument developed here offers much in attempting to represent with integrity the cost-benefit appraisal central to decision-making in SEVT. This format has been used successfully to measure various constructs in the affective domain, including attitudes (Lim & Chapman, 2019), epistemic beliefs (Lim & Chapman, 2020), and motivation in adult learners (Chung & Chapman, 2020; Wong & Chapman, 2022). To our knowledge no other researchers have adopted a bipolar statement format to measure mathematics motivation in relation to course choice. Furthermore, while the second author has used this format in previous research, it has not been used at the secondary school level previously. Thus, a secondary goal of conducting the current study was to determine how this same response format could be used to study motivation for mathematics course choice in secondary school students.
Method
Prior to collecting any data, ethics approval for this research was obtained from the Human Ethics Office of Research Enterprise, University of Western Australia (reference RA/4/1/9365), the Government of Western Australia, Department of Education (reference D19/0438945), the Catholic Education Office of Western Australia (reference RP2019/14), and the Principals of each independent school that participated in this study.
Participants
For the initial content validation, three experienced mathematics educators reviewed the survey to confirm that the items represented typical motivating factors shown by students in considering future mathematics courses. In addition, two school students provided written feedback on clarity of item wording. To evaluate the internal structure of the instrument, Year 10 school students enrolled at co-educational secondary schools that offered a suite of mathematics courses, including the two higher-level mathematics courses (Mathematics Specialist, Mathematics Methods), were invited to participate in the study. These students were enrolled at 22 Catholic Education Western Australia (CEWA) schools and 27 independent schools in the metropolitan and an inner regional area in Western Australia. To achieve a more balanced cross-sector sample, the number of schools from the largest public-school sector approached for possible participation was matched to the number of CEWA schools, as described in more detail by Kirkham and Chapman (2022). Of the 71 Principals approached for participation in the study, 16 accepted the offer (Department of Education public schools n = 7; Independent school sector n = 6; CEWA schools n = 3).
Data were gathered from 886 Year 10 participants. These participants represent a sub-set of the sample included in the study by Kirkham and Chapman (2022). Of the 942 participants in this previous study, 48 did not complete the additional survey for this study, while eight participants showed a pattern of “survey straightlining.” Therefore, these 56 participants were not included in the sample for this study. There were no missing values. In the present study 51.35% of the participants were girls (n = 455) and 48.64% were boys (n = 431). Most participants were aged 15 (56.43%, n = 500) and 16 years of age (43.23%, n = 383). Two participants were aged 14 years (0.23%) and one participant was aged 17 years (0.11%). Roughly equal numbers of participants were enrolled in public schools (n = 355) and independent schools (n = 350), 40.07 and 39.50%, respectively. CEWA schools comprised 20.49% of the total participants (n = 181). Of the total participant population, 1.02% (n = 9) identified as being of Aboriginal and/or Torres Strait Islander origin. It should be noted here that the researchers were not permitted to use any data that identified specific schools or school sectors. As a result, it was not possible to explore any forms of nesting within the data in the analysis.
Instrument Structure
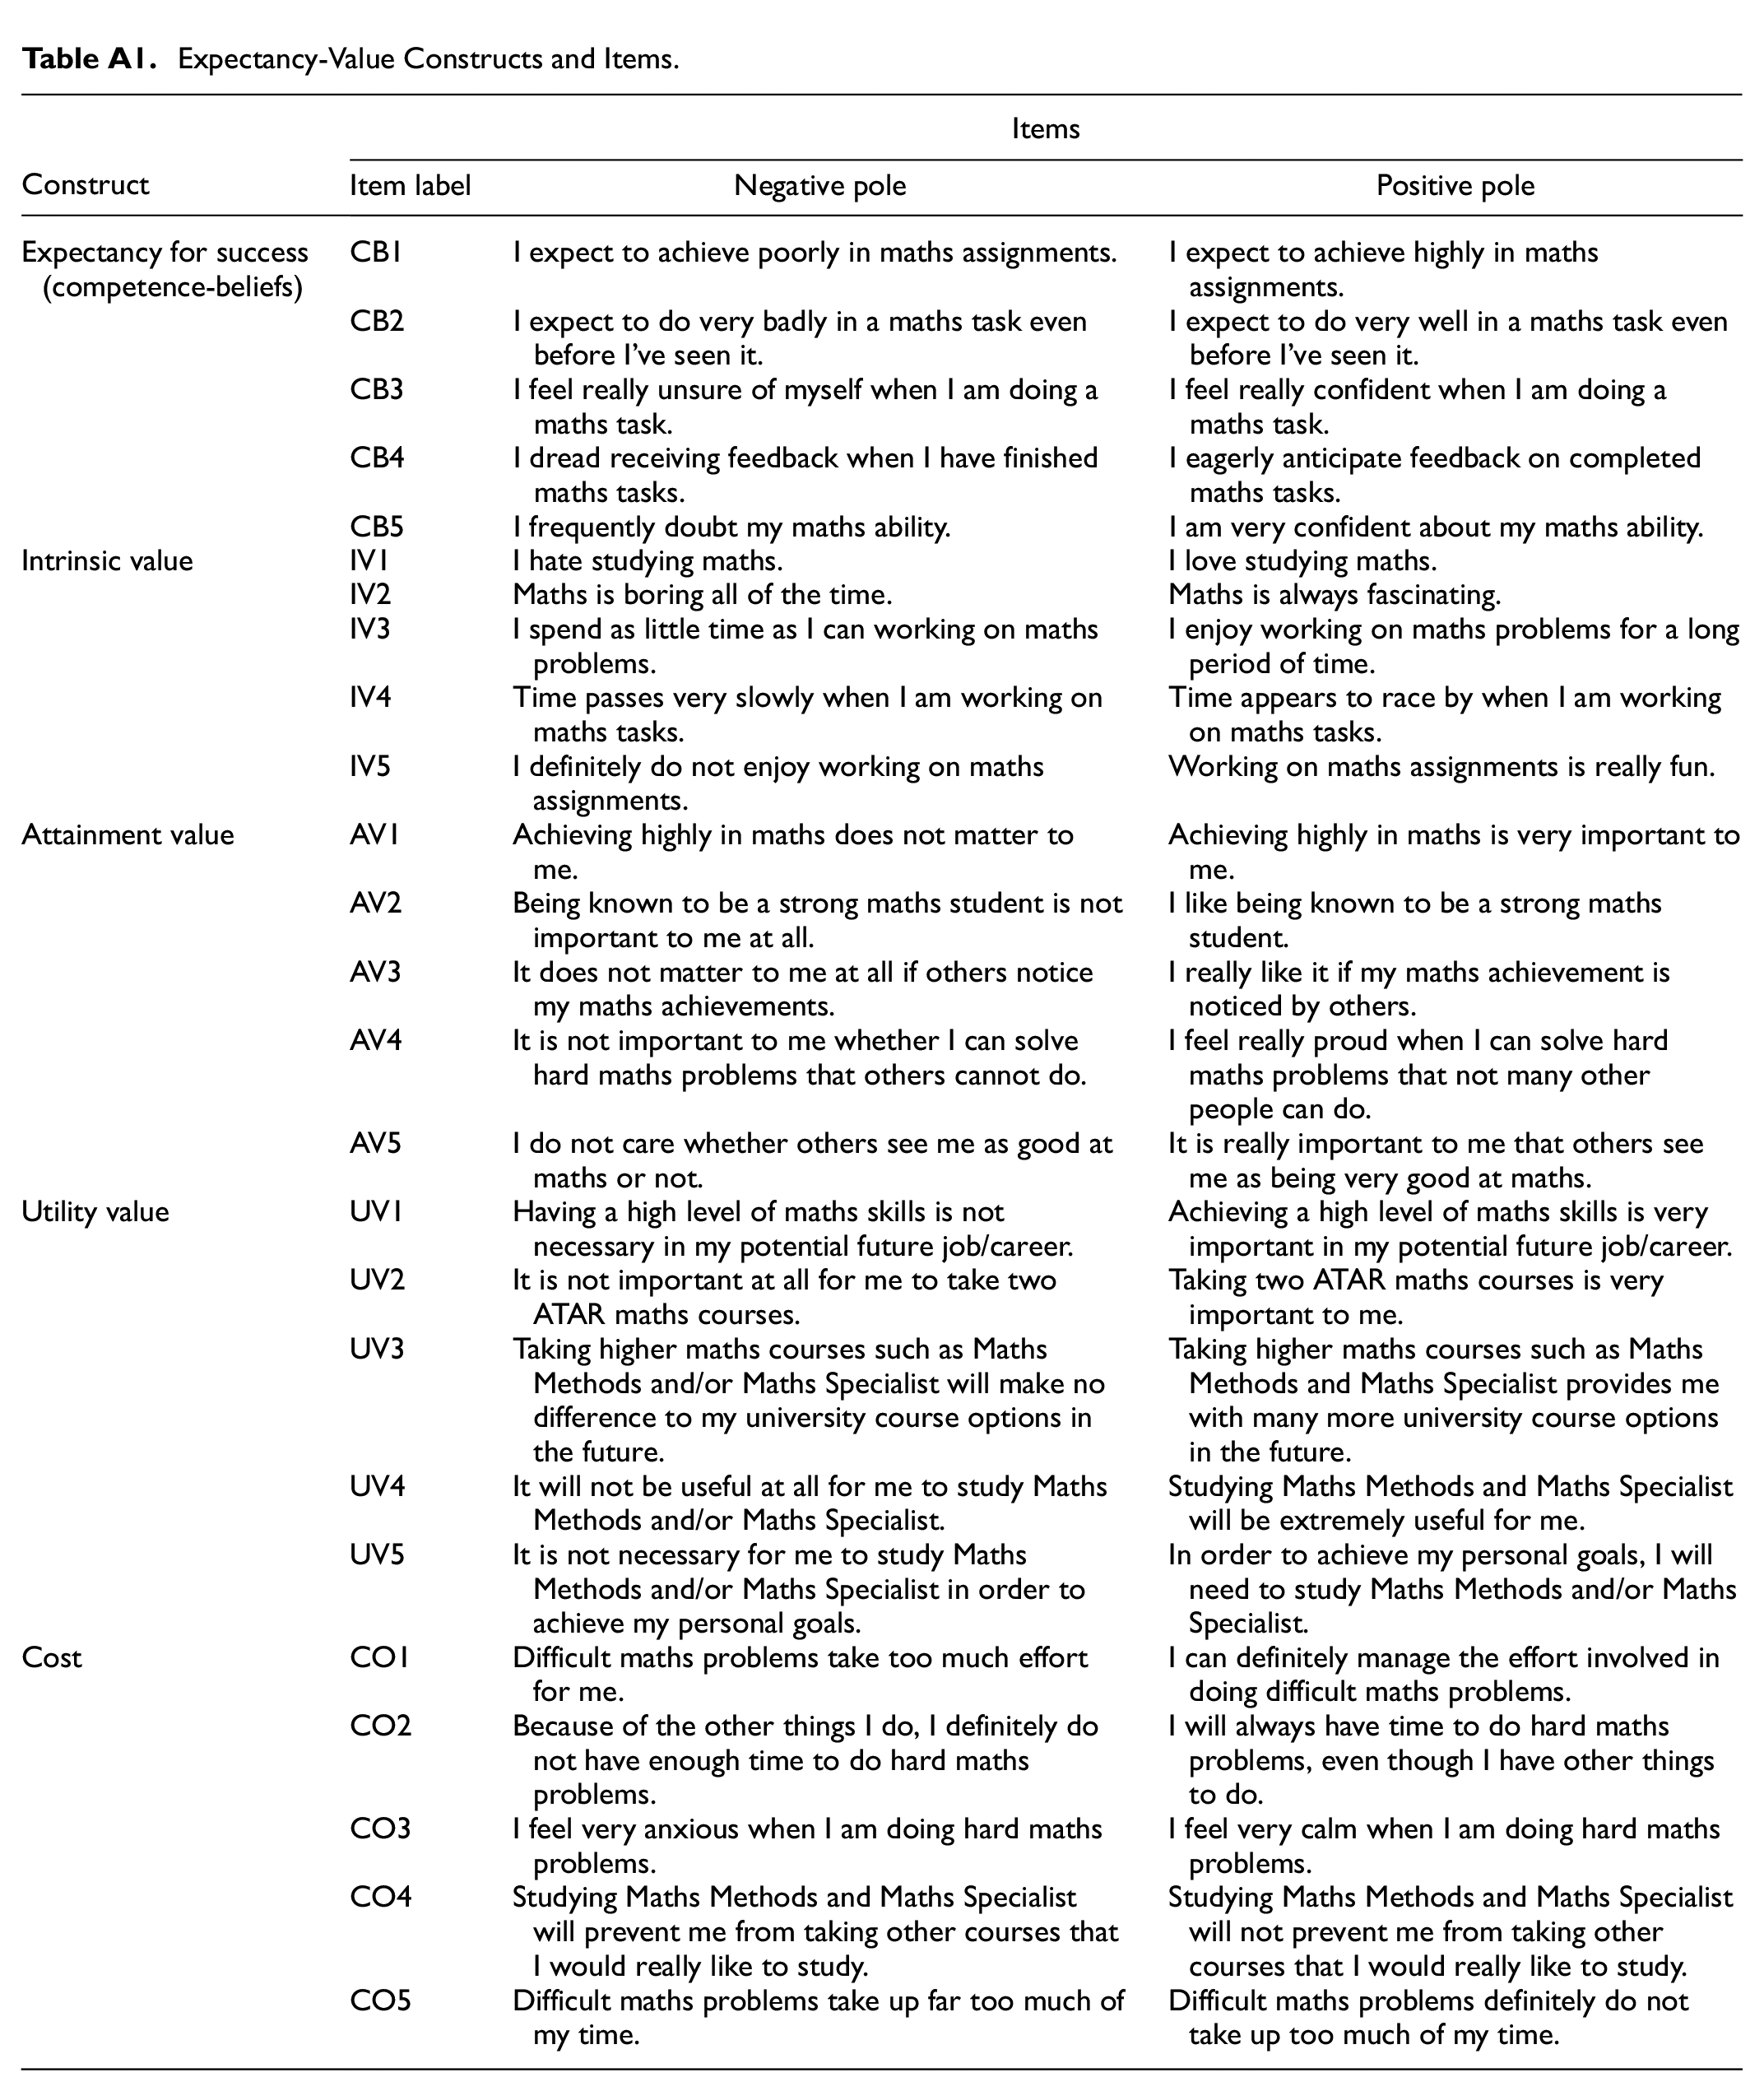
A total of 25 items were designed to capture the theoretical conceptualizations underlying the SEVT constructs of: expectancy for success; task values; and the costs associated with studying mathematics, especially the higher-level mathematics courses. All items and corresponding item labels are presented in the AppendixTable A1.
Expectancy for success (CB)
Five items were designed to capture an expectancy for success in mathematics related to a sense of personal competence, and to how well an individual expected to do in mathematics tasks. Collectively, these items were operationalized and labelled as “Competence-beliefs” (CB). Two items related directly to an expectation of achievement in mathematics assignments and tasks, as adapted from Wigfield and Eccles (2000). These items were labelled CB1 and CB2. An additional 2 original items operationalized an expectation for success as confidence in personal performance in mathematics tasks, and as eagerly anticipating feedback on mathematics tasks (CB3, CB4). A further original item was designed to reflect mathematics self-concept more generally in terms of an expression of confidence in one’s own ability (CB5).
Intrinsic value (IV)
Three intrinsic value items were written to capture the extent to which a respondent liked mathematics and enjoyed mathematics tasks, as well as having a level of interest in mathematics generally (IV1, IV2, IV5). These items were adapted from Watt (2004) and Wigfield and Eccles (2000). Two additional items were adapted from one of the questions in the study by Trautwein et al., (2012) to capture the evidence of enjoyment in tasks through engagement (IV3, IV4). This notion that when someone is deeply engaged in a task, they do not notice time passing is akin to the concept of “flow,” as described by Csikszentmihalyi (1997).
Attainment value (AV)
Attainment value was measured with 3 items that captured the value to an individual of engaging in mathematics to demonstrate personal competence (AV2, AV4, AV5), as adapted from Wigfield and Eccles (2000), in addition to 2 items that related to the importance of achieving highly in mathematics (AV1, AV3), revised from Conley (2012) and Gaspard et al. (2017). Three of these 5 items also incorporated the idea of placing value on the expression or manifestation of personal competence and achievement in the social environment (AV2, AV3, AV5).
Utility value (UV)
To address the main purpose for which this instrument was designed, that is to investigate influential factors on lowered enrolments in higher-level mathematics courses, each of the utility value items asked about the relative usefulness of taking the higher-level mathematics courses, in accordance with the instrument designed by Eccles and Wigfield (1995). One item focused on the general usefulness of these courses (UV4), while 2 items related to the short-term goals of the usefulness of the higher-level courses for school (UV2) and university course options (UV3). The school-based item was specific to the context of the study in that it asked if it was important to the respondents to take two ATAR (Australian Tertiary Admissions Rank) courses. This is because enrolment in the highest (advanced) mathematics course (Mathematics Specialist) requires concurrent enrolment in the intermediate (Mathematics Methods) course. The further 2 items reflected the long-term utility value of these courses related to future employment (UV1) and to meet future goals (UV5). The focus of these UV items for different aspects of life (i.e. school, employment etc.) was derived from Gaspard, Dicke, Flunger, Schreier, et al. (2015).
Cost (CO)
The cost items in this survey were adapted from Flake et al. (2015). One item focused on effort costs (CO1), one focused on time costs (CO5), a further item was designed to measure emotional costs (specified as anxiety; CO3), and 1 item assessed outside time costs (CO2), similar to the outside effort items in the study by Flake et al. Time costs were included in this survey because the loss of time as a negative consequence of choosing a higher-level mathematics course over an alternate course was differentiated from effort costs in the findings from Kirkham et al. (2020). Each of these 4 items focused on costs of engaging in mathematics tasks that were viewed as “difficult.” The final item (CO4) was designed to measure the LoVA cost of studying the higher-level mathematics courses (i.e. Mathematics Methods and Mathematics Specialist).
Item Format
As indicated, items were constructed in accordance with the bipolar statement format developed and used by the second author in previous studies with adults. This format was selected because it had been found to produce favorable psychometric properties in these previous studies. In the instrument, each of the SEVT constructs was represented by 5 items, each of which had a positive statement at one end and an opposing negative statement at the other end. Participants used a slider to indicate their responses to each item along a continuum (see Figure 1). The placement of the slider marker closer to a statement indicated the strength of agreement with that statement. An 11-point scale was adopted, such that numerical labels appeared as the slider marker was moved. This was to reinforce the meaning and polarity of the opposing statements for the participants.

Example of survey item.
Item Statements
The content and wording of items was informed by the way in which SEVT constructs were expressed by similar participants in a qualitative study to capture influential factors in future mathematics course choices analyzed using a combination of conventional and directed content analysis (Kirkham et al., 2020). The content of the survey items was initially created by the first author (a psychologist and a school-based educator) and then reviewed and revised in consultation with the second author (a tertiary-based research psychologist) for content-mapping with reference to, first, the conceptual definitions of expectancy for success and subjective task value, and second, the content of well-validated items in existing surveys. An initial version of the survey was piloted successfully in one school (n = 84) (Kirkham & Chapman, 2020). The final survey was then reviewed by the third author (an engineering education professor), with minor amendments made to improve consistency in terminology, both within items and in survey instructions.
Validity Evidence Related to Instrument Content and Response Processes
As noted, the wording of the items was informed by the outcomes of an initial qualitative study to capture factors relevant to mathematics course choices for Year 10 students (Kirkham et al., 2020). As previously indicated with respect to participants, three mathematics educators reviewed survey items confirming the items reflected typical motivation considerations of secondary school-age students in selecting future mathematics courses. Response process evidence was gathered by having two representative school-aged students complete the instrument and make comment upon any items that were ambiguous or unclear in wording. Minor revisions to items were then made to address any such issues in the items.
Validity With Respect to Internal Structure
To evaluate the internal structure element of validity, the full sample of 886 was split into two random halves (n = 443 for subsamples A and B) using an online random number generator. An exploratory factor analysis (EFA) was then used to explore the structure of the instrument based on Subsample A, with a confirmatory factor analysis (CFA) used to affirm the model developed from the EFA based on responses from Subsample B. While there is considerable variability in the literature on recommended sample sizes for both exploratory and confirmatory factor analyses, given the large sample size associated with this study, it met all such minimum recommendations (e.g., see Wolf et al., 2013).
Results
As noted, results of the initial content and response process evaluations were incorporated to revise the instrument prior to the large-scale study on its internal structure. Results related to the exploratory then confirmatory factor analyses performed to evaluate internal structure are presented in this section sequentially. The suitability of the data for factor analysis was assessed based on the Kaiser–Meyer–Olkin (KMO) measure of sampling adequacy. The KMO on Subsample A returned a value of 0.95, and on Subsample B the value was 0.94. Both values indicated that the sampling was adequate for factor analysis. For the EFA, SPSS v25 was used; LISREL 10.2 was used for the CFA. Descriptive statistics for Subsamples A and B are shown in Table 1. All preliminary screening analyses performed on the data indicated no significant violations of factor analysis assumptions in either of the subsamples, although there were minor deviations from normality based on the tests performed. In light of these minor deviations, PRELIS normal scores were generated and used in both the EFA and CFA rather than the raw scores.
Raw Score Means and Standard Deviations for Subsamples A and B.

For the EFA on Subsample A, a maximum likelihood method was used in the factor extraction, with a Promax approach used to rotate the solution to approximate simple structure. The outcomes of this EFA are shown in Table 2. As indicated, based on Kaiser’s eigenvalues greater than one criterion, with respect to Competence-beliefs, Intrinsic value, Attainment value, and Utility value factors, all items loaded together from each subscale in expected ways. However, the Cost factor items did not cluster together at all, instead dispersing across three of the other factors. The eigenvalues associated with the Competence-beliefs, Intrinsic value, Utility value, and Attainment value factors were 11.47, 2.61, 1.39, 1.15, respectively, which accounted for 60.76% of the total item variance. The next highest eigenvalue after the fourth factor was 0.80, well below the Kaiser criterion.
Pattern Matrix From EFA on Subsample A.

Specifically, the item to measure emotional costs (CO3) loaded with the Competence-beliefs items, while outside time costs (CO2), time costs of engaging in undertaking difficult mathematics problems (CO5), and effort costs of the same (CO1) all loaded with the Intrinsic value items. The final cost item (CO4) combined with Utility value in the solution. This measured the loss of alternative courses that could be studied if the participant selected to take both the higher-level mathematics courses. In general, these results indicated that the cost items were not empirically distinct from the other items in the instrument.
Three CFA models were tested in the analysis of Subsample B data, again based on a maximum likelihood extraction. In Model 1, all items loaded on a single motivation factor. Model 2 was based on the original SEVT model, with cost as a separate factor (five-factor model). Model 3 was based directly on the EFA generated from Subsample A, in which cost items dispersed across three of the four other variables (four-factor model). Fit indices for each of the models tested are shown in Table 3.
Fit Indices for CFA Models.

Based on the Δχ2 statistics, both the original (Model 2, five-factor) and EFA-based model (Model 3, four-factor) fit the data significantly better than did the single factor model (Model 1), Δχ2(10) = 2,547.70, p < .001; and Δχ2(6) = 2,456.04, p < .001, respectively. The difference between the original and EFA models (Models 2 and 3) was also significant, but by a far smaller margin, Δχ2(4) = 91.66, p < .001. Other fit indices also were comparable for the latter two models, as shown in Table 3. Given the increased parsimony of the four-factor EFA model (Model 3) generated from Subsample A, this was the one retained based on the analyses. However, it could equally be argued that as the five-factor model (Model 2) did demonstrate slightly superior fit, a case could be made for this model to also have been supported by the data. Factor correlations based both on the EFA and the CFA for Model 3 are shown in Table 4. For the five-factor solution run in the CFA for Subsample B, the correlations for Competence-beliefs were rs = .63, 59, and .46 for Intrinsic, Utility and Attainment Value, but was more highly correlated with Cost, r = .76. Cost was also highly correlated with Intrinsic value (r = .85), while somewhat less highly correlated with Utility value and Attainment value (rs = .66 and .55, respectively). Attainment value was moderately correlated with both Intrinsic value and Utility value, rs = .59 for both, while Intrinsic value and Utility value were also moderately correlated, r = .60.
Factor Correlations for Subsamples A and B Based on Model 3 (EFA-Based, Four-Factor Model).

The four-factor structure based on Model 3 was affirmed by the high internal consistencies obtained for each of the factors in Subsamples A and B. In Subsample A Cronbach’s αs obtained for the factors of Competence-beliefs, Intrinsic value, Utility value, and Attainment value were .90, .92, .87, .87, respectively. These same four factors also exhibited high internal consistency within the Subsample B data with Cronbach’s αs of .87, .88, .86, and .86 for Competence-beliefs, Intrinsic value, Utility value, and Attainment value, as shown in Table 5.
Internal Consistencies for Two Subsamples Based on Model 3 (EFA-Based, Four-Factor Model).

Discussion
The primary aim of this research was to develop and validate a new survey instrument based on the SEVT model to further an understanding of senior school students’ expectancies and values relevant to future mathematics course choices. While this would primarily be of direct relevance to Australian schools, the instrument could also serve as a guide for the development of SEVT-based instruments for use in other contexts.
Using EFA methods, this study found that the 25 items in this survey coalesced into four factors: Competence-beliefs; Intrinsic value; Attainment value; and Utility value. Contrary to the findings of others who have shown that cost represents a separate factor within the four-factor subjective task value (Conley, 2012; Kosovich et al., 2015; Wigfield et al., 2017), the 5 items designed to measure cost collapsed into three of the other factors, specifically, Competence-beliefs, Intrinsic value, and Utility value. It is possible that the cost items did not form a distinct factor because of the use of the bipolar item format, which presented both positive and negative poles of each of the SEVT constructs. This would not reflect the overall quality of the measurement given that prior research has demonstrated that uni- and bipolar formats are comparable in measuring constructs with fidelity to theoretical propositions (DeCastellarnau, 2018). Furthermore, the way in which the cost items related to the Competence-beliefs, Intrinsic value, Attainment value, and Utility value constructs was theoretically tenable.
The Competence-beliefs factor in this study represents an individual’s perception of their expectancy for success in mathematics tasks. These items encompassed self-confidence in relation to mathematics tasks, an expectation of achievement in mathematics, and an evaluation of one’s own ability in mathematics. Strong primary factor loadings (.73–.90) were noted for four CB items, with the further item showing a primary factor loading of .49. As such, the collective items designed to assess competence-beliefs in this instrument represent a useful measure of how successful Year 10 participants expected to be in mathematics tasks. One cost item (CO3) also, however, showed a strong factor loading on the Competence-belief factor (.71). This item measured emotional costs, with the negative referent of, “I feel very anxious when I am doing hard maths problems,” and the positive referent of, “I feel very calm when I am doing hard maths problems.” This finding would suggest that, for these participants, lacking in confidence in mathematics ability and expecting not to do well in mathematics tasks could be associated with feelings of anxiety, especially when the mathematics tasks are deemed to be demanding. Conceptually, this conclusion is consistent with Eccles’ et al. (1983) early work on SEVT that outlined an interaction between a perception of tasks demands, an expectancy for success, and the psychological costs of the same, especially in situations when the outcome is uncertain. Empirically, many studies have shown that competence-beliefs, such as academic self-concept, correlate negatively with feelings of anxiety (Pekrun, 2017). Furthermore, findings from large-scale international studies with secondary school students (Trends in International Mathematics and Science Study; TIMSS, and Programme for International Student Assessment; PISA), have revealed that self-concept, self-efficacy, and anxiety represent three highly related belief variables that are predictors of achievement in mathematics (Lee, 2009; Stankov & Lee, 2017; Stankov et al., 2012). By stating both positive and negative poles of competence-beliefs about mathematics, as well as positive and negative emotional responses to engaging in hard mathematics problems, the connection between competence-beliefs and an anxiety response has emerged in this study. It is possible that feeling anxious or calm (and the degrees in between) point to differences in competence-beliefs about the task in question. For example, it is possible that a student who doubts their ability in mathematics and who expects to perform poorly in a mathematics test is more likely to experience feelings of apprehension or nervousness about the result of the test than others who feel more confident about their abilities. However, if the emotional cost item had focused more on the psychological cost of failure, as opposed to an emotional response per se, it may have factored differently, and this is a point worth noting as it underscores the importance of how constructs are operationalized in SEVT instruments, and in particular, the fidelity with which these represent the intended theoretical constructs.
The Intrinsic value factor in this study was well-defined with strong primary factor loadings for each of the 5 IV items (.69–.93). It was noteworthy that the 2 items to capture the experience of deep engagement in a task as a reflection of intrinsic value (IV3, IV4) loaded with the items that measured intrinsic value in the usual manner, that is, asking about enjoyment and interest in mathematics. As such, this type of item represents a meaningful inclusion in an instrument to assess the level of intrinsic value in a task. Three cost items also showed moderately strong factor loadings on the Intrinsic value factor (CO1, .53; CO2, .61; CO5, .56). These cost items measured effort and time costs of engaging in difficult mathematics problems, in addition to having insufficient time to engage in challenging mathematics because of other activities undertaken. This would imply that, for the participants in this study, there is an association between a perception of too much effort and time required to complete harder mathematics tasks, and decreased enjoyment and engagement in these tasks. This finding illustrates an enactment of the cost-benefit appraisal fundamental to SEVT. As the amount of effort and time required for successful completion of a task becomes more onerous in relation to the amount of effort and time considered to be worthwhile, then a perception of the value of the task is said to decrease (Eccles et al., 1983). The results from this study would suggest that effort and time costs impact upon intrinsic value specifically. For example, enjoying and being interested in mathematics could be associated with a perception of being able to effectively manage the effort and time involved in the study of mathematics. In addition, Eccles and Wigfield (2020) have recently clarified that the task-specific focus of intrinsic value in SEVT places more emphasis on “situational interest” than longer-term interests. This focus on the immediate experience of a mathematics task may go some way to explain the connection between liking the task, in combination with an appraisal of the effort directly involved in the same task.
Strong factor loadings were noted for 3 items in the Attainment value factor (AV5, AV2, AV3; .79–.94), with AV4 showing a factor loading of .50. One item revealed a relatively weak factor loading of .37 (AV1). This was the item directed toward the importance of achieving highly in a mathematics task. While this item was more reflective of a typical attainment value item used in previous studies, it was the only AV item in this instrument that did not explicitly incorporate an element of the importance of being seen to be competent by others central to the conceptualization of attainment value in this study. Further empirical research may be warranted to discover if the conceptualization of attainment value as valuing one’s own competence and achievement in a domain also encompasses the importance of being seen to achieve by others in the social arena. No cost items were found to combine with AV items. It could be suggested that in constructing items to assess the dimensions of cost typically described in SEVT, that alternative cost considerations could be missed by virtue of their lack of inclusion in survey instruments. An alternative cost dimension that may capture the negative valence of attainment value could be posited as having important aspects of the self not recognized or valued by others. Such a challenge to an individual’s self-esteem and positive self-image has been described as “ego threat” (see Leary et al., 2009). According to Leary and colleagues, a person’s ego may be threatened by drawing their attention to the possibility that they may fail in a valued task in the future. This raises the possibility that a cost item that captures the psychological fear of failure, such as the “ego cost” items in the study by Jiang et al. (2018), may represent a negative pole of attainment value. However, in this study psychological cost was conceptualized as an emotional cost, that is, anxiety, that loaded alongside competence-belief items. It is possible that emotional cost items and psychological fear of failure items may represent negative poles of different aspects of value, and this is worthy of future research.
Finally, the items to measure Utility value showed moderate to strong loadings for 3 items (UV1, UV5, UV3, UV4; .69–.97). These items incorporated the relative usefulness of the higher-level mathematics courses in relation to future university mathematics course options, future careers, and to achieve personal goals. One item (UV2) showed a relatively weak factor loading (.46). This item assessed the value placed on taking two ATAR mathematics courses concurrently. It is possible that this item may have shown a higher factor loading if the words “ATAR mathematics courses” had been replaced with “higher-level mathematics courses” as the other Utility value items related specifically to these mathematics courses, or of having a high level of mathematics skills, as opposed to ATAR courses more generally. In addition, item UV2 may have captured less effectively a perception of utility value as the wording of this item reflected the relative “importance” of mathematics courses, as opposed to usefulness per se. One cost item (CO4) showed a relatively weak factor loading on Utility value (.34). This was the item to assess loss of valued alternatives as a potential consequence of taking the two higher-level mathematics courses. It is possible that this item also captured a perception of the usefulness of selecting two mathematics courses out of a finite number of courses available. Like the UV items, CO4 also had more of an extrinsic focus in that external constraints exist around how many courses can be studied concurrently, and this may have influenced the responses to this item. Furthermore, CO4 was the only other item in the survey that referred to Mathematics Methods and Mathematics Specialist courses by name in the same way as most of the UV items. While the rationale for relating the UV items to the specifically named higher-level mathematics courses was promulgated to throw light on influences on lowered enrolments in these mathematics courses explicitly, that other SEVT factors measured did not refer directly to Mathematics Methods and Mathematics Specialist specifically represents a potential limitation to the generalizability of this survey to other contexts. However, the wording of the UV items could serve as a guide for surveys investigating values in other populations.
Overall, it could be claimed that the instrument presented functioned well and offers a potentially useful method to ascertain school students’ perceptions about mathematics influential in their future course choice decisions. Furthermore, as a measure of SEVT constructs, it could be argued that the bipolar item format adopted captures with greater integrity the positive and negative valence of beliefs and values in a way that is less possible using a unipolar item format. An outcome of the present study, therefore, is that by capturing both poles of attitudes within each item, cost dimensions have emerged as less related to each other within a global, unitary cost construct than to other value constructs. It could be argued, therefore, that there is still more to do in understanding the relationship between SEVT constructs, and especially in appreciating the relation between cost and the other three components of subjective task value (Wigfield et al., 2017).
The study did have some limitations, as noted previously. In addition to these individual points, it should be noted here that further refinement of the items within the instrument could be of benefit, particularly if the instrument is to be used across a broader range of participants. In particular, while the wording of the Competence-beliefs, Intrinsic value, Attainment value, and Utility value items in this study presented distinctly negative and positive perspectives at each pole, the positive pole of some cost items represented more of a negation of negative attitudes. Therefore, the endpoints of these items could be made more distinct in future. This is unlikely, however, to have increased the similarity between the cost and other items in the survey. Furthermore, this study only focused upon mathematics motivation. The findings may not generalize to measuring motivation in other areas, including those outside school contexts. It is also important to note that motivation to pursue further studies in mathematics is likely to be a consequence of an interaction between the components of SEVT, in addition to other motivational factors, such as sense of belonging (Hwang et al., 2019; Pietri et al., 2019) and academic mindset (Degol et al., 2018; Dweck, 2006). How expectancies and values about the study of mathematics in school combine with other motivational factors to predict school-based choices and future career aspirations in STEM fields is an important area for future research (Watt et al., 2019).
Conclusion
The outcomes of this study were, first, a description of a promising instrument with good psychometric properties that may be used by school staff to investigate expectancies and values of Year 10 students about mathematics with implications for their future educational choices and career pathways in STEM. The discovery of the most influential factors on students as they make decisions about their future mathematics course selections may be useful for schools as they consider potential options to increase student enrolments in higher-level mathematics courses, such as targeted interventions to enhance competence-related beliefs and values held in relation to these courses. Second, the results of this study suggest that further investigation of the relative relationship between cost and other SEVT constructs is warranted. Wigfield and Eccles (2020) have stated that measures of motivation raise many questions about the nature of cost. The findings of this study raise two such questions. For example, should cost continue to be measured as a separate construct to other components, or should it be measured as strictly relative to values and expectancy for success? It could be argued that instruments that measure SEVT constructs in relation to each other, as opposed to separately, offer much in capturing the notion of a cost-benefit analysis integral to the conceptualization of SEVT. The status of cost as a separate factor in SEVT has received attention in the literature with Wigfield et al. (2017) suggesting that more research is required on examining the relations between constructs.
The second question is whether cost is best represented as a singular factor with a multi-faceted definition that includes effort, psychological and LoVA costs, or better represented as multi-dimensional conceptualization with distinct, although related, dimensions that interact with other aspects of values separately? While the former perspective measuring cost as an overall construct is evident within the SEVT literature, Part et al. (2020) argues that the multidimensionality viewpoint is more in line with the original definition of cost highlighting that cost dimensions are differentially related to both predictors of choice and choice outcomes. Furthermore, are there other dimensions of cost relevant to specific choices and contexts? Decisions about which dimensions of cost to include in research instruments may best be determined by the intent of the study and the meaning to be ascribed to the results. In exploring these questions further it could be argued that, “Measures that consider both the positive and negative poles for each of the specific value beliefs and costs constructs could be informative to the factor structure of subjective task value.” (Part et al., 2020, p.14). The associations between SEVT constructs represent an important area of future research in SEVT.
Footnotes
Appendix
Expectancy-Value Constructs and Items.
| Construct | Items | ||
|---|---|---|---|
| Item label | Negative pole | Positive pole | |
| Expectancy for success (competence-beliefs) | CB1 | I expect to achieve poorly in maths assignments. | I expect to achieve highly in maths assignments. |
| CB2 | I expect to do very badly in a maths task even before I’ve seen it. | I expect to do very well in a maths task even before I’ve seen it. | |
| CB3 | I feel really unsure of myself when I am doing a maths task. | I feel really confident when I am doing a maths task. | |
| CB4 | I dread receiving feedback when I have finished maths tasks. | I eagerly anticipate feedback on completed maths tasks. | |
| CB5 | I frequently doubt my maths ability. | I am very confident about my maths ability. | |
| Intrinsic value | IV1 | I hate studying maths. | I love studying maths. |
| IV2 | Maths is boring all of the time. | Maths is always fascinating. | |
| IV3 | I spend as little time as I can working on maths problems. | I enjoy working on maths problems for a long period of time. | |
| IV4 | Time passes very slowly when I am working on maths tasks. | Time appears to race by when I am working on maths tasks. | |
| IV5 | I definitely do not enjoy working on maths assignments. | Working on maths assignments is really fun. | |
| Attainment value | AV1 | Achieving highly in maths does not matter to me. | Achieving highly in maths is very important to me. |
| AV2 | Being known to be a strong maths student is not important to me at all. | I like being known to be a strong maths student. | |
| AV3 | It does not matter to me at all if others notice my maths achievements. | I really like it if my maths achievement is noticed by others. | |
| AV4 | It is not important to me whether I can solve hard maths problems that others cannot do. | I feel really proud when I can solve hard maths problems that not many other people can do. | |
| AV5 | I do not care whether others see me as good at maths or not. | It is really important to me that others see me as being very good at maths. | |
| Utility value | UV1 | Having a high level of maths skills is not necessary in my potential future job/career. | Achieving a high level of maths skills is very important in my potential future job/career. |
| UV2 | It is not important at all for me to take two ATAR maths courses. | Taking two ATAR maths courses is very important to me. | |
| UV3 | Taking higher maths courses such as Maths Methods and/or Maths Specialist will make no difference to my university course options in the future. | Taking higher maths courses such as Maths Methods and Maths Specialist provides me with many more university course options in the future. | |
| UV4 | It will not be useful at all for me to study Maths Methods and/or Maths Specialist. | Studying Maths Methods and Maths Specialist will be extremely useful for me. | |
| UV5 | It is not necessary for me to study Maths Methods and/or Maths Specialist in order to achieve my personal goals. | In order to achieve my personal goals, I will need to study Maths Methods and/or Maths Specialist. | |
| Cost | CO1 | Difficult maths problems take too much effort for me. | I can definitely manage the effort involved in doing difficult maths problems. |
| CO2 | Because of the other things I do, I definitely do not have enough time to do hard maths problems. | I will always have time to do hard maths problems, even though I have other things to do. | |
| CO3 | I feel very anxious when I am doing hard maths problems. | I feel very calm when I am doing hard maths problems. | |
| CO4 | Studying Maths Methods and Maths Specialist will prevent me from taking other courses that I would really like to study. | Studying Maths Methods and Maths Specialist will not prevent me from taking other courses that I would really like to study. | |
| CO5 | Difficult maths problems take up far too much of my time. | Difficult maths problems definitely do not take up too much of my time. | |
Author Contributions
All authors listed have made a direct and intellectual contribution to the work and have approved it for publication.
Declaration of Conflicting Interests
The author(s) declared no potential conflicts of interest with respect to the research, authorship, and/or publication of this article.
Funding
The author(s) disclosed receipt of the following financial support for the research, authorship, and/or publication of this article: This research is supported by an Australian Government Research Training Program (RTP) Scholarship.
Ethics Statement
Ethics approval for this research was obtained from the Human Ethics Office of Research Enterprise, University of Western Australia (reference RA/4/1/9365), the Government of Western Australia, Department of Education (reference D19/0438945), and the Catholic Education Office of Western Australia (reference RP2019/14).
Availability of Data
The dataset that supports the findings of this study is not openly available due to ethical restrictions.