
Abstract
This study explores the determinants of firm growth rate for small and medium-sized enterprises (SMEs) in different quantiles of the conditional growth rate distribution using data from World Bank Enterprise Surveys (WBES) covering 80 developing and emerging markets. It contributes to the literature by providing evidence of the effects of insufficiently investigated factors on firm growth. It also examines the impacts on firm growth of certain factors for which there is conflicting empirical evidence. Our quantile regression results show that firm age is negatively associated with firm growth rate throughout the entire distribution, except the lower tail. Firm size has a negative effect on growth rate in the upper tail of the distribution. We also find that the industry experience of the top manager positively impacts the growth rate only in the upper-middle range of the distribution. Product innovation positively affects firm growth rate from the lower-middle range to the highest quantile of the growth distribution. Additionally, we provide evidence that process innovation has a positive relationship with growth in the middle quantiles. SMEs that see access to financing as a more severe obstacle to their operations have lower growth rates throughout almost the entire growth distribution.
Introduction
Small and medium-sized enterprises (SMEs) constitute an overwhelming majority of private sector enterprises in the world. They make up more than 90% of all companies, provide 70% of private sector jobs, and account for 55% of GDP in developed countries (WTO, 2016). SMEs also drive a large part of the economy in developing markets. The majority of developing countries exhibit the “missing middle syndrome,” where most private firms are micro and small firms, there are few large firms among which manufacturing is concentrated, and there is a low number of medium-sized firms (UNIDO, 2006). Several studies have provided evidence of the under-representation of mid-sized firms in various developing markets (e.g., Bank of Industry, 2020; Parida et al., 2021). Market failures that lead to the missing middle syndrome inhibit production at an intermediate scale and cause low total factor productivity, which impedes economic growth. One approach that aims to explain the reason for the missing middle syndrome indicates that small firms cannot grow because they do not have access to external financing (Levy, 1991; Tybout, 2000). Another approach suggests that regulatory burdens that stifle growth cause the missing middle syndrome (Kaplinsky, 1997; Onji, 2009). Several studies in the literature argue that many micro and small firms in developing countries have limited growth possibilities because their owners establish them for self-employment and work for their firms’ survival with no objective of growth (e.g., Coad & Tamvada, 2012; Nafziger & Terrell, 1996).
SMEs’ contribution to the GDP in world economies is lower than their share in total employment because they have lower productivity than larger firms (Maksimovic & Phillips, 2002). SMEs are less productive than large firms because they cannot benefit from economies of scale, operate in labor-intensive sectors, invest in less skilled labor, and encounter difficulties in accessing external financing (Alvarez & Crespi, 2003). Growth is an important goal for SMEs because it results in productivity gains, increases the credibility of firms, helps them respond better to the demands of the market, and improves their competitiveness. Because SMEs should grow to cope with trade barriers and compete with foreign firms and cheap imports in domestic markets, analyzing SME growth determinants is an important contribution to the literature that may also help overcome the missing middle syndrome in developing countries.
Empirical studies that aim to examine the determinants of firm growth mainly focus on developed countries, and most of them have applied standard mean regression using samples drawn from a single economy. Studies of developing countries that analyze growth rate determinants also generally perform standard mean regression for single-country samples. Such studies have found that various factors including firm age, firm size, ownership concentration, and the top manager’s experience in the industry affect firm growth. The present study explores the determinants of sales growth rates for a sample of firms in developing and emerging markets with the quantile regression method for clustered data. The dataset used in this study comes from World Bank Enterprise Surveys (WBES) conducted in 80 markets in the period of 2013 to 2019. This is one of a small number of studies using quantile regression analysis to evaluate the differential effects of determinants for different quantiles of the firm growth distribution. It also adds to the literature by providing evidence of the impacts on firm growth rate of inadequately explored factors such as the top manager’s industry experience and competition in the informal sector. Moreover, the roles in firm growth of certain determinant factors for which empirical evidence is contradictory, such as ownership concentration and product innovativeness, are analyzed. Data are collected from a multi-country sample that allows us to control for country-specific characteristics that can affect firm growth rate. The findings show that whether a determinant affects growth rate or not varies across different quantiles of the growth distribution. Moreover, we find that determinants of firm growth can change for excessively low-growth and excessively high-growth firms.
The remainder of this paper is organized as follows: Section 2 provides a review of the related literature. Section 3 describes the research methodology used in the study and Section 4 presents the dataset. Empirical results are reported in Section 5 and concluding remarks are offered in Section 6.
Determinants of Firm Growth
We draw on empirical studies examining the factors that affect firm growth rates to put forward the potential determinants of firm growth.
Firm-Level Determinants of Firm Growth
Firm Age
Firm age is expected to affect firm growth rate because of the learning process through which firms learn about their efficiency levels over time. Jovanovic (1982) argues that because younger firms face higher uncertainty about their efficiency levels, their employment level updates are more substantial and their growth rates are higher. In connection to this, Ericson and Pakes (1995) indicate that younger firms should exhibit higher growth rates because firms do not continue their investments after reaching a certain level of efficiency. Cooley et al. (2004) also suggest that younger firms grow faster because their flexibility helps them adopt new technologies. Several recent studies in the literature provide evidence supporting these older works and show that firm age has a negative relationship with firm growth rate (e.g., Bai et al., 2020; Habersetzer et al., 2019). In their study using quantile regression, Barba Navaretti et al. (2014) find a negative relationship between firm age and firm growth for firms with positive growth. They argue that the negative relationship between firm age and growth rate for firms with positive growth arises from the learning process. They also find no relationship between age and growth for downsizing firms, suggesting that negative growth is caused by factors that play a role in contraction rates independently of the age of the firm. Relatedly, Reichstein et al. (2010) apply quantile regression analysis to show that while firm age has a positive effect on shrinking firms’ growth rates, it has a negative effect on the growth rates of fast-growing firms. Their findings suggest that firm age has a moderating effect on firm growth. Among studies of developing countries, Arkolakis et al. (2018), Nizaeva and Coskun (2019), and Yang and Tsou (2020) provide evidence that firm age has a negative relationship with growth rate. Trinh and Doan (2018) and Simbana-Taipe et al. (2018) show that firm age has a negative effect on firm growth in all quantiles of the growth distribution in their studies of developing markets based on quantile regression.
Firm Size
The discussion of the relationship between firm size and firm growth in the literature emerged with Gibrat’s law, also known as the law of proportionate effect. This law defined by Gibrat (1931) states that firm growth follows a random walk and proportional changes in firm size do not depend on a firm’s absolute size. Several studies questioning Gibrat’s law show a negative relationship between firm size and firm growth rate (e.g., Dunne et al., 1989; Evans, 1987; Fariñas & Moreno, 2000), and more recent studies report the same finding (e.g., Bai et al., 2020; Habersetzer et al., 2019). These studies generally suggest that small firms have higher growth rates because they have more growth opportunities than large firms. They also indicate that small firms should exhibit high growth to attain the minimum efficient production scale for survival. In a study based on quantile regression analysis, Reichstein et al. (2010) show that while firm size has a positive relationship with growth rate for firms with negative growth, it has a negative effect on firm growth for high-growth firms. Their findings suggest that firm age has a moderating effect on firm growth. On the other hand, Serrasqueiro et al. (2010) show no relationship between firm size and growth rate for shrinking firms, providing support for Gibrat’s law. These authors also find that size has a negative impact on firm growth for firms with positive growth, suggesting that small firms should have high growth to achieve the minimum efficient scale. Among studies of developing countries, Arkolakis et al. (2018) and Goel and Nelson (2021) show that firm size has a negative effect on firm growth. However, Nizaeva and Coskun (2019) find that larger firms have higher growth rates. Stancu et al. (2021) and Zhu et al. (2021) provide evidence that smaller SMEs have higher growth rates in all quantiles of the growth distribution in developing markets.
Ownership Concentration
Ownership concentration is expected to affect firm growth because it is considered a mechanism that curbs the agency problem between shareholders and managers through better monitoring of managers (Shleifer & Vishny, 1986). Diffused ownership can negatively affect the growth rate of a firm because managers of firms with diffused ownership can use the firm’s resources to pursue their interests (Lskavyan & Spatareanu, 2006). However, several studies in the literature argue that a high level of monitoring resulting from concentrated ownership can negatively affect firm performance by reducing managerial initiative and discretion (e.g., Burkart et al., 1997; Pagano & Roell, 1998). In a recent study of a developing market, Nguyen et al. (2018) provide evidence that concentrated ownership positively affects firm growth. They argue that large shareholders may require high growth to obtain immediate benefits. Pham and Nguyen (2017) also report a positive relationship between ownership concentration and growth rate in a developing market. On the contrary, Moreno and Castillo (2011) find that having diffused ownership positively affects the growth rate while providing support for the argument that diffused ownership positively affects firm growth by increasing managerial initiative.
Top Manager’s Experience in the Industry
The industry experience of a firm’s top manager is regarded as one of the factors that contribute to firm growth. The “Penrose effect” (Penrose, 1959) indicates that a lack of the necessary management skills for effective resource management to create firm capabilities is an essential constraint for the growth of those firms. The absence of the necessary managerial abilities can lead to the mishandling of resources and failure in proper financial management that would otherwise support firm growth (Stenholm & Toivonen, 2009). In connection to this, Baum et al. (2001) indicate that managerial abilities are required to identify growth opportunities and to develop strategies to benefit from them. Nichter and Goldmark (2009) argue that the extent of the manager’s experience should positively affect firm growth because managers increase business contacts and acquire knowledge and skills through experience. In their empirical study, Bosma et al. (2004) show that an entrepreneur’s experience in a firm’s industry positively affects firm growth rate. They argue that investment in industry-specific human capital improves firm performance. Similarly, Wiklund and Shepherd (2003) provide evidence that having an experienced manager magnifies the positive effect on firm growth of intention to grow and they suggest that firms with experienced managers grow because experienced managers make appropriate decisions that support growth. However, Goel and Nelson (2021) show that firms with more experienced managers have lower growth rates in their study of developing markets. They argue that the low agility of experienced managers may negatively affect firm growth.
Facing Constraints in Access to Financing
Access to financing is expected to affect firm growth rate because it is one of the firm-specific capabilities that firms should have to react to growth opportunities (Stenholm & Toivonen, 2009). Rahaman (2011) indicates that firms with difficulties accessing external financing may not grow because they cannot follow optimal investment policies. In connection to this, Cooley et al. (2004) argue that financial constraints decrease investments in new technologies and negatively affect firm growth. Various studies in the literature show that financing constraints have a negative impact on growth rates (e.g., Becchetti & Trovato, 2002; Beck et al., 2005). Relatedly, Lopez-Garcia and Puente (2012) show that access to financing positively affects the probability of being a high-growth firm and argue that internal cash flows are insufficient to finance high growth. Among studies of developing countries, Ghosh (2009) and Nizaeva and Coskun (2019) provide evidence of a negative relationship between financing constraints and firm growth. Ayyagari et al. (2010) argue that while using informal financing channels does not affect firm growth, bank financing positively impacts growth rates in developing markets. They suggest that informal financing sources cannot substitute for formal financing channels because of their weaker enforcement mechanisms. Slimane and Baghdadi (2019) demonstrate that the inability to access financing negatively affects firm growth in all quantiles of the growth distribution except the highest quantile in their study of developing countries based on quantile regression analysis.
Product and Process Innovation
Innovativeness is regarded as one of the factors that affect firm growth rate. Firms are expected to gain a sustainable competitive advantage through innovation that will help them grow with an increase in their market share (Colombelli et al., 2013). Herstad and Sandven (2015) state that innovativeness can affect growth rates because of the capacity adjustments made to answer market demand. Moreover, knowledge accumulation may lead to subsequent innovations that will also affect market demand and firm growth. Both earlier and more recent studies in the literature show that innovativeness positively influences firm growth rates (e.g., Cainelli et al., 2006; Coad et al., 2016; Martínez-Alonso et al., 2020). Colombelli et al. (2013) provide evidence that both process and product innovation positively affect firm growth and argue that firms transform new knowledge into growth through innovativeness. On the other hand, Triguero et al. (2014) show that although process innovation has a significant positive effect on firm growth, product innovation does not have any relationship with growth rate. In a related study, Coad and Rao (2008) show that innovativeness is positively associated with sales growth for only high-growth firms. Their finding suggests that only firms that launch successful innovations will have high growth rates. Among studies of developing markets, Vo-Thai et al. (2021) show that innovativeness positively affects firm growth. Moreover, An and Zhang (2021) provide evidence that government support for innovation positively affects the survival and growth of SMEs. In a study based on quantile regression analysis, Ahn et al. (2018) find that innovation activities have larger positive effects on firm growth for high-growth firms than low-growth firms. On the other hand, Simbana-Taipe et al. (2018) find that innovativeness has a negative effect on firm growth in the lower quantiles of the growth distribution and a positive effect in the higher quantiles. They argue that the negative relationship between innovativeness and growth rate in the lower quantiles may be the result of insufficient innovation management by firms in this part of the distribution.
Competition From Informal Firms
Competition with informal firms is expected to be one of the factors affecting firm growth rate. Informal firms remain in business with the help of the cost advantages that result from bypassing regulations and taxes. According to the parasite view, firms in the informal economy harm economic growth because they create unfair competition and take away market share from formal firms (Castells & Portes, 1989). Losing market share to informal firms negatively affects the growth rate of formal firms. Relatedly, Farrell (2004) indicates that because informality in an economy negatively affects tax revenues, governments increase the corporate tax rates on formal businesses’ incomes. Consequently, higher tax rates reduce the after-tax income of formal firms, which cannot invest in productivity-improving technologies and have lower growth rates. In a recent study, Amin et al. (2020) state that competition from the informal sector corrodes formal firms’ resources that can be used to enhance productivity. Providing support for these arguments, Goel and Nelson (2021) and Williams and Bezeredi (2018) show that the growth rate of firms that compete with informal firms is lower than that of firms that do not have informal competitors in developing markets. Dinh et al. (2012) also find that competition from informal firms is an important constraint to firm growth in developing countries.
Country-Level Determinants of Firm Growth
Several studies in the literature analyze whether certain country-level variables capture the variation among countries regarding firm growth. Miroshnychenko et al. (2019) show that the GDP per capita of the country, considered to capture the development level, positively affects firm growth rate. On the other hand, while Dabla-Norris and Inchauste (2007) provide evidence that GDP per capita has a negative relationship with firm growth, Beck et al. (2005) do not find a connection between these variables. Furthermore, several studies provide evidence that the level of financial development of the economy, which can be proxied with the domestic credit provided by the financial sector expressed as a percentage of GDP, has a positive effect on firm growth rate (e.g., Bas & Berthou, 2021; Mugova, 2017; Tran et al., 2020). A country’s inflation rate is expected to negatively affect firm growth rates because the cost of capital, which affects production costs and levels of investments, increases with the inflation rate. Relatedly, Ayyagari et al. (2016) and Ipinnaiye et al. (2017) provide evidence that inflation harms firm growth.
Methodology
Multiple regression analysis that investigates the average firm’s growth rate determinants provides an imperfect picture because the relationship between the determinants and the growth rate may change across the full distribution of firm growth (Coad & Rao, 2008). In this study, we apply the quantile regression method to estimate the coefficients of the independent variables in different quantiles of the conditional distribution of growth rate. The quantile regression method also gives us an opportunity to see whether the impact of growth determinants is different for firms with negative and positive growth.
Following Koenker and Bassett (1978), the quantile regression model used is as follows:

where Yi represents the growth rate of firm i, α0 is a constant, Xi stands for a vector of independent variables, and β (p) is a vector of parameters for the pth quantile. Coefficient estimates of quantile regression analysis are found by minimizing the sum of absolute deviation residuals given as follows:

Following Parente and Santos Silva (2016), our quantile regression model with clustered standard errors can be given as follows:

where g represents the set of g clusters with n elements. Our analysis clusters the standard errors by country because unincluded country characteristics can cause correlated error terms for firms within countries. It should also be noted that the Parente-Santos Silva test for intra-cluster correlation is statistically significant for all quantiles (p < .01).
The factors that affect firm growth rate are analyzed with the following empirical model:

Following Aterido et al. (2011) and Haltiwanger et al. (2010), the dependent variable of Firm Growth Rate is captured with the following measure of real annual growth rate:

where Sit and Sit-3 denote the real annual sales for firm i in years t and t−3. This growth measure bounds the firm growth rate so that the skewness created by outliers is mitigated (Ayyagari et al., 2016). The real annual sales values are found by deflating yearly sales values to 2009 prices using GDP deflators.
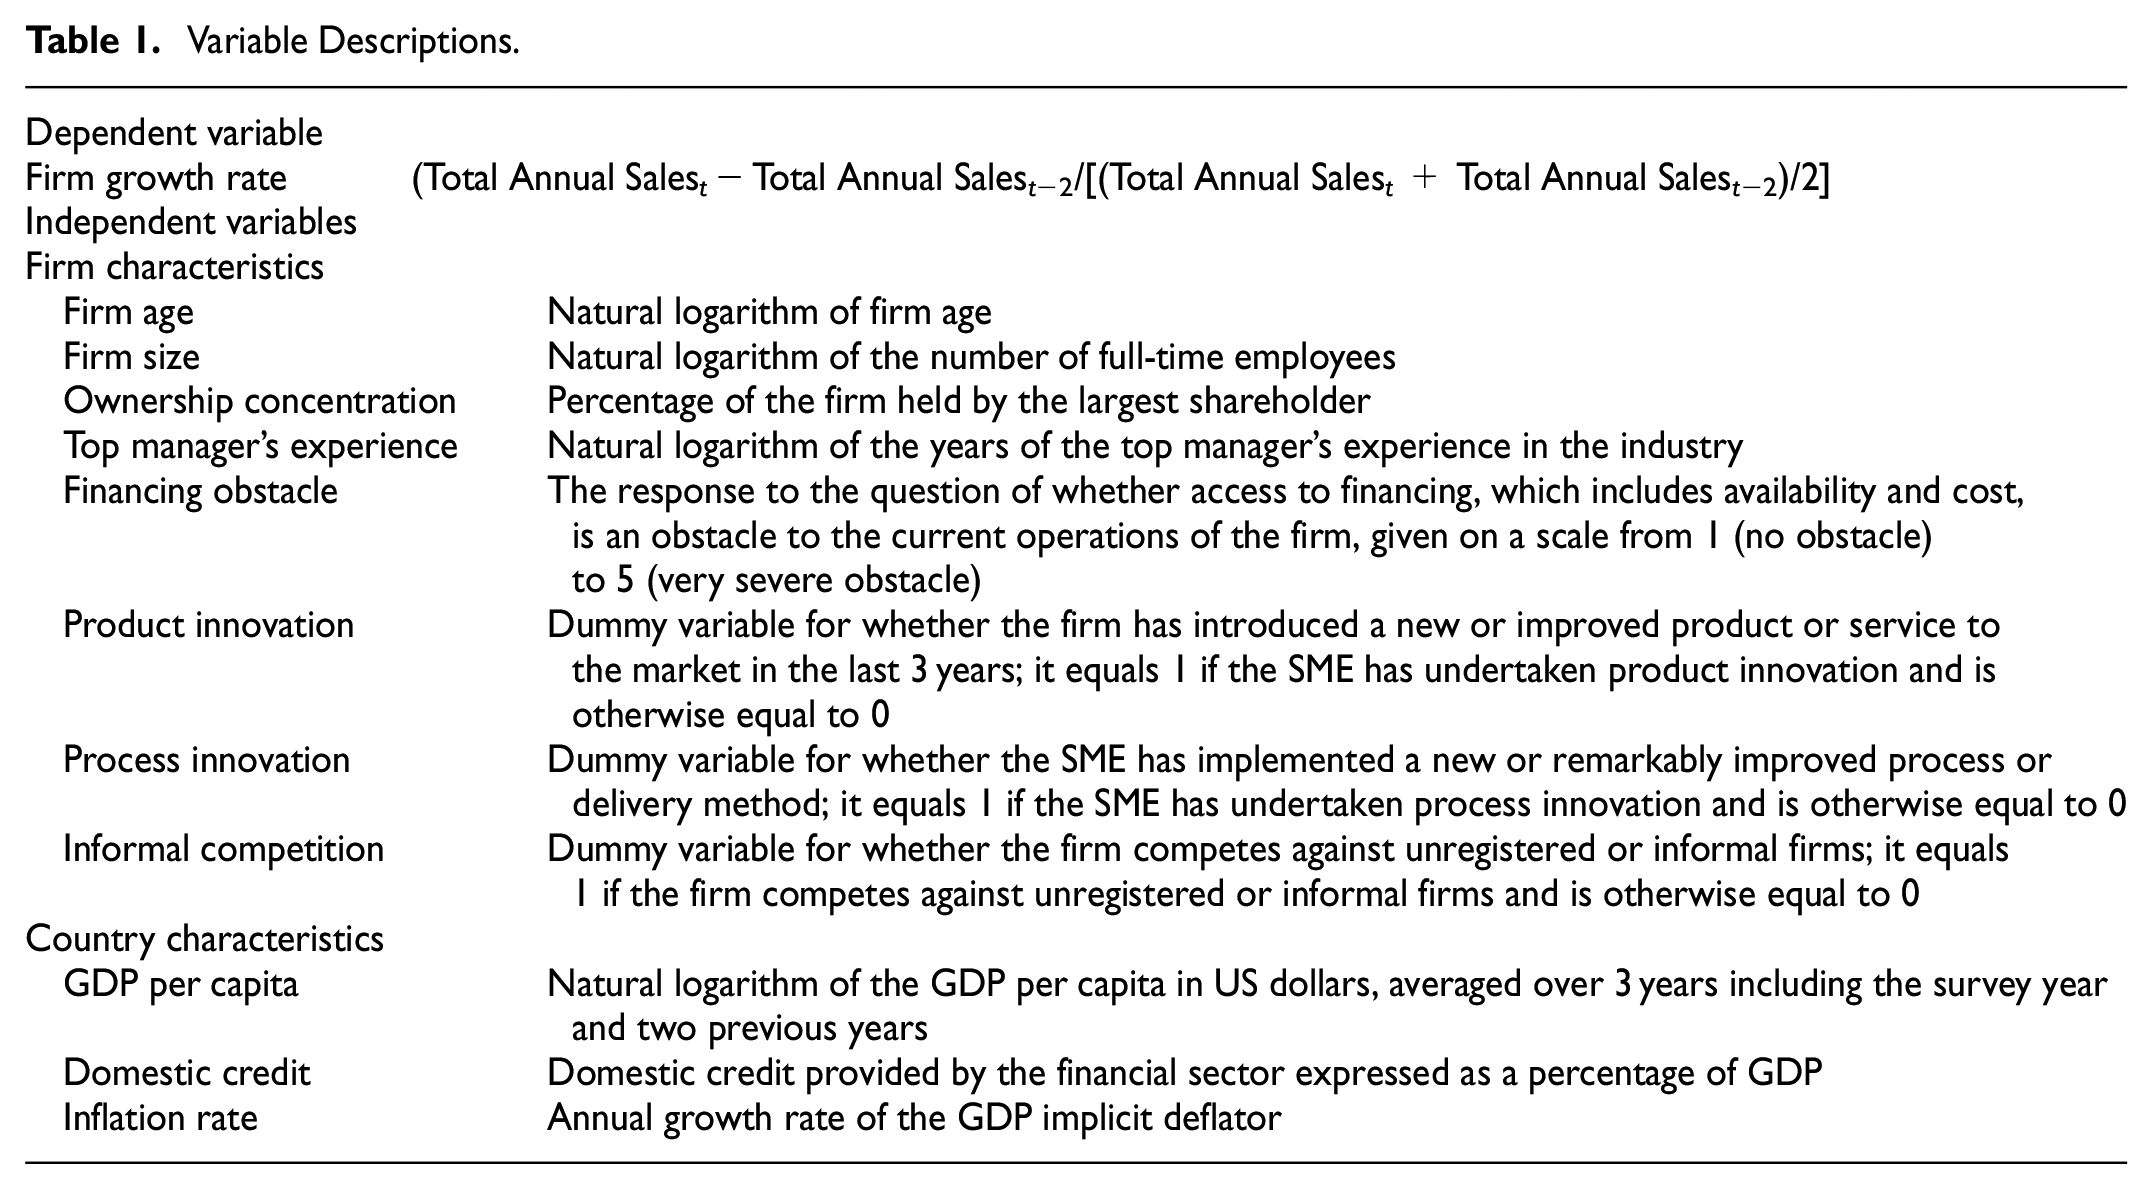
Among the potential determinants of firm growth rate, Firm Age represents the natural logarithm of firm age. Firm Size stands for the natural logarithm of the number of full-time employees. Ownership Concentration is the percentage of the firm held by the largest shareholder. Top Manager’s Experience represents the natural logarithm of the years of the top manager’s experience in the industry. Financing Obstacle is the answer to the following question: “Is access to financing, which includes availability and cost (interest rates, fees, and collateral requirements), an obstacle to the current operations of this establishment?” These answers may be 1 (no obstacle), 2 (minor obstacle), 3 (moderate obstacle), 4 (major obstacle), or 5 (very severe obstacle). Product Innovation is a dummy variable for whether the firm has introduced a new or improved product or service to the market in the last 3 years. This dummy variable is equal to 1 if the SME has undertaken product innovation; otherwise, it is equal to 0. Process Innovation is a dummy variable for whether the SME has implemented a new or remarkably improved process or delivery method in the last 3 years. This dummy variable is equal to 1 if the SME has undertaken process innovation; otherwise, it is equal to 0. Informal Competition is a dummy variable for whether the firm competes against unregistered or informal firms. This dummy variable equals 1 if the firm faces informal competition; otherwise, it equals 0. Industry and Country are dummy variables for the industry and the country in which the firm operates. Year is a dummy variable for the year in which the survey is conducted.
In the second part of the analysis, we run the model by replacing the country dummies with the country-level variables that may affect firm growth rate. The new estimator is as follows:

Country-level variables are obtained from World Bank Open Data. They are averaged over 3 years, including the year for which the employment growth rates are computed for each country and the previous 2 years. GDP represents the natural logarithm of GDP per capita of the country in constant US dollars. Domestic Credit stands for domestic credit provided by the financial sector expressed as a percentage of GDP. Inflation Rate represents the annual growth rate of the GDP implicit deflator.
Table 1 presents descriptions of the variables used in the empirical model.
Variable Descriptions.
Data
The empirical model is estimated with firm-level data obtained from WBES conducted in 2013 to 2019. The cross-country sample includes 32,288 SMEs from 80 developing and emerging markets. We use data from surveys conducted in different years to improve the richness of our dataset. Furthermore, by conducting a multi-year study and controlling for year effects, we can account for effects that are constant across firms but change over time. We select 2013 as the first survey year from which we draw data because we want to eliminate the effect of the 2007 to 2008 financial crisis on firm responses. We select 2019 as the final survey year because WBES data collected after 2019 primarily describe the effects of the COVID-19 pandemic on firms. The SMEs in this sample employ between 5 and 250 people; 24,537 of the firms are small firms with 5 to 50 employees and 7,751 are medium-sized firms with 51 to 250 employees. Descriptive statistics of the variables used in the empirical analysis are presented in Table 2.
Descriptive Statistics (Pooled Sample).
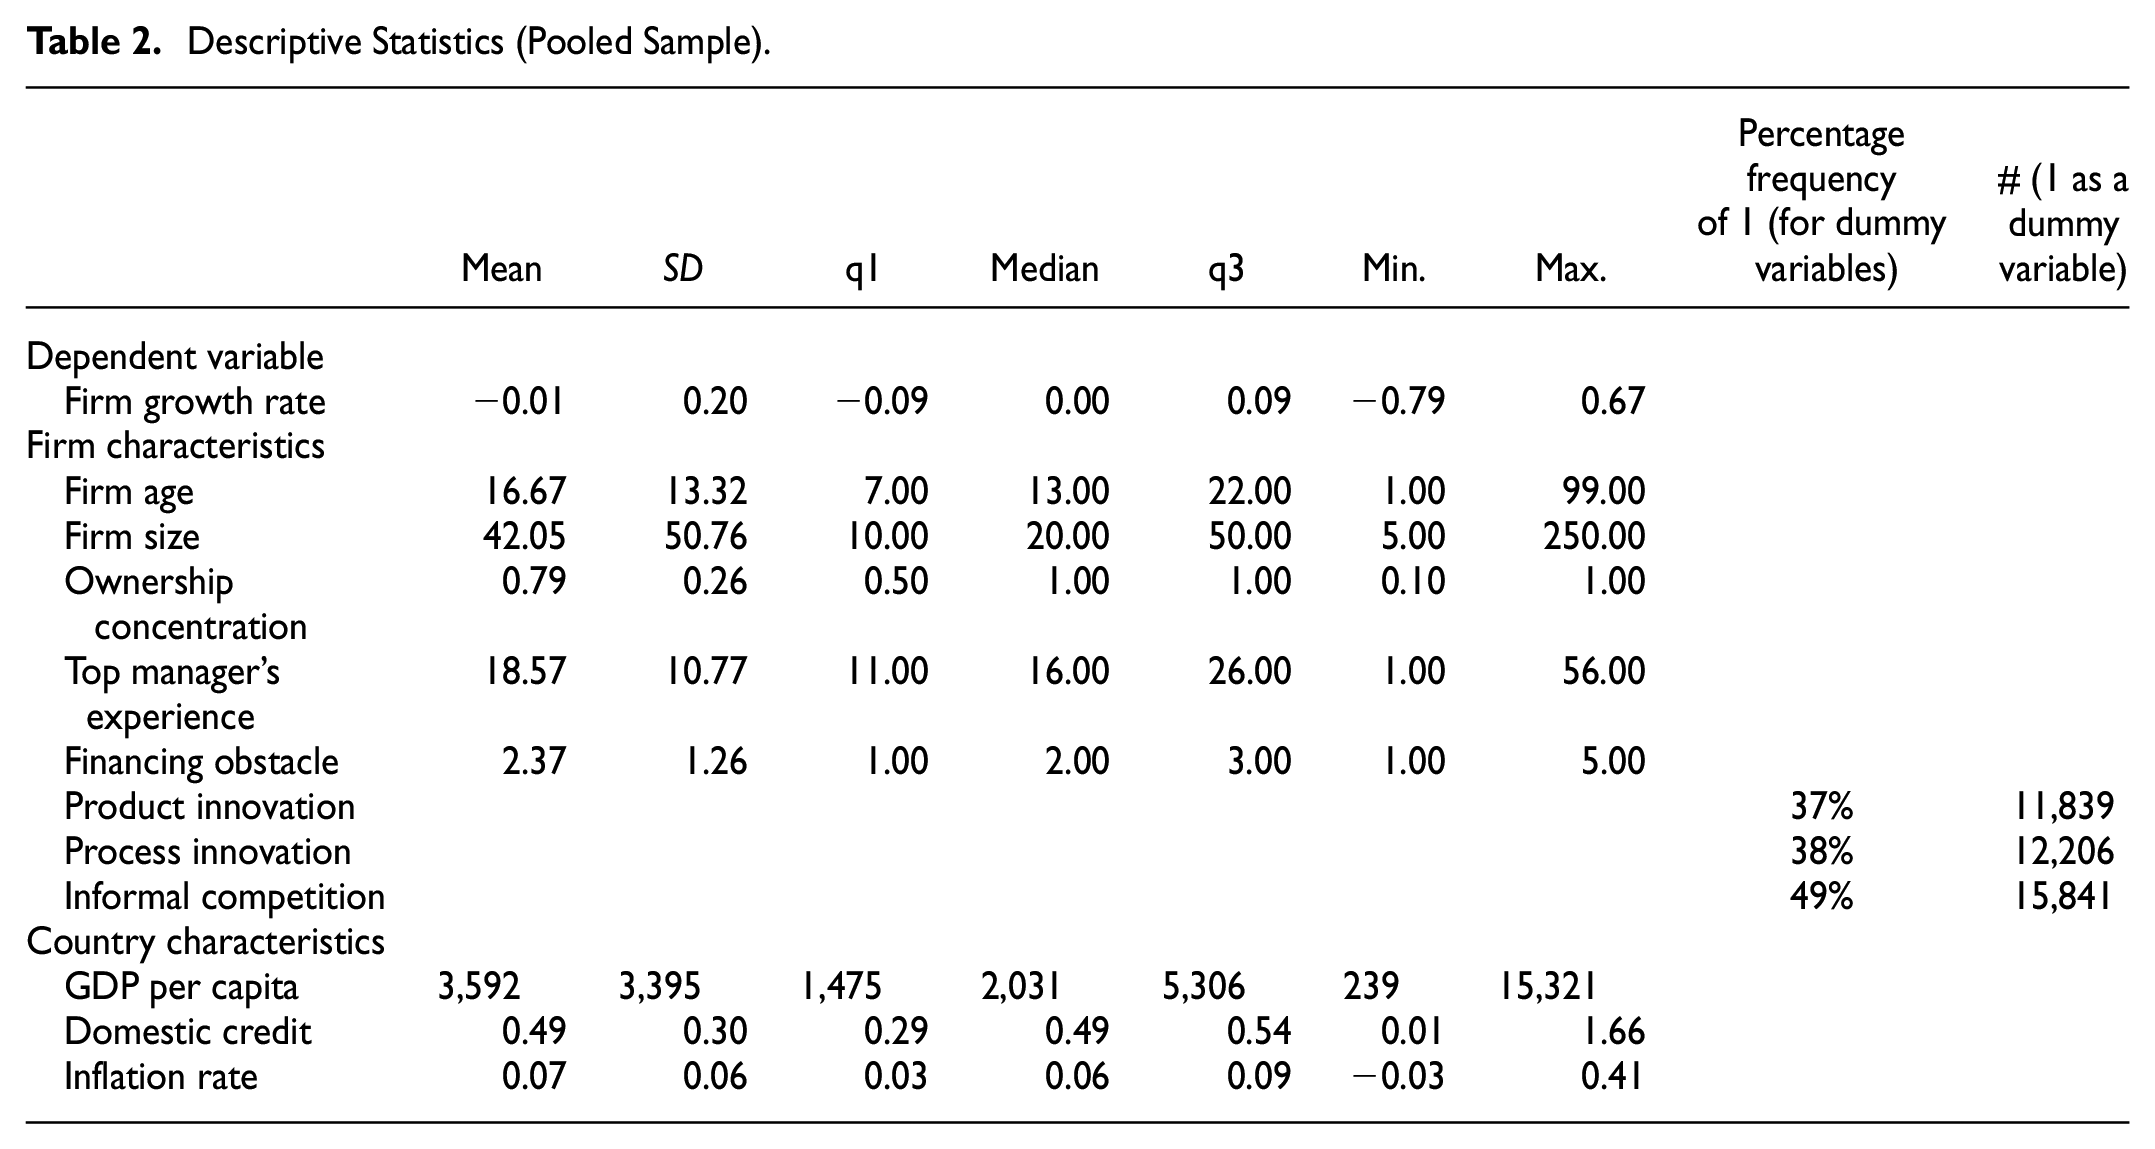
Table A1 in the Appendix lists the countries included in the sample and the number of firms from each country. The correlation matrix of the independent variables and variance inflation factor (VIF) values for the pooled sample are given in Table 3. A VIF value exceeding 10 shows problematic multicollinearity in the dataset (Hair et al., 2018). Because the VIF value of our independent variables is below 10, we can say that multicollinearity is not a potential problem in our dataset. Small bivariate correlation coefficients are similarly not indicative of multicollinearity in the data.
Correlation Matrix and VIF Values for the Pooled Sample.

Note. Statistical significance at 1% level is denoted by *.
Empirical Results
Table 4 presents the cluster-robust ordinary least squares (OLS) regression estimates and quantile regression estimation results with clustered standard errors. The visual representation of the quantile regression estimations provided in Figure 1 shows that coefficient estimates for the independent variables change over the conditional distribution of firm growth rate.
OLS and Quantile Regression Estimates for Firm Growth Rate.

Note. Standard errors are given in parentheses. Statistical significance at 1%, 5%, and 10% levels is denoted by ***, **, and *, respectively.
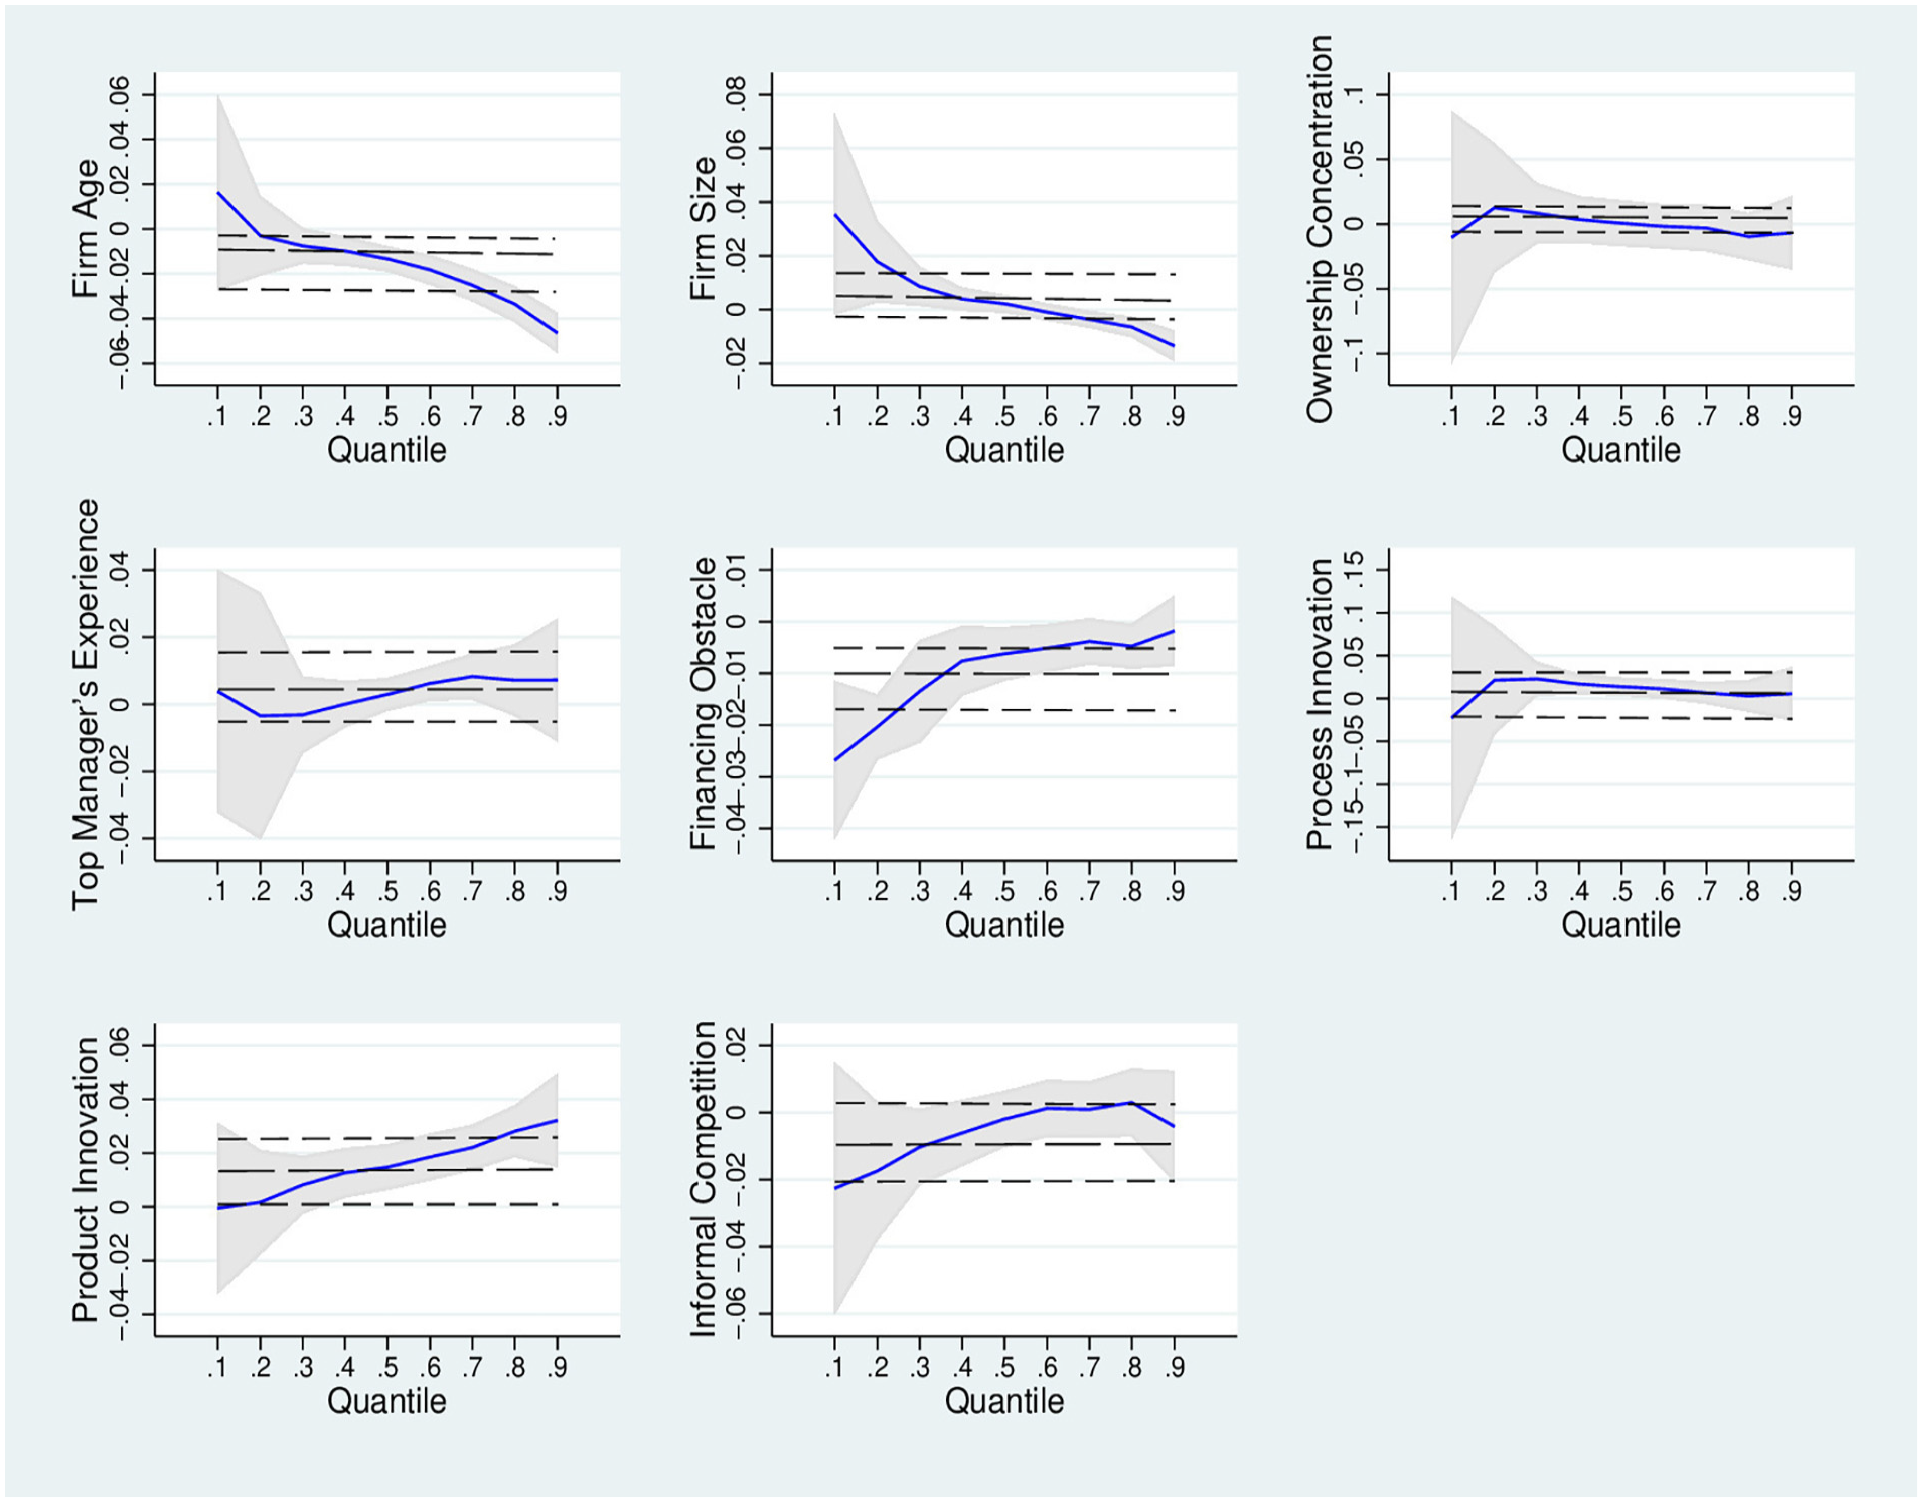
Quantile Regression Estimates.
The OLS regression results reveal that Firm Age has a statistically significant negative relationship with growth rate. The finding that younger firms have higher growth rates is consistent with the conclusions of Jovanovic (1982), Ericson and Pakes (1995), and Cooley et al. (2004). The statistically significant negative coefficient of Financing Obstacle shows that SMEs that report lower levels of financing obstacles have higher growth rates. This finding is in line with the arguments of Rahaman (2011) and Cooley et al. (2004), who demonstrate that firms encountering financing constraints cannot grow because they are unable to undertake the required investments.
The regression results further reveal that the Product Innovation dummy variable has a statistically significant positive coefficient. This shows that firms that introduce product innovation have a higher growth rate than firms that do not implement such innovations, in line with previous results reported by, for example, Coad et al. (2016), Martínez-Alonso et al. (2020), and Colombelli et al. (2013). The OLS regression estimates also show that Firm Size, Ownership Concentration, Top Manager’s Experience, Process Innovation, and Informal Competition are not significantly related to a firm’s growth rate.
Quantile regression estimations show a different picture for some of our independent variables. We see that Firm Age has a statistically significant negative effect on growth rate in all quantiles of the conditional distribution except the lowest two quantiles. This finding supports the arguments of Jovanovic (1982) and Ericson and Pakes (1995) that firms have less growth as they get older because they reach a certain level of efficiency and prefer not to invest anymore thereafter. The finding that Firm Age negatively affects growth for shrinking firms from the 0.30th quantile to the median shows that older firms experience larger sales revenue declines than younger firms. This suggests that older firms that do not invest experience more negative growth than younger firms in this part of the distribution. The absence of a statistically significant relationship between Firm Age and Firm Growth Rate for SMEs in the 0.10th and 0.20th quantiles suggests that younger firms with high negative growth cannot use their flexibility to improve their performance. These results provide partial support for the findings of Barba Navaretti et al. (2014) and Reichstein et al. (2010). They also do not provide full support for the findings of Trinh and Doan (2018) and Simbana-Taipe et al. (2018) in studies of developing markets.
We see that Firm Size has a positive effect on firm growth up to the median. However, it has a negative impact on growth rate in the upper tail starting from the 0.70th quantile. The findings show that the growth rate of larger firms that are below the median is better (less negative) than that of smaller firms. On the other hand, larger firms in the upper quantiles have lower growth rates than smaller firms. Being a large firm can positively affect firm growth among the shrinking firms because large firms have better access to external financing, more internal funds, and a more extensive customer base. However, small firms in the upper range of the distribution may have higher sales growth than large firms because they aim to achieve the minimum efficient production scale to survive. Having higher growth opportunities may also positively affect the sales growth rates of small firms. These results support the findings of Reichstein et al. (2010). They also provide partial support for the findings of the studies of Stancu et al. (2021) and H. Zhu et al. (2021) in developing markets.
Top Manager’s Experience has a statistically significant positive effect on firm growth only in the 0.60th and 0.70th quantiles. The experience of the manager does not affect the firm growth rate of shrinking firms. This suggests that strong management skills cannot reverse the process of negative growth. Moreover, the finding that Top Manager’s Experience does not affect firm growth in the 0.80th and 0.90th quantiles suggests that growth rates are not affected by managerial abilities in this part of the distribution. These firms may have previously benefited from their top managers’ management skills to achieve their growth rates.
Financing Obstacle has a statistically significant negative relationship with firm growth in all quantiles of the growth distribution except the 0.70th and 0.90th quantiles. These findings show that SMEs that see access to financing as a more severe obstacle to their operations have lower growth rates throughout almost the entire growth distribution, suggesting that financing constraints prevent investments in new technologies. Being able to access financing also leads to less negative growth for shrinking firms. These results are in line with those of previous studies, such as those reported by Becchetti and Trovato (2002), Beck et al. (2005), and Ghosh (2009). They also provide support for the study of developing markets conducted by Slimane and Baghdadi (2019).
Product Innovation has a statistically significant positive relationship with firm growth rate as we move from the 0.40th quantile to the 0.90th quantile. This finding suggests that a competitive advantage created by introducing product innovation positively affects firm growth for positively growing firms. Moreover, introducing product innovation lowers the decline in sales revenue of firms in the 0.40th quantile, which experience lower levels of contraction than other shrinking firms. Product innovation does not affect growth rates in the 0.10th, 0.20th, and 0.30th quantiles that have higher negative growth rates. These results support the findings of the studies of developing markets conducted by Ahn et al. (2018) and Simbana-Taipe et al. (2018) to a limited extent.
Process Innovation has a positive effect on firm growth from the 0.30th to the 0.60th quantile. This variable does not have a statistically significant relationship with growth rate in the other quantiles. These findings show that introducing process innovation creates a competitive advantage for SMEs with positive growth in only the 0.60th quantile. It also lowers the decline in the sales revenues of shrinking firms from the 0.30th quantile to the median. These findings suggest that process innovations do not improve the growth performance of high-growth firms. Moreover, introducing process innovation does not affect the growth rates of the firms with the highest negative growth rates. These results support the findings of Ahn et al. (2018) and Simbana-Taipe et al. (2018) for developing markets to a limited extent.
Informal Competition has a statistically significant negative relationship with growth rate in only the 0.20th and 0.30th quantiles. These results show that the growth rates of firms with positive growth are not affected by competition from informal firms and suggest that informal competition does not lower the growth rates of positive-growth firms by subtracting from these firms’ market shares. Moreover, informal competition does not harm shrinking firms’ growth rates in the 0.10th quantile, the 0.40th quantile, and the median of the growth distribution.
Table 5 shows the quantile regression results when country-level variables are included in the analysis instead of country dummies. This analysis can be considered as a robustness check for the quantile regression estimations. We see that the findings for firm-specific variables are similar for the two groups of results. We also find that Inflation Rate has a statistically significant negative impact on firm growth for firms in the 0.20th quantile, the 0.40th quantile, and all quantiles above the median. Furthermore, GDP and Domestic Credit are not significantly related to the firm growth rate in any of the quantiles. The results for Inflation Rate suggest that inflation harms the growth rate of firms by increasing production costs and lowering investments through an increase in the cost of capital. The level of inflation may also negatively affect the growth rate by adversely influencing the ability to obtain long-term bank loans for investments. Moreover, a reduction in after-tax profits caused by higher interest expenses may lower the investments and negatively affect firm growth. Inflation can also curtail capital investments by decreasing the real value of depreciation allowances based on historical costs and increasing the cost of investments.
OLS and Quantile Regression Estimates for Firm Growth Rate With Country-Level Variables.

Note. Standard errors are given in parentheses. Statistical significance at 1%, 5%, and 10% levels is denoted by ***, **, and *, respectively.
As a robustness check, we repeat the quantile regression analysis using the following average annualized measure of real growth rate given by Eurostat-OECD (2007) as the dependent variable:

where Sit and Sit-3 show the real annual sales for firm i in years t and t−3. The results of quantile regression analysis remain similar after the change in the dependent variable.
Conclusion
This paper brings new insights into the factors that affect firm growth along the entire growth rate distribution in developing and emerging markets. To this end, we used cross-sectional data drawn from WBES conducted in 80 developing and emerging economies in the period of 2013 to 2019. We adopted the quantile regression method to comprehensively analyze the determinants of firm growth rate in different quantiles of the conditional growth rate distribution. Contrary to the findings of other studies of developing markets, we have found that firm age and firm size do not affect firm growth rate in all quantiles of the growth rate distribution. Although several studies of developing markets have found a positive relationship between ownership concentration and firm growth, we did not find such a relationship in any of the quantiles of the growth rate distribution in our research. We have also provided support for studies finding that SMEs that have better access to bank financing have higher growth rates in developing markets. Moreover, our results partially support studies that find a positive relationship between innovativeness and growth rate in developing markets. Contrary to findings that facing competition from informal firms has a negative effect on firm growth in developing countries, we have found that the growth rate of positive-growth firms is not affected by informal competition.
The findings of this study have crucial policy and managerial implications for firms with growth rates in different quantiles. First and foremost, because access to external financing is an essential constraint to SME growth in almost all quantiles of the growth distribution, SMEs that plan to grow should aim to improve their access to bank financing by understanding the lending criteria of banks and trying to satisfy those criteria. SME owners and managers should also aspire to improve their accounting and financial literacy to understand the loan requirements of banks better. Moreover, governments should more actively stimulate the SME sector’s growth through interventions such as loan guarantee schemes, state bank initiatives, and funded financing facilities that aim to improve SMEs’ access to financing. They should also support the use of loan screening mechanisms that promote collateral-free lending.
The finding that product innovation has a positive relationship with growth rate starting from the first quantile before the median up to the highest quantile shows that SMEs in this part of the distribution should find innovative ways to design their products and services to grow. Moreover, the finding that process innovation positively affects firm growth in the middle range of the growth distribution suggests that SMEs whose growth rate is in this part of the distribution should aim to create more effective innovative processes to grow. In general, creating a culture of innovation should be a part of the competition strategies of SMEs. Governments should also pursue policies that aim to promote innovation among SMEs to support growth. They can foster the innovativeness of SMEs by creating a sound business environment that supports innovation, providing incentives for R&D investments, supporting the development of skills and resources necessary for innovations, and improving the access of SMEs to financing.
The finding that the top manager’s years of industry experience positively affect the growth rate in the upper-middle range of the growth distribution suggests that SMEs in this part of the distribution can hire top managers experienced in the relevant industry to improve their growth rates. Managers with long-term industry experience can contribute to firm growth by predicting industry trends, evaluating business opportunities and risks more effectively, and accelerating decision-making. Hiring within-industry managers will also help growing firms cope with the rise in complexity that creates new requirements such as developing new capabilities and acquiring new resources.
The finding that the growth rate of firms in the second and third lowest quantiles is negatively affected by competition from informal firms suggests that government policies aiming to address the reasons for informality are critical for the growth of contracting SMEs. Because informality in an economy hurts economic growth by eroding the incentives to innovate and invest, government bodies should aim to simplify the onerous tax, product, and labor regulations that encourage firms to operate informally. In addition to decreasing the degree of regulation, decreasing the costs of joining the formal sector, reducing taxes, and improving the access of formal firms to bank loans can also motivate firms to operate formally.
The finding that a high inflation rate is a significant constraint for SME growth for both negative-growth and positive-growth firms offers an important policy implication for governments. Lowering the inflation rate and making it more predictable is expected to support firm growth by increasing investments due to a reduction in the uncertainty about returns from investments. Moreover, a low and predictable inflation rate promotes investments by lowering the interest rates through a reduction in inflation risk premiums. Price stability is also self-reinforcing because it creates a low inflation rate expectation.
This research has some limitations that should be acknowledged. First, the data drawn from WBES did not include firms that had exited the market and conducting analysis for only surviving firms is a limitation of this study. The other significant limitation of the study is that since the firms’ financial statements were not available, we could not include any financial variables in our quantile regression analysis. Future studies could use alternative datasets that include financial variables. Moreover, we analyzed the effect of innovativeness on firm growth with only dummy variables due to data availability. Future research could investigate the impact of innovation on growth rates by taking total spending on R&D as a continuous variable in the analysis.
Footnotes
Appendix
Country List and the Number of Firms in Each Country.

| Year of enterprise survey | Number of firms | |
|---|---|---|
| Albania | 2019 | 215 |
| Argentina | 2017 | 555 |
| Armenia | 2013 | 163 |
| Azerbaijan | 2013 | 121 |
| Bangladesh | 2013 | 1,020 |
| Belarus | 2018 | 405 |
| Benin | 2016 | 96 |
| Bhutan | 2015 | 147 |
| Bolivia | 2017 | 116 |
| Bosnia and Herzegovina | 2019 | 194 |
| Bulgaria | 2019 | 331 |
| Burundi | 2014 | 107 |
| Ivory Coast | 2016 | 163 |
| Cambodia | 2016 | 213 |
| Cameroon | 2016 | 174 |
| Chad | 2018 | 111 |
| Colombia | 2017 | 648 |
| Croatia | 2019 | 351 |
| Dominica Republic | 2016 | 128 |
| Democratic Republic of the Congo | 2013 | 224 |
| Ecuador | 2017 | 265 |
| Egypt | 2016 | 968 |
| El Salvador | 2016 | 427 |
| Ethiopia | 2015 | 423 |
| Gambia | 2018 | 104 |
| Georgia | 2019 | 308 |
| Ghana | 2013 | 304 |
| Guatemala | 2017 | 199 |
| Honduras | 2016 | 174 |
| India | 2014 | 7,025 |
| Indonesia | 2015 | 877 |
| Jordan | 2019 | 127 |
| Kazakhstan | 2019 | 649 |
| Kenya | 2018 | 626 |
| Kosovo | 2019 | 98 |
| Kyrgyz Republic | 2019 | 232 |
| Lao People’s Democratic Republic | 2018 | 186 |
| Lebanon | 2019 | 411 |
| Lesotho | 2016 | 87 |
| Liberia | 2017 | 94 |
| Malawi | 2014 | 226 |
| Malaysia | 2015 | 452 |
| Mali | 2016 | 91 |
| Moldova | 2019 | 243 |
| Mongolia | 2019 | 297 |
| Montenegro | 2019 | 93 |
| Morocco | 2019 | 548 |
| Mozambique | 2018 | 381 |
| Myanmar | 2016 | 394 |
| Namibia | 2014 | 135 |
| Nepal | 2013 | 377 |
| Nicaragua | 2016 | 248 |
| Nigeria | 2014 | 696 |
| North Macedonia | 2019 | 188 |
| Pakistan | 2013 | 309 |
| Paraguay | 2017 | 202 |
| Peru | 2017 | 588 |
| Philippines | 2015 | 639 |
| Romania | 2013 | 282 |
| Russia | 2019 | 811 |
| Rwanda | 2019 | 229 |
| Senegal | 2014 | 238 |
| Serbia | 2019 | 188 |
| Sierra Leone | 2017 | 100 |
| Solomon Islands | 2015 | 106 |
| South Sudan | 2014 | 247 |
| Sudan | 2014 | 108 |
| Suriname | 2018 | 107 |
| Tajikistan | 2019 | 110 |
| Thailand | 2016 | 563 |
| Tunisia | 2013 | 449 |
| Turkey | 2013 | 473 |
| Uganda | 2013 | 225 |
| Ukraine | 2019 | 681 |
| Uruguay | 2017 | 173 |
| Uzbekistan | 2019 | 470 |
| Vietnam | 2015 | 619 |
| Yemen | 2013 | 148 |
| Zambia | 2019 | 396 |
| Zimbabwe | 2016 | 392 |
Declaration of Conflicting Interests
The author declared no potential conflicts of interest with respect to the research, authorship, and/or publication of this article.
Funding
The author received no financial support for the research, authorship, and/or publication of this article.