
Abstract
This study explores the time-frequency dependency between government expenditures and tax revenues by employing the wavelet coherence approach using data from the United States of America (USA) for the period of 1960Q2 to 2019Q3. The four leading concepts regarding the correlation between government expenditures and tax revenues are the tax-and-spend, spend-and-tax, fiscal synchronization and institutional separation hypotheses. Our results indicate that government expenditures lead to tax revenues in both the short and long run for specific time intervals as proposed by the spend-and-tax hypothesis.
Introduction
The correlation between government expenditures and tax revenues is an essential subject of argument, particularly in public finance. Figuring out the link between the two variables in order to manage an efficient provision of public services and deal with budget deficits is a considerable issue for bureaucrats and policy makers (Payne, 2003). It is also crucial to reveal the link between government expenditures and tax revenues to achieve fiscal sustainability.
Four leading concepts regarding the correlation between government expenditures and tax revenues are the tax-and-spend (Buchanan & Wagner, 1977; Friedman, 1978, 2003), spend-and-tax (Barro, 1979; Peacock & Wiseman, 1979; Roberts, 1978), fiscal synchronization (Meltzer & Richard, 1981; Musgrave, 1996) and institutional separation (Baghestani & McNown, 1994; Wildavsky, 1988) hypotheses.
According to the tax-and-spend hypothesis, government expenditures are led by tax revenues. Friedman (1978, 2003) argued that increasing taxes in order to decrease the budget deficit will result in an increase in government expenditures since bureaucrats and politicians are willing to spend every available resource according to their political interests. Therefore, he claimed that there is a positive correlation running from tax revenues to government spending. Buchanan and Wagner (1977) also claim that the causality between government expenditures and tax revenues is from the latter to the former, however, the sign of the link is negative. They argue that financing the government expenditures via direct taxes causes a fiscal illusion, which implies that citizens consider public goods and services more expensive than they actually are. This causes a reduction in demand for public goods and services which eventually decreases public expenditures (Buchanan & Wagner, 1977).
The second approach with regard to the relationship between government expenditures and tax revenues is the spend-and-tax hypothesis. Barro (1979) advocated that due to Ricardian equivalence, households are indifferent to the source of government expenditures. They are aware that the government expenditures financed by debt today will return to them as a tax cut in the future. Therefore, he suggested that the link between the two variables is from government expenditures to tax revenues. As an alternative approach, Roberts (1978) and Peacock and Wiseman (1979) proposed that government expenditures increase as a response to unusual events such as wars or natural disasters. Following the aforementioned events, governments increase taxes to finance increased expenditures. Hence, they also suggested that there is a positive causality running from government expenditures to tax revenues.
Another concept regarding the correlation between government expenditures and tax revenues is known as fiscal synchronization. As stated by Musgrave (1996) and Meltzer and Richard (1981), decisions regarding government expenditures and tax cuts are taken by related government departments synchronously. Therefore, it is reasonable to assume a bidirectional link between the two variables.
Finally, the institutional separation hypothesis proposes that the decisions with respect to government expenditures and tax cuts are taken by different government departments independently. Therefore, there is no reason to expect any link between government expenditures and tax revenues (Baghestani & McNown, 1994; Wildavsky, 1988).
Notwithstanding the vast number of empirical studies on the tax-spend debate, it’s not likely to mention a consensus on the direction and the sign of the correlation between the two variables. The primary objective of this study is to reexamine the time-frequency dependency between government expenditures and tax revenues, considering the four competing hypotheses in the literature by applying a relatively recent estimation technic, namely the wavelet coherent approach.
We applied the wavelet coherence approach to quarterly time series data from the USA for the period of 1960Q2 to 2019Q3. To the best of our knowledge, this study is the first attempt to analyze the time-frequency dependency between government expenditures and tax revenues in the USA for the aforementioned time period with quarterly data by employing the wavelet coherence approach. The virtue of the wavelet coherence approach is that it enables us to test the link between government expenditures and tax revenues by focusing on both frequency and time dimensions simultaneously which makes it possible to find out the relation between the two variables for the both short and long run for specific time periods at once. It also deals with some general problems of conventional Error Correction Models such as non-stationarity of data and structural breaks.
Our empirical findings provide evidence in favor of the spend-and-tax hypothesis for both the short and long run in specific time intervals. These empirical findings suggest that the US government first spent and then taxed to finance the budget deficits for the selected time periods used in the analysis.
The remainder of the study is as follows. Section 2 consists of a brief literature review of the empirical findings of previous studies. Section 3 explains the data and the methodology that was used in the analyses. Section 4 consists of the empirical findings of the study and the discussion. Finally, section 5 comprises concluding remarks.
Literature Review
A vast number of empirical studies on the link between government expenditures and tax revenues have been done by applying different econometric methods to various countries’ data and ended up with conflicting results. Besides the differences in empirical evidence among the studies focusing on different countries, there are also studies that revealed confronting evidence in both directions and signs of the causality between the two variables for a selected country depending on the time periods.
In their recent studies, Jaén-García (2020) and Akram and Rath (2019) found empirical evidence in favor of fiscal synchronization for Spain and India, respectively. Vamvoukas (2012) also found that the fiscal synchronization hypothesis was valid for 12 Economic and Monetary Union countries for the period of 1970 to 2006. On the other hand, Tashevska et al. (2020) empirically tested tax-spend hypotheses for a panel of six Eastern European countries and concluded that tax-and-spend hypothesis was valid in selected periods for Albania, Bulgaria, Croatia, Serbia and Slovenia, while fiscal synchronization was only valid for Macedonia. Magazzino (2013), also found empirical evidence in favor of the tax-and-spend hypothesis in Gambia, Liberia, Nigeria, and Sierra Leone. Additionally, Yinusa and Adedokun (2017) and Gurvich and Krasnopeeva (2020) also found supportive evidence for tax-and-spend hypothesis in Nigeria and Russia, respectively. As opposed to supportive studies for the tax-and-spend hypothesis, Lusinyan and Thornton (2012), applied the Granger Causality test to data from the United Kingdom for the period of 1750 to 2014 and found that the government spendings granger caused tax revenues which means spend-and-tax hypothesis was in effect in the United Kingdom for the selected period.
Karlsson (2020), used wavelet decomposed quarterly data from China for the period of 1980 to 2015 and applied the Granger causality test to reveal the direction of causality between the government’s spend and tax revenue. She found empirical evidence in favor of the tax-and-spend hypothesis for the short run and fiscal synchronization for the long run periods. Linhares et al. (2021) also found opposing evidence in Brazil on tax-spend debate. Their empirical findings revealed that the fiscal synchronization was valid for the period of 2005 to 2008, while spend-and-tax hypothesis held from 2010 to 2013 and the tax-and-spend hypothesis was in effect between 2015 and 2018.
The empirical literature on the tax-spend debate for the USA is also mixed. From early studies based on data from the USA, Ross and Payne (1998) and Islam (2001) found empirical evidence in favor of the spend-and-tax hypothesis. On the contrary, Koren and Stiassny (1998) and Chang et al. (2002) ended up that the tax-and-spend hypothesis was in effect. There are also studies that revealed empirical results in favor of fiscal synchronization (Owoye, 1995) and institutional separation (Baghestani & McNown, 1994).
Empirical evidence from recent studies on the tax-spend debate in the USA is also contradictory. Young (2009) used quarterly data from 1959 to 2007 and found that the tax revenues negatively Granger caused government expenditures in the selected period which implies that the fiscal illusion actually existed. Zapf and Payne (2009), analyzed annual data from 1959 to 2005 and ended up that government expenditures positively affect tax revenues. On the contrary, Saunoris (2015) revealed empirical evidence that for the period of 1951 to 2008 tax-and-spend hypothesis was in effect in USA.
Contrary empirical evidence for the USA and other countries could originate from the differences in econometrical methods used and time periods selected in studies. Especially the two main problems in times series analysis, namely non-stationarity of data and structural breaks, could cause critical estimation problems such as biasness of results. Therefore, we applied the wavelet coherence approach in this study to avoid the estimation biasness of potential non-stationarity of data and structural breaks. The next chapter explains the estimation method and data in more detail.
Data and Methodology
To examine the time-frequency dependency between government expenditures and tax revenues, seasonally adjusted quarterly time series data from the USA for the period of 1960Q2 to 2019Q3 were employed. The dataset of the time series was acquired from the Federal Reserve Bank of St. Louis. The Growth rate of government expenditures and tax revenues were used in data analyses. The summary and the volatility of data are shown in Figure 1 below.

Growth rate of government expenditures and tax revenues.
The wavelet coherence approach, which is based on the Morlet wavelet family and initially developed by Goupillaud et al. (1984), was applied to examine the correlation between the two variables.
The prominent characteristic of the wavelet approach, which is preferable to the conventional causality techniques, is that the procedure takes into account both the time and frequency domains concurrently. This feature of the method provides information on both short and long run periods for specific time intervals. Another benefit of the method is that it does not require any pre-tests such as unit root. Combining the time and frequency domains, it eliminates the prospective approximation biases caused by the structural breaks and non-stationarity (Pal & Mitra, 2017).
The wavelet

In Equation 1,

A continuous wavelet can be obtained from a finite sample time series

The overline in Equation 3, represents the complex conjugation. Time series

It is viable to observe the volatility of any given time series for a specific time period and frequency by applying the wavelet power spectrum (WPS) analysis. The WPS of any time series is obtained by taking the square of the absolute value of the wavelet.

To calculate the correlation between any two time series, the wavelet coherence approach is applied. Wavelet coherence approach which is shortly “defined as the square of the cross-spectrum normalized by the individual spectra” (Torrence & Compo, 1998, p. 76). The distinctive feature of the wavelet coherence approach compares to the conventional correlation analysis is that it takes into account both time and frequency aspects while calculating the correlation between two time series

Equation 6 above shows the cross-spectrum of the time series
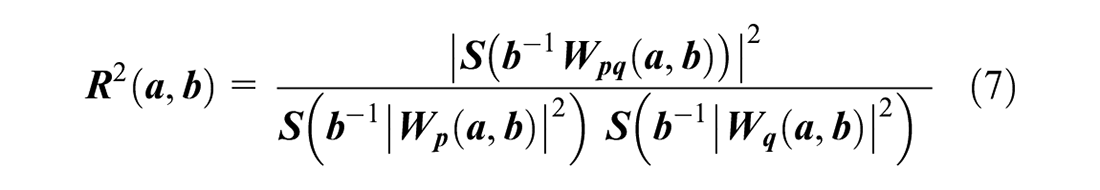
In Equation 7 above,

In Equation 8 above
Results and Discussion
To reveal the quarterly volatility of government expenditures and tax revenues in the US for the period from the second quarter of 1960 to the third quarter of 2019, the wavelet power spectrum approach was applied to the data with a scale of 64. The results of the power spectrum analyses for government expenditures and tax revenues are shown below in Figures 1 and 2, respectively.

Wavelet power spectrum for government expenditures.
Figure 2 demonstrates the volatility of government expenditures in the US from 1960Q2 to 2019Q3 on a quarterly basis. The areas covered by the thick black lines represent the 5% significance level based on the Monte Carlo simulations. The closer the colors are to the red, the higher the volatility and vice versa. According to the figure, government expenditures were highly vulnerable in the periods of 1970 to 1975, 1990 to 1992, and 2007 to 2010 in the short run. Figure 3 illustrates the vulnerability of tax revenues for the US in the same period. It implies that the tax revenues were also highly volatile in the short run for the periods of 1974 to 1977, 1984 to 1987, 2000 to 2005, and 2010 to 2012.
Wavelet power spectrum for tax revenues.
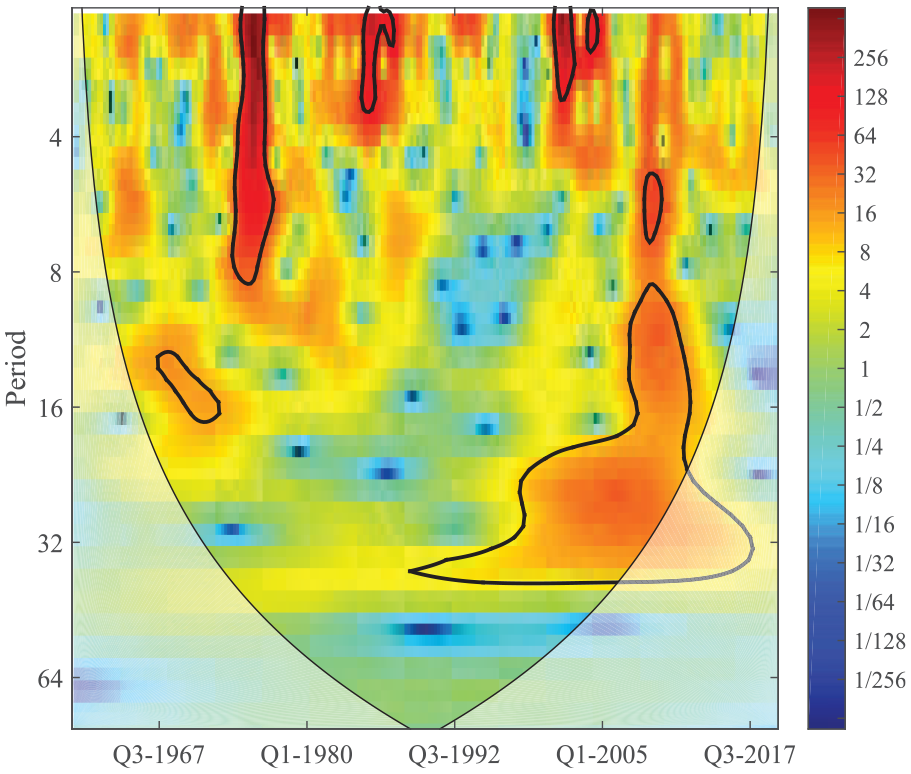
As the main purpose of this study, the wavelet coherence approach was applied to data to reveal the correlation between government expenditures and tax revenues for the USA for the period of 1960Q2 to 2019Q3. Figure 4 illustrates the results of the wavelet coherence analysis for the two variables. The areas covered by the thick black lines again represent the 5% significance level based on the Monte Carlo simulations, and the closer the colors are to the red, the higher the correlation between the variables and vice versa. The cone-shaped zone encircled by a narrow black line shows the decision area of the analysis, and any areas out of this zone are not statistically significant. The arrows in the figure infer the direction and intensity of the correlation. Arrows pointing left (right) imply a negative (positive) correlation between the variables. Arrows pointing down, down-right and left-up imply a positive correlation from the first variable (government expenditures) to the second variable (tax revenues). Arrows pointing up, right-up and left-down imply a positive correlation from the second variable to the first variable.

Wavelet coherence between government expenditures and tax revenues.
As shown in Figure 4, the results of the wavelet coherence analysis imply a positive correlation running from government expenditures to tax revenues for the short run in the periods of 1970 to 1972, 1981 to 1983, 1990 to 1995, and 2002 to 2003, and for the long run from 1988, supporting the spend-and-tax hypothesis. The results for the short-run time periods coincide with the 1970 recession, the 1980 and 1990 oil crises, and the 2001 financial crisis in the USA. This also supports the hypothesis that governments spend first to meet the citizens’ demands or deal with the economic issues and then tax to finance budget deficits. Our empirical findings are consistent with the studies of Zapf and Payne (2009), Lusinyan and Thornton (2012), whose results also supported the spend-and-tax hypothesis that governments first spend and then tax to compensate for the aforementioned expenditures.
However, our results supporting the spend-and-tax hypothesis are inconsistent with the studies of Vamvoukas (2012), Akram and Rath (2019), and Jaén-García (2020), who found empirical evidence on the fiscal synchronization hypothesis, and Yinusa and Adedokun (2017), Gurvich and Krasnopeeva (2020) and Tashevska et al. (2020), who found empirical evidence on the tax-and-spend hypothesis. The contradictory results of empirical studies may have arisen from the circumstance contingent characteristics of the tax-spend relationship that could vary depending on the countries’ economic environments and also institutional structures.
Conclusion
The main purpose of this study is to explore the time-frequency dependency between government expenditures and tax revenues by applying the wavelet coherence approach to data from the USA for the period of 1960Q2 to 2019Q3. Four competing hypotheses on the tax-spend debate are tax-and-spend, spend-and-tax, fiscal synchronization, and institutional separation.
Empirical evidence from the study reveals a positive correlation between the two-time series variables running from government expenditures for both the short and long run for specific time periods, thus supporting the spend-and-tax hypothesis. Our empirical findings indicate that the US government first spent and then taxed to finance budget deficits in the time period used in the analysis. We have found no empirical evidence in favor of the tax-and-spend and fiscal synchronization hypotheses.
Although numerous empirical studies have been performed in the literature on the relationship between government expenditures and tax revenues, contrary evidence and the absence of a consensus imply that the relationship could be circumstance-contingent. Therefore, it would be more enlightening to focus on country and time-specific analysis in future studies in order to reveal the correlation or causality between the two variables rather than conventional time series or panel data analysis.
Footnotes
Declaration of Conflicting Interests
The author(s) declared no potential conflicts of interest with respect to the research, authorship, and/or publication of this article.
Funding
The author(s) received no financial support for the research, authorship, and/or publication of this article.