
Abstract
The impact of fiscal federalism on economic performance has largely been studied in the developed world since the seminal work of Oates. In this article, we focus on a particular set of developing countries considered to be federal (Forum of Federations), to examine how fiscal decentralization has impacted their economic growth. In this context, we study the impact of tax revenue and expenditure decentralization on economic growth in developing federations. For this purpose, a panel data of 15 developing federations from 2000 to 2015 are analyzed by using a two-step system Generalized Method of Moments (GMM) estimation method. The results show that in federal developing countries, both tax revenue and expenditure decentralization have a significant, positive impact on economic growth. What is more, our findings show that the impact of fiscal decentralization on economic growth depends upon the level of perceived corruption and on the quality of the country’s institutions. Thus, empirical evidence depicts that the positive effect of fiscal decentralization on economic growth is tempered if the country is plagued with corruption, if it has weak institutions, and/or if it suffers from political instability. By contrast, a relatively corruption-free country featuring healthy institutions and a stable political environment could take fuller advantage of the effects of fiscal decentralization to improve economic growth.
Keywords
Introduction
In recent decades, many developing countries with a political federal system as varied as India, Pakistan, South Africa, Mexico, Ethiopia, Brazil, or Malaysia, among others, have shown increasing movements toward fiscal decentralization.
Federations are those that have one federal government and at least one lower tier of government though commonly they have two (a regional government and a municipality government). Fiscal decentralization remains a complex challenge for developed countries with mature fiscal federalism processes still ongoing (Lago-Peñas et al., 2017) but even more for developing countries facing more hurdles in implementing deeper fiscal arrangements between their different governmental levels. Our target countries for this empirical study have been those 15 developing countries listed as federations (Forum of Federations, 2015). For the purpose of this study, we refer them as developing federations or young federations versus the developed or mature federations. This classification is neither based on the age of the federation nor the speed and depth of the decentralization process in developing countries. Therefore, for the purpose of this study, the so-called young federations are those developing countries considered as federal countries. We are interested in understanding the impact of the evolution of their federal fiscal regimes since the year 2000 on their economic performance. By and largie, even though they have shown a political and an institutional will to put forward further fiscal devolution of powers to subnational governments, in general, their actual decentralization process is still weak compared with mature federations but increasingly relevant. Nonetheless, we should not forget that also the speed and intensity of the decentralization process among these developing federations is uneven and very heterogeneous.
Developing countries have been attracted to decentralization as a means of encouraging efficiency in the provision of public goods and economic growth. Decentralized systems can enhance public welfare by better matching public services to local needs (Oates, 1972), and that in turn they can accelerate mobilization of revenues and the country’s economic performance. Martinez-Vazquez and McNab (2003) suggest that the increased efficiency in public goods provision associated with decentralization can expand important public goods including infrastructure and social services, which may fuel economic growth. The benefits of fiscal decentralization in favor of economic performance are convincing but empirical findings remain inconclusive and they are very scarce for the developing world.
One of the main contributions of our research relies on providing more updated empirical evidence for a set of developing countries, considered as federations, hard to study jointly due to data constraints. Furthermore, the study is conducted understanding the importance of the distinction between young and mature countries based on the quality of their institutions (North, 1990). The institutions as depicted by North (1990) create incentives to a more vigorous economic performance when those incentives are healthy but to sluggish growth or even stagnation and decline when the rules of the game hinder the economic activity. In our research based on panel data, our primary goal has been to test the significance of the gradual devolution of powers to subnational governments in these particular developing countries. However, we understand that our analysis is constrained by the data availability on regional fiscal autonomy we gather from the databases of the Government Financial Statistics (GFS) of the International Monetary Fund (IMF) and the World Development Indicators (WDI) of the World Bank. This means that the study of the specific interactions in those countries among the different tiers of governments and their particular fiscal arrangements in terms of raising, levying, collecting, managing revenues, and/or spending powers is out of the scope of this research.
Although already a number of studies have used large panel data sets to analyze the decentralization/growth link (Davoodi & Zou, 1998; Iimi, 2005; Kappeler & Valila, 2008; Martinez-Vazquez & McNab, 2006), they have in general ignored the institutional differences between “developing” versus “developed” decentralized processes based on the maturity and strength of their institutions. We believe that this distinction could be important as institutions have the role to support the new shift of fiscal powers and responsibilities to subnational governments. The approach of the current study is to estimate this relationship for 15 developing countries at different points along the “young” decentralization spectrum, using data that span the recent Great Recession. The 15 countries are Argentina, Bosnia and Herzegovina, Brazil, Comoros, Ethiopia, India, Malaysia, Mexico, Micronesia, Nepal, Pakistan, the Republic of South Africa, St Kitts and Nevis, Swaziland, and Venezuela. The countries in this study are referred to as “young” decentralized countries, a somewhat subjective classification which offers a useful cross section in terms of newly decentralizing developing countries (varying in levels of development and decentralization). Hence, for this study, the subset of developing countries chosen is based on their federal status and the availability of data.
This research empirically examines the impact of decentralized revenue and expenditures on economic growth by using a robust two-step system Generalized Method of Moments (GMM) estimation method. This study measures fiscal decentralization from both sides: revenue and expenditure. We provide empirical evidence, for federal developing countries, of the association between fiscal decentralization and economic growth, supporting the hypothesis that fiscal decentralization contributes to their economic growth, contrary to some prior research showing negative associations between those two variables, as Davoodi and Zou (1998) and Demello (2000) concluded for developing countries. In addition, our empirical results also indicate the existence of other several factors affecting economic growth, such as the quality of institutions, the size of the public sector, and corruption. Here, the measure of corruption is understood as an expression of excessive patronage, nepotism, job reservation, “favors-for-favors,” secret party funding, and suspiciously close ties between politics and business.
The rest of the study is distributed into the following sections. The next section discusses the state of fiscal decentralization in the sample countries. Section “Data and Method” describes data and methodology, section “Empirical analysis” provides the empirical analysis, section “Results and Discussion” discusses the results, and section “Conclusion” offers conclusions.
Revenue and Expenditure Decentralization
Neyapti (2010) has shown that developing countries generally exhibit lower levels of fiscal decentralization than developed economies. There are myriad reasons for this including political will in developing economies, local capacity related to disseminating expenditures and administering tax systems, and the fragility of accountability in some countries. These characteristics of developing federal systems suggest fundamental differences in the potential of these countries to enhance economic welfare via decentralization. Table 1 provides the average percentage values of expenditure and tax revenue decentralization for the sample countries.
Level of Fiscal Decentralization and Other Control Variables’ Average Data for the Period 2000–2015.

Source. Estimated by authors from Government Finance Statistics (IMF, 2011) and World Development Indicators (World Bank, 2016) data.
Note. GDP = gross domestic product.
It also lists each country’s average value in terms of three macroeconomic indicators from the period 2000–2015: real gross domestic product (GDP) growth, inflation, and unemployment rates. Moreover, two additional parameters are reported in the table: the quality of pertinent institutions, as measured by the institutional quality index, and the size of the public sector. Institutional quality is measured by the quality of bureaucracy in each country, on a scale of 0 to 4 points. Countries where the bureaucracy has the strength and expertise to govern without drastic changes in policy or interruptions in government services rate closer to the maximum of 4. High institutional quality implies a bureaucracy that is autonomous from political pressure. According to the sample data, Ethiopia shows the lowest institutional quality, whereas South Africa attains the highest rating (2.8/4). On the basis of expenditure and revenue, the size of the public sector is expressed as a percentage of GDP on a scale of 0 to 1.
As it occurs in the developed countries, developing federations show, on average, larger expenditure decentralization indicators than revenue decentralization data (see Table 1). Among this data set, we find countries such as Brazil and Argentina, with very high decentralization figures on both sides, reporting the highest revenue and expenditure decentralization ratios among the sample countries. Among the developing federations under study, both South American countries show the greatest progress toward fiscal autonomy. On the opposite side, we have the case of Swaziland, a federation that reports being highly fiscally centralized.
On the contrary, it is worth mentioning the case of South Africa, whose figures show that it has barely shifted any revenue power to their subnational governments (6.1%) compared with its 29.7% on the expenditure side. Hence, the lion share of South Africa’s tax revenues keeps being centralized. The mismatch between revenue and expenditure decentralization is common but it is less frequent showing such a huge difference. Such a mismatch is not optimal, according to the literature (Hanif et al. 2014; Hanif & Gago-de Santos, 2017), as it implies increased expenditure responsibility for subnational governments without revenue authority to meet those responsibilities. A mismatch of revenue or expenditure authority could undermine the theoretical benefits of fiscal decentralization.
Boadway and Hobson (1993) argued that in most developing countries a mismatch in expenditure and revenue assignments generally prevails. When there is a mismatch, the vertical gap between expenditure and revenue may rein in the impact on growth given that regional governments cannot be held truly accountable for fiscal decisions. Shah (2006) notes that consistent, similar levels of expenditure and revenue decentralization could improve subnational governments’ accountability. Hanif and Gago-de Santos (2017) highlight that increasing fiscal responsibility by deepening the revenue decentralization process might ensure greater efficiency in spending, but where there is a severe imbalance between both sides of the process, subnational governments tend to be more fiscally irresponsible. In those countries with lower revenue decentralization measures and imbalances with the expenditure side, subnational governments tend to be more dependent on federal transfers as compared with own resources to cover spending needs, thus becoming more prone to overspending or to spending less efficiently (Hanif & Gago-de Santos, 2017).
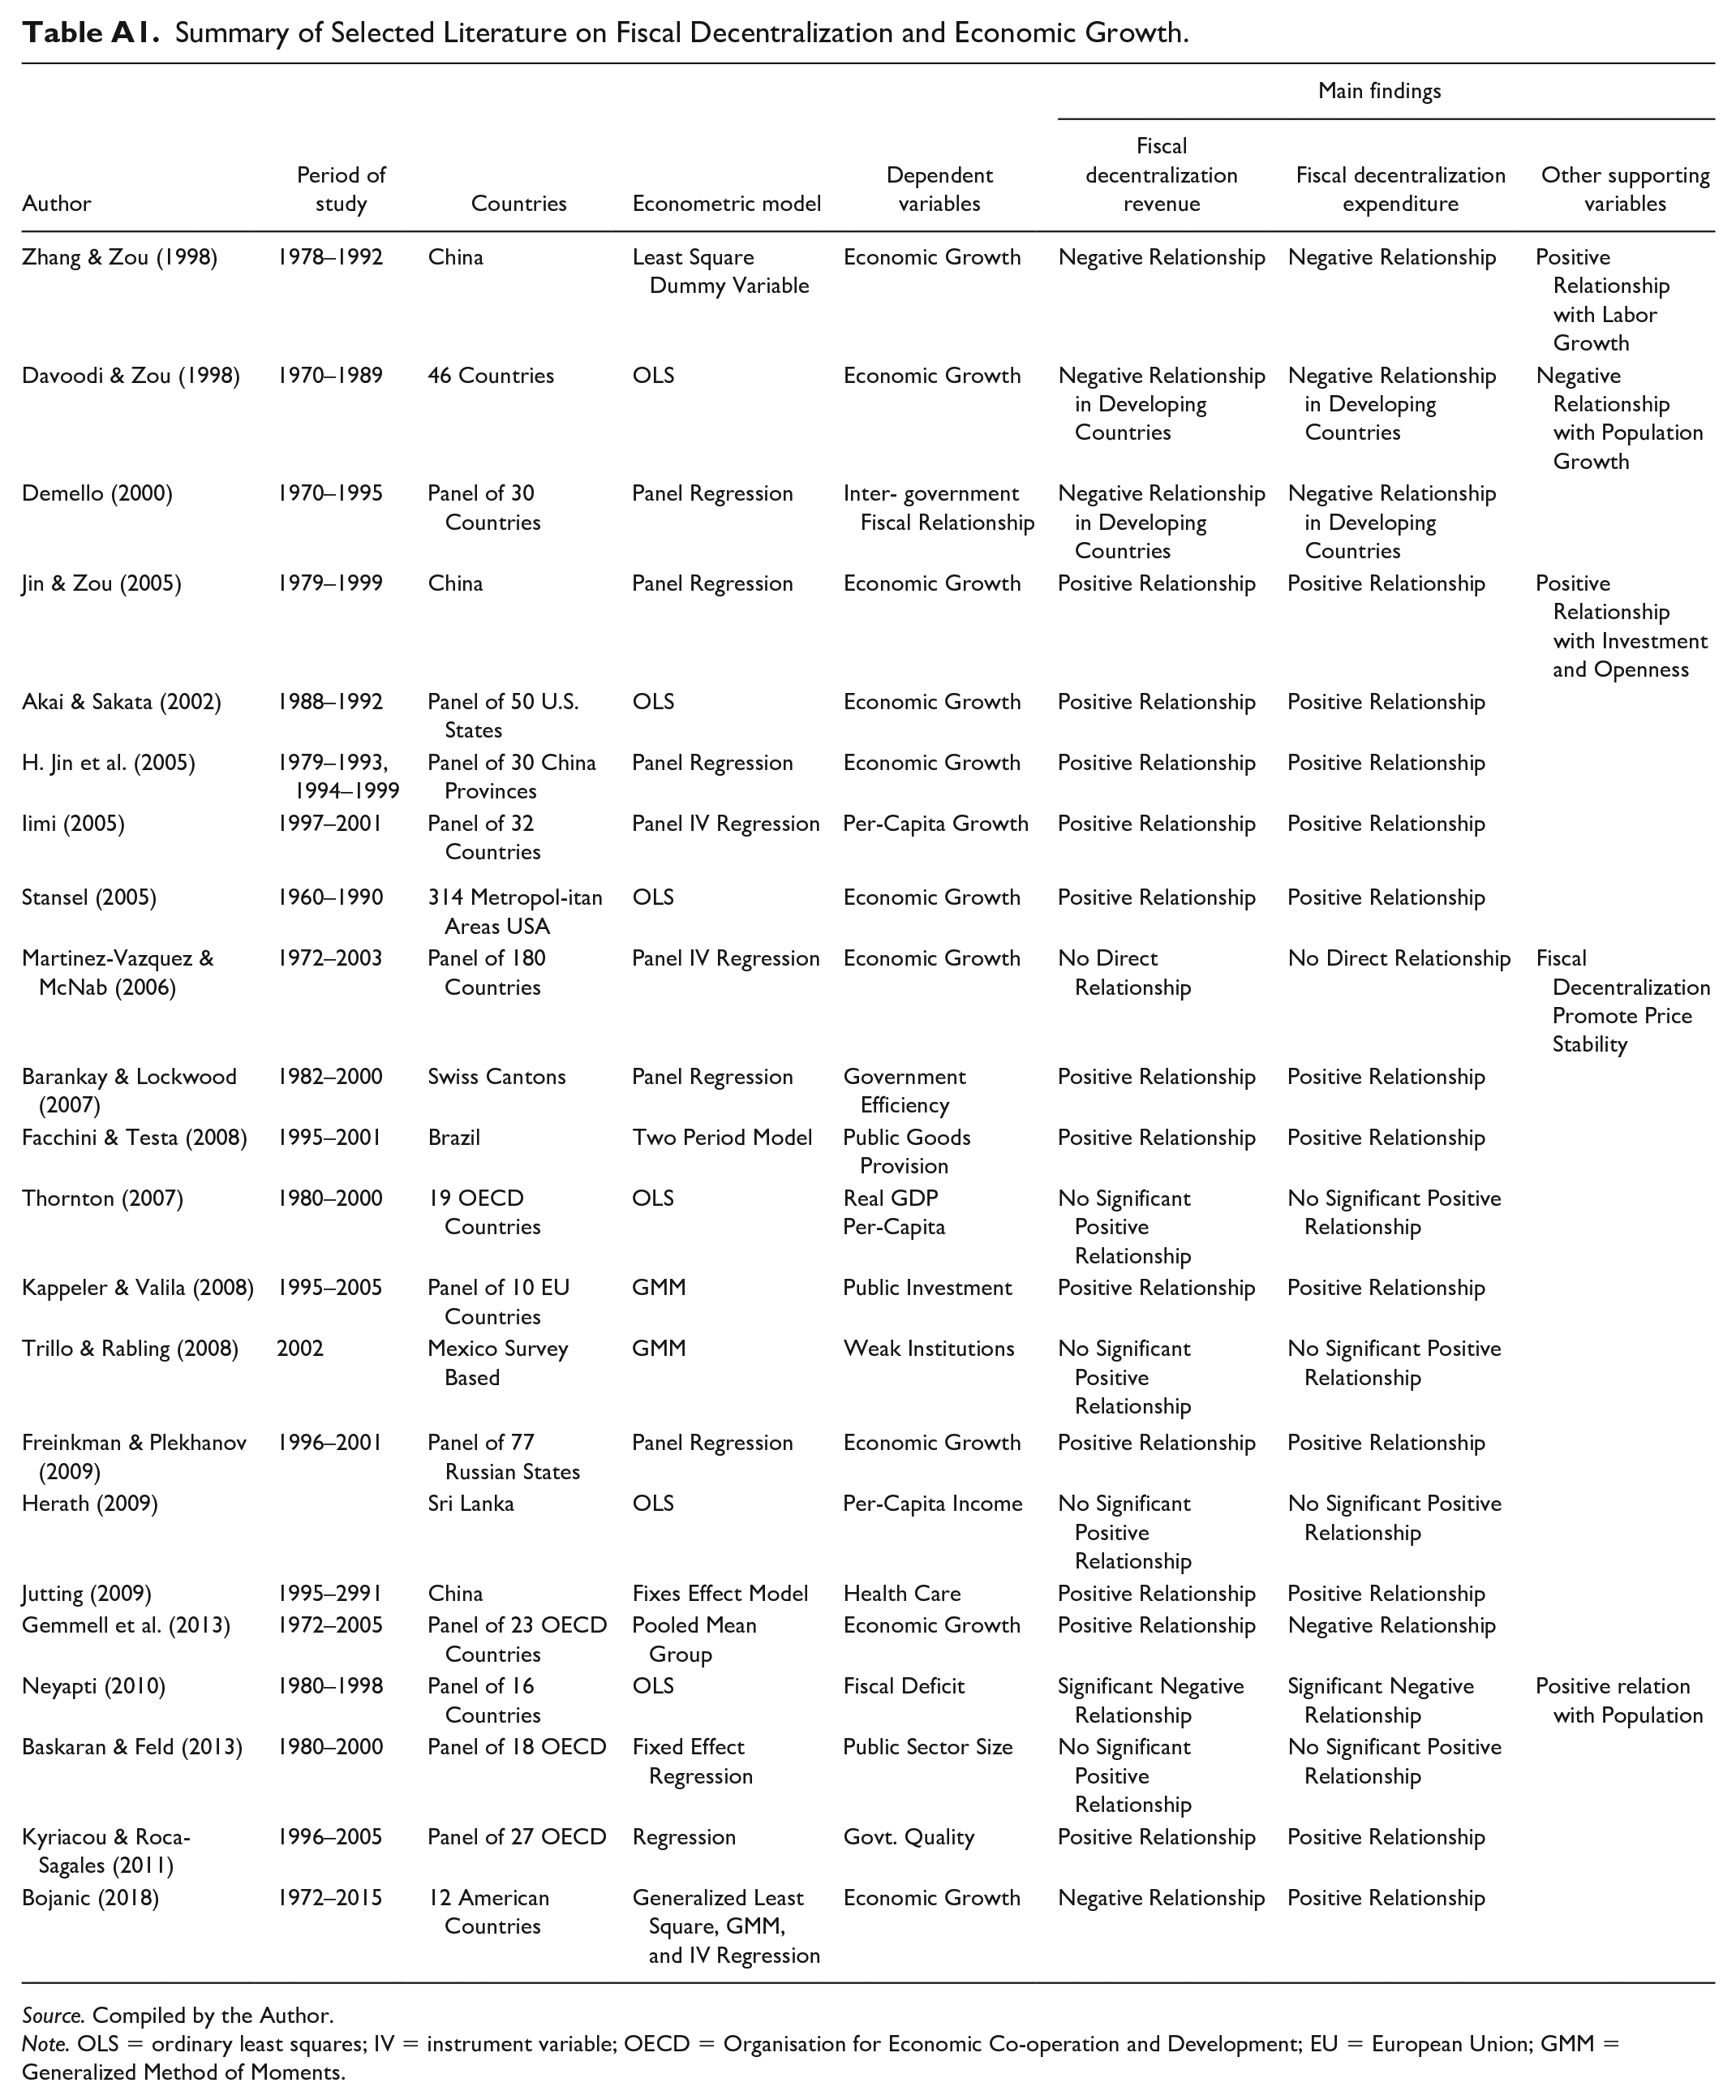
In the appendix, we can review some of the most relevant empirical evidence on fiscal decentralization and growth using mainly panel data. Most of the research has been conducted in Organisation for Economic Co-operation and Development (OECD) countries, some in mixed economies and none so far in developing nations. In previous research, Gemmell et al. (2013) analyze only OECD countries and find that expenditure decentralization is associated with lower economic growth, whereas revenue decentralization was associated with higher growth. In particular, those authors advise raising revenue decentralization and lowering expenditure decentralization in OECD countries until a close match of both processes is reached. Martinez-Vazquez and McNab (2003) and Iimi (2005), among others, find positive impacts of decentralization on growth for a combined set of countries. However, these studies do not focus on federal developing countries. Arguably, the benefits to decentralization from the expenditure and revenue side may be greater for young federations as they have further to go in terms of decentralization and growth than OECD countries. The margins of impact are likely to approach some steady-state and OECD countries would be closer to that point than young federations.
Bojanic (2018), a very recent work that focuses on American countries, finds a significant positive relationship on the expenditure side but not on the revenue side with the economic performance. However, there is yet no consensus view on the impact of federalism on growth, as different empirical investigations have found no significant relationships or negative or positive relationships in different countries and for specific time periods (Hanif & Chaudhry, 2015; Hanif & Gago-de Santos, 2017). Another recent research on panel data for OECD countries concludes that for those countries the impact on growth depends on the econometric strategies used and on the measurement criteria (Göcen et al., 2017).
In this sense, we should bear in mind that one of the most reliable reasons for having yet inconclusive empirical evidence is because researchers rely mostly on the data provided by the GFS of the IMF on revenue and expenditure decentralization but we are aware of the fact that such data do not always give us the actual degree of fiscal autonomy reached by the subnational governments (Bojanic, 2018; Ebel & Yilmaz, 2002; Martinez-Vazquez et al., 2016; Stegarescu, 2005). This is so because, theoretically, tax sharing and other tax decentralization formulas do not provide real tax autonomy (Lago-Peñas et al., 2017).
Certainly, the works of Stegarescu (2005) and Thornton (2007) responded to Rodden’s complains on relying on IMF GFS data (2004) by providing a more accurate measure of real fiscal autonomy on advanced economies. In the case of Stegarescu (2005), he differentiated revenues based on whether the local governments had real fiscal power on determining rates and/or tax bases or not to come up with a more precise revenue decentralization indicator. Similarly, Thornton’s efforts focused on the expenditure side while defining the actual expenditure decided autonomously by the local governments but only for a small set of developed economies. However, in developing countries, identifying the real autonomy of the subnational governments is even more challenging as it demands a comprehensive knowledge of each country’s fiscal agreements among the different tiers of government. From the revenue side, real revenue autonomy is explained by own revenues (those where the provincial governments have authority to design, determine, and/or collect), which differ from revenues coming from the vertical distribution of revenues from the federal government to the subfederal government.
Despite Rodden (2004) complains regarding the standard formula to measure fiscal decentralization by the shares of subnational revenues and/or subnational expenditure to general government, most recent research, even for OECD countries (Bojanic, 2018; Makreshanska-Mladenovska & Petrevski, 2019), keep relying on the shares of subnational governments revenue/expenditure to general government revenue/expenditure. In this article, for our data set of developing federations, such sophisticated decentralization indicators were not possible to have access to and we rely on two measures of fiscal decentralization based on the IMF data, as explained in section “Data and Method.”
Data and Method
The empirical investigation is focused on the young developing federations of Argentina, Bosnia and Herzegovina, Brazil, Comoros, Ethiopia, India, Malaysia, Mexico, Micronesia, Nepal, Pakistan, Republic of South Africa, Swaziland, St. Kitts and Nevis, and Venezuela. Present research comprises a balanced panel data of 15 developing federations and data were extracted from GFS of the IMF, and from the World Bank’s WDI, for the period from 2000 to 2015. The empirical models are based on a simple log-linear augmented Solow growth model where economic growth is a function of a variety of inputs and the level of decentralization. The linear functional form of the proposed models can be presented as follows:


where
Description of Variables.
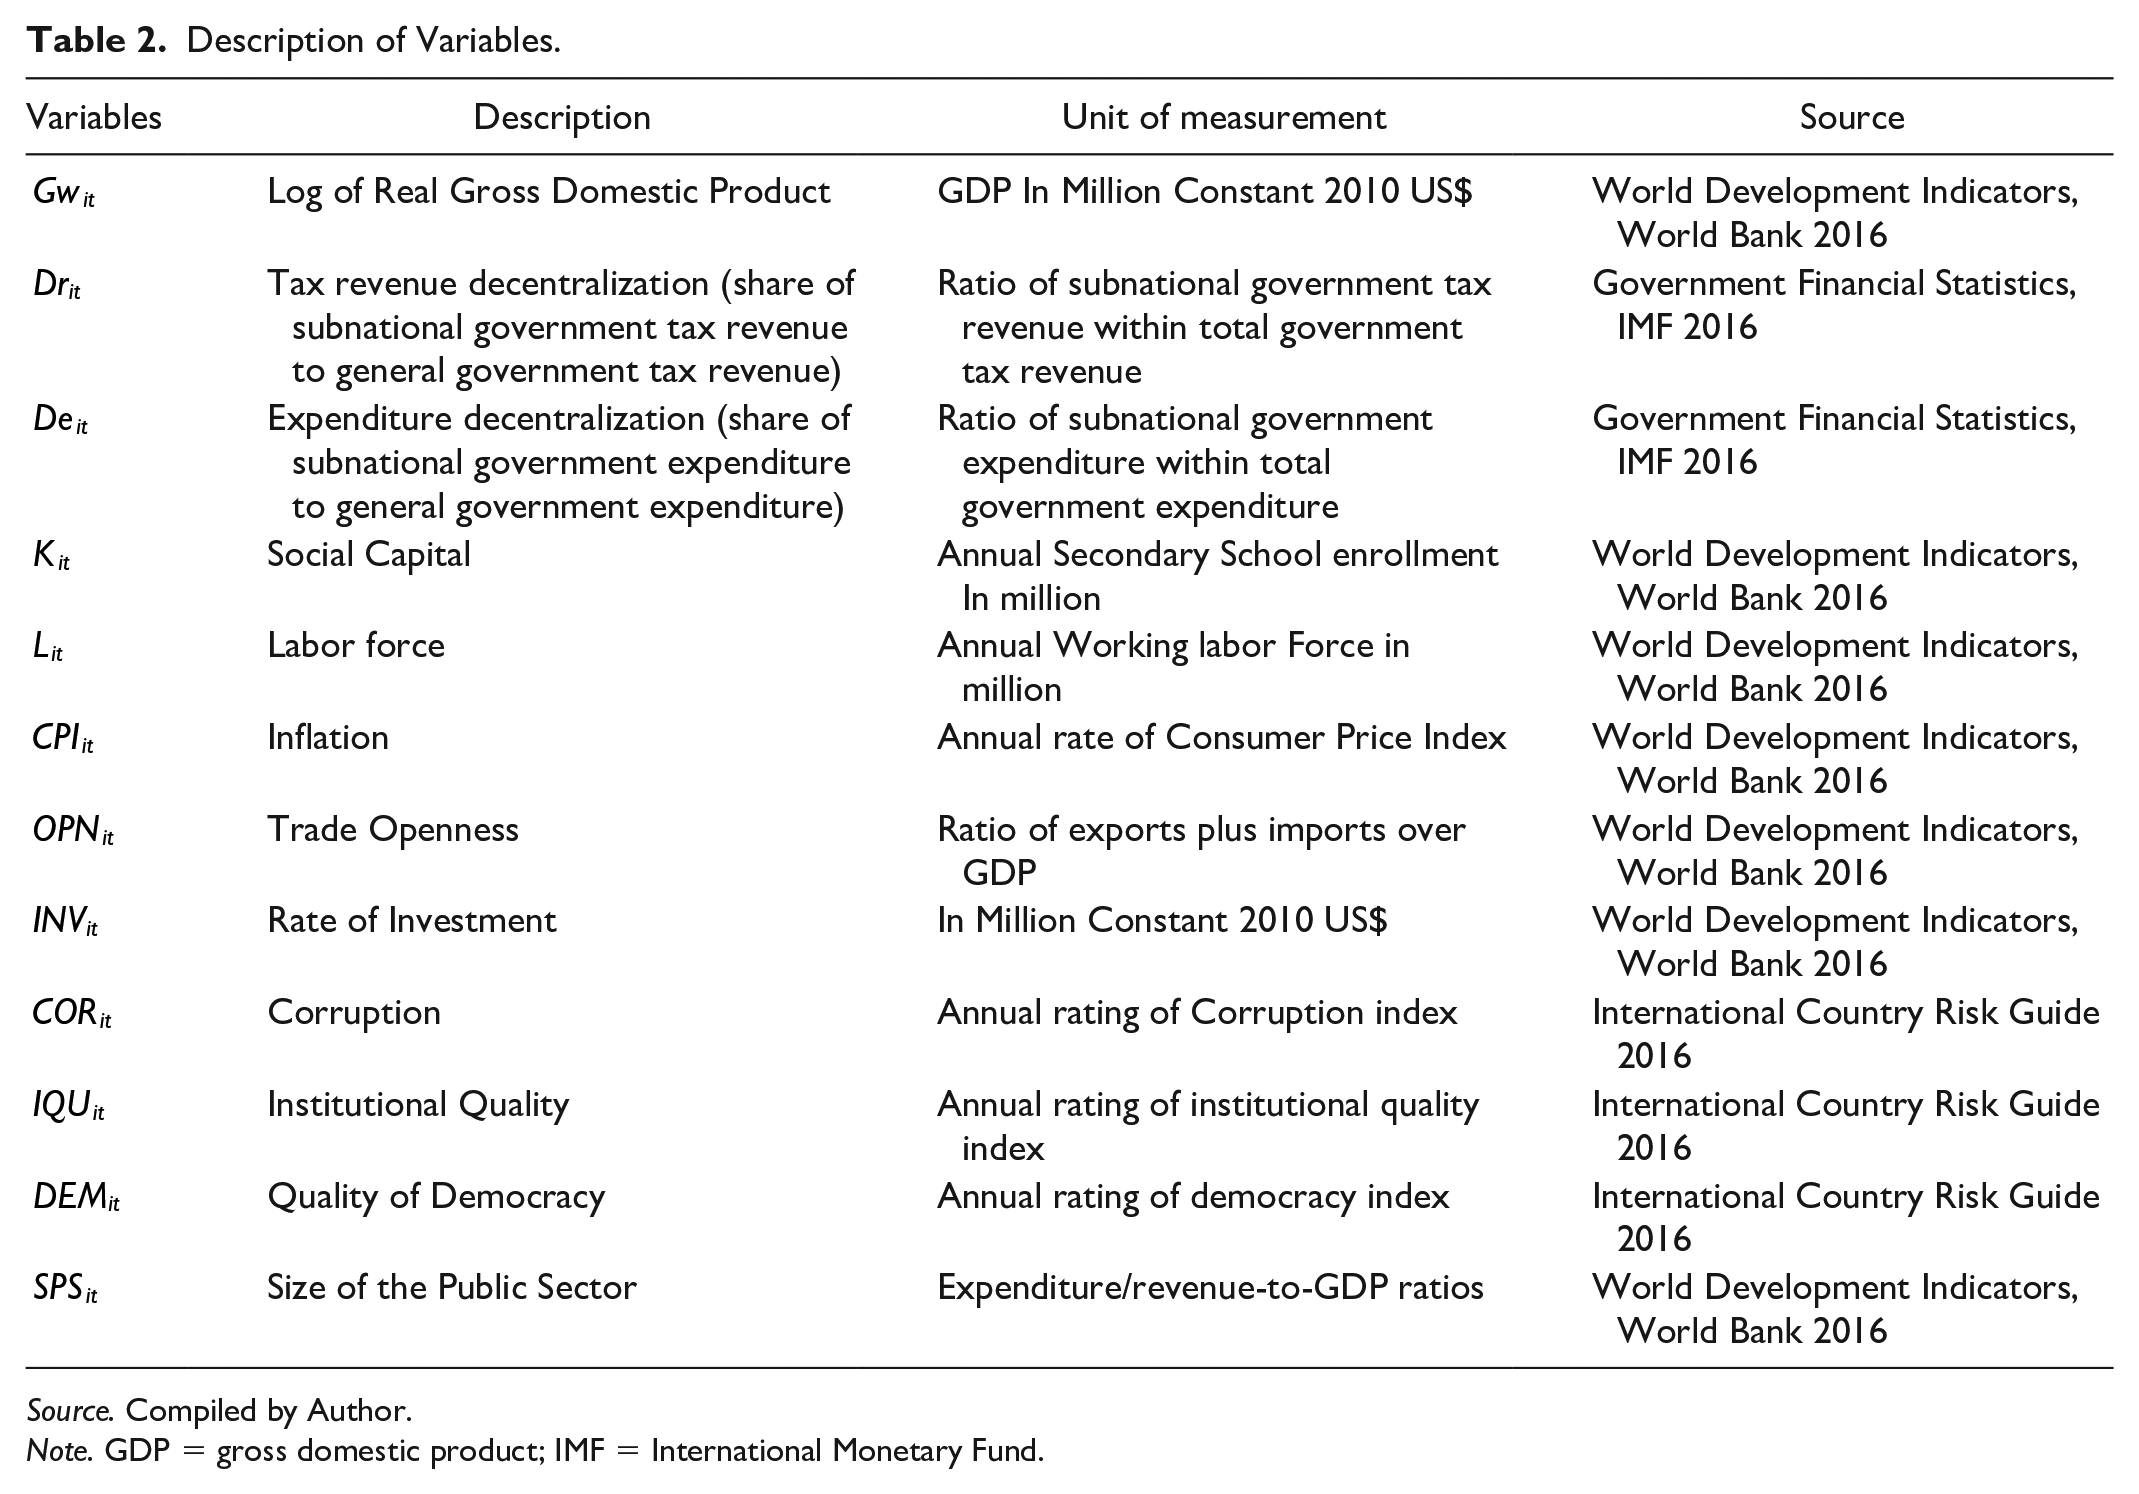
Source. Compiled by Author.
Note. GDP = gross domestic product; IMF = International Monetary Fund.
In Equation 1 we do examine tax revenue decentralization as an alternative measure used for revenue decentralization (i.e., share of subnational tax revenue in total government tax revenue). In Equation 2, expenditure decentralization is measured by subnational government expenditure as a share of total expenditure. In both cases, the closer the revenue/expenditure share is to 100%, the higher the level of fiscal decentralization.
Empirical Analysis
A series of checks are made on the data before progressing to the regression analysis. There is no evidence of multicollinearity in the data, whereas there is evidence of heteroscedasticity. Therefore, in the empirical estimation, this study employs heteroscedastic robust standard errors and those are reported in the results (Table 5). A fixed-effects model is used based on results of the Hausman (1978) test and similar estimation method used to previous research including Davoodi and Zou (1998), Lin and Liu (2000), Yilmaz (2000), J. Jin and Zou (2005), and Feld et al. (2010).
Stationarity is also an important factor in panel data. For example, if decentralization is highly persistent, the decentralization series in each country may suffer from a unit root and the resulting estimates would be inconsistent. Using a Fisher-type unit root test, commonly used for unbalanced panel data, it may be determined whether or not the dependent and independent variables are stationary. The results of the Fisher-type Augmented Dickey–Fuller Test, presented in Table 3, allow us to reject the null hypothesis.
Results of the Unit Root Test Based on Augmented Dickey–Fuller Tests.

Note. The use of a Fisher panel data unit root test strongly rejects the null hypothesis at 1%. Here, probability values are reported in parenthesis (. . .).
Throughout the literature, it is acknowledged that the fiscal decentralization-economic growth dynamic may be endogenous. Fiscal decentralization itself may not be a reality until a country reaches a certain level of growth. The idea is that some countries “cannot afford” fiscal decentralization and need a strong central government hand to keep the economy on a steady course. The variables used in this study are also tested for endogeneity using the Durbin–Wu–Hausman test. The results are given in Table 4.
Results of the Durbin–Wu–Hausman Test for Endogeneity.

Note. Here, a smaller p value indicates the rejection of null hypothesis and confirms the endogeneity issue in the model, thus supporting the use of system GMM to estimate the model. GMM = Generalized Method of Moments.
The null hypothesis is that ordinary least squares (OLS) would produce consistent estimates; however, in both cases, results reject the null hypothesis, as the lower p value confirms that the variables of fiscal decentralization are not exogenous. In this case, the country fixed effects become ineffective to resolve the endogeneity issue.
While using an instrument variable (IV) approach may be an appropriate way to address endogeneity (Martinez-Vazquez et al., 2016), there are concerns. First, when using lagged values of fiscal decentralization as IVs, fiscal decentralization may be stable over time and may have a persistent impact on the dependent variable, resulting in correlation between the instrument and the error term. Second, researchers have used a variety of IVs, although in some cases the correlation between those instruments and fiscal decentralization is not clear-cut (see, for example, the work of Baskaran and Feld (2013) and Fisman and Gatti (2002), among others). Thus, given the difficulty of finding suitable external instruments for fiscal decentralization, many researchers are now utilizing estimation approaches that have the potential to mitigate the endogeneity issue. The most relevant is the system GMM estimator, developed by Blundell and Bond (1998).
To address the potential endogeneity in the variables, a system GMM is developed which introduced a level equation on the basis of a first-difference equation to develop a system of equations. Furthermore, in a system GMM, instruments are constructed on the basis of differences as well as level information; thus, the introduction of a level equation in a system GMM converts the lagged variables of the level equation into instruments, increasing the instruments and providing more information about the sample (relative to a difference GMM). The system GMM is further classified into one-step and two-step procedures. To deal with heteroscedasticity as well as to estimate a sample with shorter periods (t = 15) and a large number of groups (N = 15), present study uses a robust version of the two-step system GMM procedure to estimate the model. Finally, the quality of instruments and of over-identification restrictions was examined by way of the Hansen J test, the differences-in-Hansen test, and the Arellano–Bond test for second-order autocorrelation.
Results and Discussion
The estimation results are shown in Tables 5 to 7. The most interesting results for this article are those pertaining to revenue and expenditure decentralization and their statistically significant impact on economic growth.
Results Based on OLS, Fixed Effect (FE), and Two Step System-GMM (Robust).

Note. (W-C) robust standard errors are in brackets [. . .]. All regressions include intercept terms not shown here. OLS = ordinary least squares; FE = fixed effect; GMM = Generalized Method of Moments; GDP = gross domestic product.
Here, ***, **, and * represent the 1%, 5%, and 10% level of significance, respectively.
Robustness Testing.

Note. (W-C) robust standard errors are in parenthesis. All regressions include intercept terms not shown here. GDP = gross domestic product.
Here, ***, **, and * represent a 1%, 5%, and 10% level of significance, respectively.
Results With Interaction Terms.

Note. (W-C) robust standard errors are in parenthesis. All regressions include intercept terms not shown here. GDP = gross domestic product.
Here, ***, **, and * represent a 1%, 5%, and 10% level of significance, respectively.
On the revenue side, the results of Equation 1 based on GMM estimation method show that the increase in tax revenue decentralization has had a positive impact on economic growth in developing federations and is significant. The result shows that a one percentage point increase in the subnational tax revenue share in total tax revenue induced a 0.543 percentage point increase in economic growth. The positive association between economic growth and tax revenue decentralization suggests that regional governments’ increased authority over revenue increases the ability to expand economic opportunity. One cannot say exactly how this mechanism works—it may be increased tax revenues lead to more and better public expenditures or better citizen participation that yields higher output. By this it could be suggested that local accountability and local authority should be present to obtain gains from tax revenue decentralization.
The result shows a positive association of expenditure decentralization with economic growth. Thus, the empirical results suggest that shifting budgetary resources to subnational governments is improving economic growth in young developing federations on the order of a one percentage point increase in the subnational share of total government expenditures which leads to a 0.716 percentage point increase in economic growth. These findings thus verify that decentralization of expenditure also has significant and positive impacts on economic growth in developing federations. What is more, our results show that expenditure decentralization in these countries would have a greater impact on growth than tax revenue decentralization. Thus, the empirical findings support the healthy impact of fiscal decentralization on economic growth in developing federations, and this confirms that fiscal decentralization from both sides, tax revenue and expenditure, can be a growth stimulator. As noted earlier, the empirical literature covering economic growth and decentralization has not come to a consensus regarding the impact of decentralization on growth. This study focuses on young federations (as defined), and the use of more recent data sets the analysis and results apart from the previous literature. First and foremost, the focus on these countries provides important insights into the potential benefits to decentralization for a large number of countries that are early in the decentralization process. Comparing these countries’ experiences to those of advanced, decentralized economies is not appropriate for setting expectations regarding the impact of decentralization. In addition, by utilizing more recent data than other studies, we are able to take advantage of a longer panel of the decentralization process.
Robustness Testing
To check the robustness of the empirical results, the study tests several versions of the basic model. In this section, several control variables are introduced such as corruption, investment, institutional quality, democracy, and the size of the public sector and the results show a positive and statistically significant impact of revenue and expenditure decentralization on economic growth.
Furthermore, the interaction terms of corruption, institutional quality, democracy, and size of the public sector are introduced to highlight the role of such factors along with fiscal decentralization on economic growth in developing countries.
The interaction term of corruption reports a significant and negative impact on economic growth. This shows how fiscal decentralization in corrupted economies can undermine growth. Bird and Vaillancourt (1998) pointed out that to implement a successful process of fiscal decentralization, subnational governments that are responsible for the provision of public goods and services require not only the retention of some degree of independence in their revenue decision-making (i.e., clear and transparent tax assignments), but also sound accountability mechanisms and adequate institutional capacity. For this reason, we have inserted institutional quality as a control variable in the econometric model. Moreover, as stated by Martinez-Vazquez and McNab (2003), greater accountability may pave the way to greater productive efficiency if subnational governments perceive sufficient incentives to innovate in the production and/or supply of public goods and services.
Based on our findings, economic growth can be influenced by the level of perceived corruption and by the quality of the country’s institutions (Table 7). The results highlighted that the positive effect of fiscal decentralization on economic growth is tempered if the country is plagued with corruption, has weak institutions, and suffers from political instability. The interaction terms of institutional and democracy quality show a positive and a significant impact on economic growth. Thus, based on these findings, institutional quality and democracy are complementary factors to augment the impact of fiscal decentralization on economic growth in developing federations. This reveals how a relatively corruption-free country featuring healthy institutions and a stable political environment can take fuller advantage of the effects of decentralization to promote economic growth. However, the interaction term of the public sector size shows an insignificant association with economic growth. This explains that the size of the public sector is not seen as a complementary factor to promote economic growth by means of fiscal decentralization.
Finally, the other control variables suggest that education and labor force have a positive and statistically significant impact on economic growth, and that the inflation rate has a significant and negative relationship—supporting the hypothesis that a lower inflation rate would yield higher economic growth (Lucas, 1973).
Conclusion
In the world economy, federal countries are not that many though they account for over 40% of the World’s population (Forum of Federations). Among those countries identified as federal, we are interested in the analysis of the impact of fiscal decentralization on the economic performance of federal developing countries. Generally speaking, in developing economies, the poor economic performance of macroeconomic indicators is often attributed to the failures of centralized bureaucracy and centralized decision-making. According to Martinez-Vazquez and McNab (2003), a determined movement toward fiscal decentralization has often been justified on those very grounds. As a result, many national and international consultants advocate for fiscal decentralization as one means to attain sustainable growth and prosperity. Moreover, decentralization, particularly of fiscal matters, is also a frequent prescription advised by international organizations to enhance economic growth in centralized developing economies. For instance, substantial resources have been allocated for programs that promote decentralization of fiscal assignments, most notably from a joint operation of the OECD, the World Bank, the Council of Europe, the Open Society Institute (Budapest), the United Nations Development Program (UNDP), and the United States Agency for International Development (USAID) between 1993 and 2008. In this article, the empirical investigation suggests a positive and direct impact of fiscal decentralization on economic growth in the countries studied—developing federations over the period 2000–2015. The results show that for these federations, over a significant time series, tax revenue and expenditure decentralization impact economic growth positively. In the most expensive regression with multiple controls, the impact is of great relevance given that one percentage change in tax revenue decentralization yields between 0.528 and 0.832 increase in economic growth and one percentage change in expenditure decentralization yields between 0.046 and 0.282 increase in economic growth. Policymakers in the developing world are facing an increasingly urgent need to explore new channels to promote economic growth in their nations. In this article, we show evidence of the economic efficiency benefits of decentralization in these countries, suggesting that decentralization could be one of the key policy choices for nascent federations and countries that are considering to initiate or to deepen their decentralization processes.
Footnotes
Appendix
Summary of Selected Literature on Fiscal Decentralization and Economic Growth.
| Author | Period of study | Countries | Econometric model | Dependent variables | Main findings |
||
|---|---|---|---|---|---|---|---|
| Fiscal decentralization revenue | Fiscal decentralization expenditure | Other supporting variables | |||||
| Zhang & Zou (1998) | 1978–1992 | China | Least Square Dummy Variable | Economic Growth | Negative Relationship | Negative Relationship | Positive Relationship with Labor Growth |
| Davoodi & Zou (1998) | 1970–1989 | 46 Countries | OLS | Economic Growth | Negative Relationship in Developing Countries | Negative Relationship in Developing Countries | Negative Relationship with Population Growth |
| Demello (2000) | 1970–1995 | Panel of 30 Countries | Panel Regression | Inter- government Fiscal Relationship | Negative Relationship in Developing Countries | Negative Relationship in Developing Countries | |
| Jin & Zou (2005) | 1979–1999 | China | Panel Regression | Economic Growth | Positive Relationship | Positive Relationship | Positive Relationship with Investment and Openness |
| Akai & Sakata (2002) | 1988–1992 | Panel of 50 U.S. States | OLS | Economic Growth | Positive Relationship | Positive Relationship | |
| H. Jin et al. (2005) | 1979–1993, 1994–1999 | Panel of 30 China Provinces | Panel Regression | Economic Growth | Positive Relationship | Positive Relationship | |
| Iimi (2005) | 1997–2001 | Panel of 32 Countries | Panel IV Regression | Per-Capita Growth | Positive Relationship | Positive Relationship | |
| Stansel (2005) | 1960–1990 | 314 Metropol-itan Areas USA | OLS | Economic Growth | Positive Relationship | Positive Relationship | |
| Martinez-Vazquez & McNab (2006) | 1972–2003 | Panel of 180 Countries | Panel IV Regression | Economic Growth | No Direct Relationship | No Direct Relationship | Fiscal Decentralization Promote Price Stability |
| Barankay & Lockwood (2007) | 1982–2000 | Swiss Cantons | Panel Regression | Government Efficiency | Positive Relationship | Positive Relationship | |
| Facchini & Testa (2008) | 1995–2001 | Brazil | Two Period Model | Public Goods Provision | Positive Relationship | Positive Relationship | |
| Thornton (2007) | 1980–2000 | 19 OECD Countries | OLS | Real GDP |
No Significant Positive Relationship | No Significant Positive Relationship | |
| Kappeler & Valila (2008) | 1995–2005 | Panel of 10 EU Countries | GMM | Public Investment | Positive Relationship | Positive Relationship | |
| Trillo & Rabling (2008) | 2002 | Mexico Survey Based | GMM | Weak Institutions | No Significant Positive Relationship | No Significant Positive Relationship | |
| Freinkman & Plekhanov (2009) | 1996–2001 | Panel of 77 Russian States | Panel Regression | Economic Growth | Positive Relationship | Positive Relationship | |
| Herath (2009) | Sri Lanka | OLS | Per-Capita Income | No Significant Positive Relationship | No Significant Positive Relationship | ||
| Jutting (2009) | 1995–2991 | China | Fixes Effect Model | Health Care | Positive Relationship | Positive Relationship | |
| Gemmell et al. (2013) | 1972–2005 | Panel of 23 OECD Countries | Pooled Mean Group | Economic Growth | Positive Relationship | Negative Relationship | |
| Neyapti (2010) | 1980–1998 | Panel of 16 Countries | OLS | Fiscal Deficit | Significant Negative Relationship | Significant Negative Relationship | Positive relation with Population |
| Baskaran & Feld (2013) | 1980–2000 | Panel of 18 OECD | Fixed Effect Regression | Public Sector Size | No Significant Positive Relationship | No Significant Positive Relationship | |
| Kyriacou & Roca-Sagales (2011) | 1996–2005 | Panel of 27 OECD | Regression | Govt. Quality | Positive Relationship | Positive Relationship | |
| Bojanic (2018) | 1972–2015 | 12 American Countries | Generalized Least Square, GMM, and IV Regression | Economic Growth | Negative Relationship | Positive Relationship | |
Source. Compiled by the Author.
Note. OLS = ordinary least squares; IV = instrument variable; OECD = Organisation for Economic Co-operation and Development; EU = European Union; GMM = Generalized Method of Moments.
Declaration of Conflicting Interests
The author(s) declared no potential conflicts of interest with respect to the research, authorship, and/or publication of this article.
Funding
The author(s) received no financial support for the research, authorship, and/or publication of this article.