
Abstract
This research identifies the critical risk factors in the management of construction projects and assesses their relationship on the project implementation constraints of cost, time, and quality, in order to gain a deeper understanding of those factors hindering project success in in Caribbean small island developing states experiencing the dilemma of transitioning to be sustainable in economy and environment. Through three-phase surveys, we identify 26 risk factors from five risk source categories that are more region-specific to influence construction project management, discover strongly positive relationships between a set of risk variables and a set of constraints, and estimate the relative importance of every dimension to the integrated risk-constraint canonical correlation. In risk categories, management has the dominant effect followed by design, contractual, and financial source. For implementation constraints, cost exhibits the most dominance, followed by time and quality. Overall, the directions and magnitudes of interactions gauged in the risk-constraint nexus provide a guideline for improving project planning, thus offering a reference value to other developing countries.
Introduction
Risk is considered to be a threat of damage, injury, or any other negative outcome that is generated by external and internal vulnerabilities, but which may be evaded through preventive action. Since risk hinders organizational goals, managers pay more efforts to identify and assess it and to take the necessary steps to eliminate or reduce its threats. In project management (PM), risk management is a key process to obtain a successful project in an uncertain environment (Raz & Michael, 2001). Though PMBOK® Guide (2013) mentioned that project risk might positively affect project objectives, management generally focuses on the negative effect. Project managers need to know the characteristics and origins of a wide variety of risks, evaluate their outcomes, and control them, which cover risk identification, risk analysis, risk response, and risk monitoring and controlling (Nawaz et al., 2019; Tang et al., 2007). Since risk identification is the first stage of risk management, identifying risk factors is critical in PM and should be addressed as a top priority for any project.
Due to a lack of tools and experiences, many international funding agencies support developing countries through local involvement. Their goals are to boost these countries’ economic development and improve the standard of living of their residents. However, some participators found that various well-defined standards and procedures might not fit well with a local case due to cultural differences (Liu et al., 2015). Salawu and Abdullah (2015) noted that the combinations of such reasons cause a high failure rate of project execution. The construction sector is susceptible to more risk than many other sectors. Choudhry (2019) argued that risk in construction has drawn increasing attention because risk affects productivity, performance, quality, and budget of projects in constructions. Iqbal et al. (2015) indicated that projects can be accomplished successfully by identifying the risk sources connected with implementation of project in response to the limited funds and time. Therefore, it is vital to understand and proactively deal with risks, constraints, and their interactions that have synergism in the consequence of a designated project since projects are usually started in highly uncertain environment where they are challenged by multi-restraints.
Over the past few years, Caribbean small island developing states (SIDS) have been experiencing prosperity significant increase in construction sector activity to improve the living quality and increase accommodation supply for the tourism and hospitality industry. Despite proliferation of construction activity in developing countries (Khan, Bibi, Lorenzo, et al., 2020; Khan et al., 2022), a greater number of projects has been delayed for human, non-human, and miscellaneous reasons (Choudhry 2019), for example, climate change, environmental alterations, political instability, pandemic, and terrorism (Khan, Bibi, Lyu, et al., 2020; Kumail et al., 2022). SIDS are most vulnerable in transition to sustainability in the world (Robinson, 2017).
The successful projects appeared to be scarce cases in public and private sectors. It is urgent to cope with construction risks and constraints in such an unprecedented dilemma for economy blooming next decades. Constraint-contingency planning is very crucial to the prospects of projects. From the perspective of iron triangle, three main constraints (time, cost, and quality) are influenced by one another in the trade-off balance. Most research have associated risks and their impacts on any two of the three constraints, for example, time delays and cost overruns (Choudhry, 2019; Vivek & Rao, 2022; Vu et al., 2017; Xia et al., 2018). It seems to be still a lack for studies to explore the integral relationship between risk and triangle constraints. Furthermore, risks vary with regions and industries. Risk identification are prerequisite for project performance and success. However, with very few studies assessing risk management factors of construction projects in Caribbean SIDS, this study aims to identify and rank critical risk factors hindering project success and measure their impacts or effects integrally on the project implementation triangle constraints. Two research questions (RQ) are to be addressed as follow.
RQ1: What are the underlying major risk factors of PM practices in Caribbean SIDS?
RQ2: How do these factors affect the project implementation constraints in quantities?
In a wide range of methods and models which are deliberately developed to analyze construction risks, Choudhry (2019) suggested that statistical methods are convincing and results of questionnaire are realistic. Initiatively bridging the gap between pragmatism and theory with the strategic thinking of “management by figures,” this study adopts a three-phase survey to further quantify the magnitude of nexus that risks interlinked to constraints based on the relative weight of each type of risk as well as constraints. In other words, this study can provide risk management reference for other similar developing countries to smoothly achieve project goals within given time, cost, and quality throughout the construction process and operative stage of the project cycle.
The paper is organized as follows. Section 2 presents a literature review. Section 3 proposes the methodology of the study. Section 4 illustrates results and findings. The final section gives conclusions.
Literature Review
Risk Factors
To assess project risk, we need to find the risk factors that affect the success of project practices. Since the elements of these factors are the main basis in the risk assessment/management process, many papers have extensively investigated them. Table A1 in Appendix A lists some typical studies on the construction industry by their source, elements of risk factor, development focus, application, and notes on factor origin and usage. Since there is no universal name for covering all studies, we list the words of risk factor, type, category, area, and criteria to indicate the same target in the second column of the table. We tabularize 26 references from 2000 to 2020, focuses of which include risk management/assessment process, investigating risks to stakeholders, analyzing project cost, and other objectives. Since sustainability is the current trend in construction projects, we list two extra works for comparison: one for a housing project (Wang et al., 2014) and the other for a general review (Martens & Carvalho, 2017). Despite all works being for construction, the specific areas comprise transportation, buildings, roads, bridges, aviation, and international projects. Table A1 also provides information on geographical locations, such as the U.S., UK, Australia, China and Hong Kong, Vietnam, Malaysia, Singapore, Thailand, India, Pakistan, Sri Lanka, Saudi Arabian, Qatar, Lithuania, Egypt, Nigeria, and Mozambique. Trend of risk factor identification of construction project seem now to be shifted from developed countries to less developed countries. However, very little attention has been paid to SIDS.
From the aspect of taxonomy, Zayed et al. (2008) divided risks into two major hierarchies: macro-level and micro-level. Macro-level risks exist at the company management echelon whereas micro-level risks exist in PM. Bearing in mind the objective of this study, the focus is mostly on the micro-level hierarchy of risks. Choudhry et al. (2014) systematically classified these micro-level risks into seven main categories: financial, design, contractual, management, construction, health and safety, and external. There are 37 risk factors under these seven categories with slight modifications on word usages. Nonethesless, the literature still has a significant gap in discussing risk factors in construction as they relate to SIDS development. After comparing with other references, we add a factor “unforessen adverse ground conditions” for completeness of the risk taxonomy in accordance with all the categories in Dixit et al. (2020). Thus, we choose 38 risk factors as the foundation of Delphi study and the succeeding preliminary test for research questionnaire design.
Project Implementation Constraints
For project management, project constraints are restrictions such as limited funds and manpower, maximum construction time, higher quality, and environmental limits, whose success is dependent on how well these constraints are balanced. Over the years, PM practices have improved in delivering projects by looking at the impact of the three main constraints on project quality: scope, cost, and time. These three are PM constraints or called project management triangle or iron triangle and have been developed and utilized since the 1950s and become the most influential parameters to measure the success of PM (Andersen, 2016; Raffaini & Manfredi, 2022). They are also considered as project implementation constraints here, because they have close relations to the outcomes of project execution. Baloi and Price (2003) targeted global risk factors affecting construction cost performance, especially in developing countries. San Cristóbal (2009) also identified time, cost, and quality as the three most significant factors. Toor and Ogunlana (2010) found that the triditional measurements of the iron triangle do not fit the requirement of a large construction project in Thailand and subsequently developed nine key performance indicators. Basu (2014) concentrated on the key role of quality in the triangle and highlighted the importance of organization quality to deliver project success. Choudhry et al. (2014) considered the triangle (time, cost, quality) with safety as one project performance in analyzing bridge construction in Pakistan. Since the definitions and uses of the triangle are rather flexible, sometimes mixed with risk factors, this study takes the triangle as the implementation constraints of PM (PM Tips, 2019).
Many unforeseen events occur during construction that negatively alter the project’s cost and schedule, resulting in an escalated cost that is above the initially budgeted amount or a project that runs behind schedule (Kaliba et al., 2009). Taking government projects as an example, many scholars discovered that project delays and cost overruns are a result of poor or insufficient risk management (Kwak & Smith, 2009; Patanakul, 2014; Tysseland, 2008). Accordingly, in construction projects management, it is imperative to understand that the variables suggested in the triple constraint model are important, and risk also plays a critical role to affect constraints (Zou et al., 2007). Since attempts to comprehend the sophisticated risk classifications and the complex risk-constraints relationships could be a burden when dealing with PM in developing countries, this study proposes on an explicit framework investigating how project risk factors influence project implementation constraints and what extent of the bilateral influence as well as the relative weight of every factor to the overall relationship by quantitative analysis. Hereby, we develop a hypothesis as follows.
Methodology
This research was executed in three successive phases to examine the proposed framework where we posit there are hypothesized relationships among the region-specific risk factors identified in the project planning stage and constraints in the implementation stage, and the causality to be existing in these two adjacent stages of the project management cycle. This study aims to gauge the overall correlation between these two theoretical constructs of risk and constraints and estimates the relative importance of each single risk factor as well as constraint to the overall correlation/canonical association. The quantitative results can provide useful reference to simplify constraint-contingent risk management by numbers rather than intuitive grit.
In a three-phase survey, Delphi method is first performed to identify the significant risk factors more specific to SIDS. Then, based on the resulting significant risk factors from the Delphi consensus, we develop a questionnaire for the further investigation of risk-constraint nexus. In the second phase, a preliminary test is conducted to ensure the adequacy of questionnaire design in terms of content validity, naturalness, conciseness, and language. In the third phase, a questionnaire survey is consecutively carried out to examine the proposed research framework and hypotheses. The data collected are then analyzed by factor analysis for testing questionnaire reliability/internal consistency and canonical correlation analysis as well. The latter analysis is subject to the goodness of fit through tests such as Pillai’s, Helling’s, Wilk’s lambda, and Roy’s multivariate criteria (Johnson & Wichern, 2007). Figure 1 visually demonstrates the three-phase survey method adopted by this research.
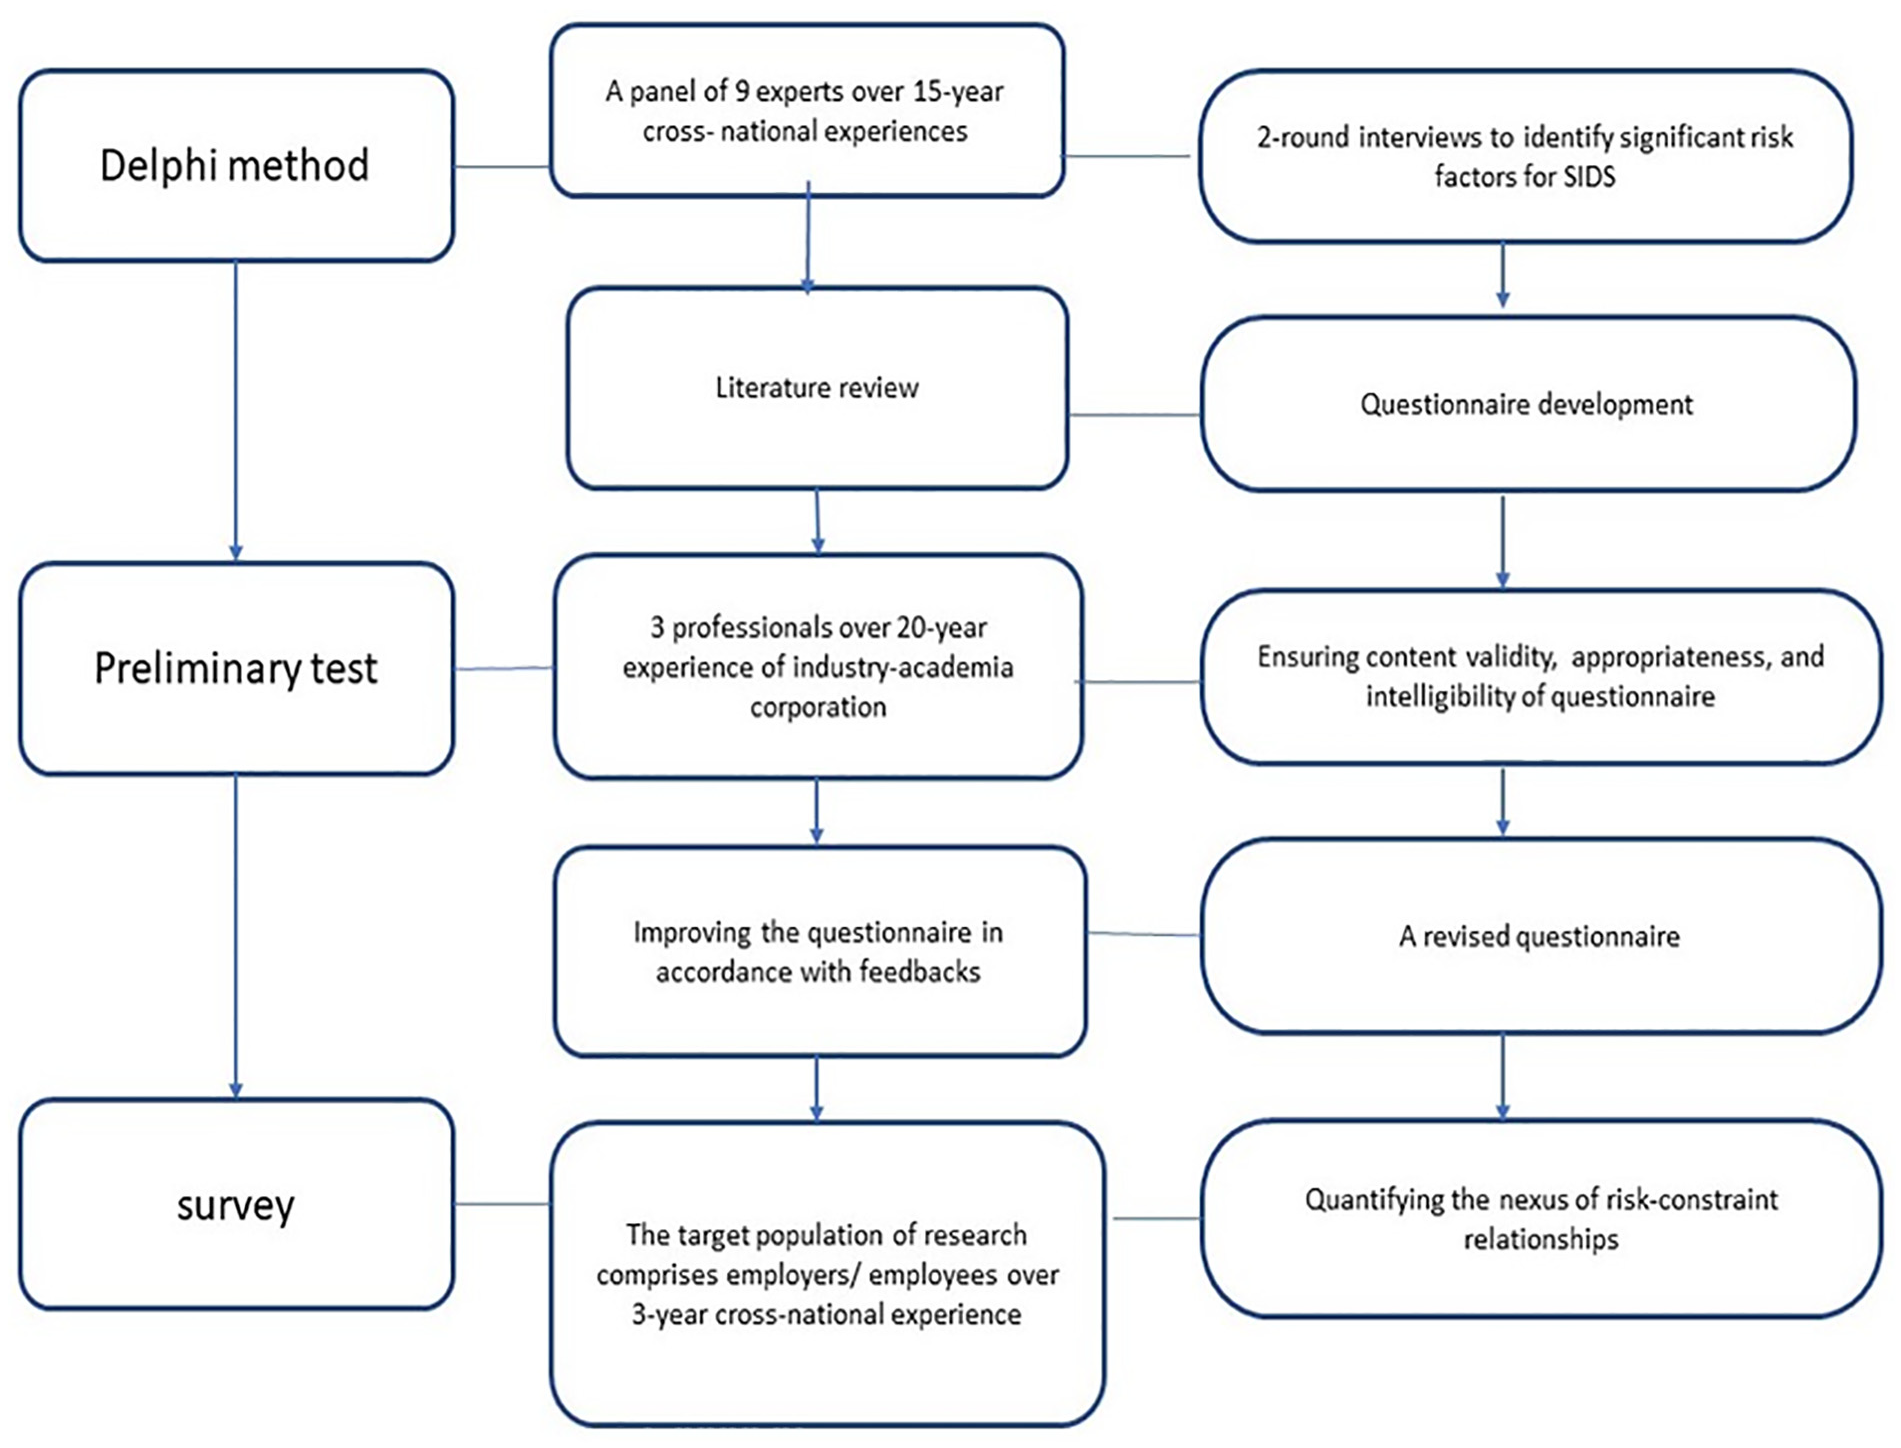
Three-phase survey.
Canonical correlation analysis is an appropriate method to examine the proposed framework and quantify the relationships among variables since it relaxes the limitation of the multiple regression method in which only a single dependent variable is allowed in the model. Instead, canonical correlation analysis can take a set of variables as dependent variables. It connects two sets of variables by finding linear combinations of variables that maximally correlate to be an extension of multiple regression and correlation analysis. All the above-mentioned statistical methods are executed by IBM SPSS in version of 26.
Delphi Method and Identification of Risk Factors
There is evidence that the typology of risk sources is not globally identical (see Table A1). Instead, it changes by regions. Considering the idiosyncrasy of recent PM practices in Caribbean SIDS, Delphi technique is used to identify the significant risks and their relevant categories that are most applicable in the local construction environment. Although Delphi study does not have a universal standard form, it is suggested to call for a Delphi panel more than one round and have to allow panelists to change their opinions according to the feedbacks of data summary (Kermanshachi et al., 2016). In the first phase of this study, we undertook two-round panel interviews. The Delphi panel comprised nine well-versed construction experts having over 15 years of international national working experience across eastern Caribbean small island states. Of the nine panelists, two are project managers, two are engineers, two are consultants, one is an architect, one is a client/owner, and one is a subcontractor. The panel was asked the question whether they agreed 38 risk factors significant for the SIDS construction project on a 5-point Likert scale (5 = strongly agree, 4 = agree, 3 = neutral, 2 = disagree, and 1 = strongly disagree). If the average score of a risk factor was below 3, it implied that this factor was deemed to be insignificant.
The results from the first round showed that 12 factors were insignificant since their average scores were less than 3, including inflation (the average score = 2.11), strikes and theft (1.11), excessive inspections and audits (1.00), unexpected weather (2.22), accidents (2.67), equipment and property damage (2.56), fatalities (2.78), delay in approval (2.44), political instability (1.44), third-party delay (2.56), unstable government policies (1.11), and site restrictions (1.89). In the second round, the panel was informed that they could tune their originally assigned score to risk factors based on the feedback of the first-round results. It was very interesting that the statistical outcome of the second round remained unchanged, same as that of the previous round. None of panelists adjusted their scores. Therefore, the panel reached that consensus that the initial 38 risk factors in seven main categories were narrowed down to 26 risk factors significant in five risk categories, as summarized in Table 1.
Selected Risk Factors and Their Categories.

Questionnaire Design and Preliminary Test
In light of the selected 26 risk factors, their measurements in this questionnaire were respectively adopted from those in previous studies (Choudhry et al., 2014; Doloi, 2013; Kaliba et al., 2009; Mishra, 2018). This questionnaire consisted of 3 sections. First, “risk management policy & implementation” was to understand the perceived importance of risk management and the extent of implementation in the respondent’s organization. Second, “evaluation of risk factors” was to rate each risk factor based on the frequency of occurrence and its effect on the constraints of time, cost, and quality. The third section gathered “general information” on the socio-demographics of respondents. Answers to the questions about perceived importance of risk factors, constraints, and usage frequency of management techniques are all structured in a 6-point Likert scale ranging from 1 to 6 (Chomeya, 2010), indicating strongly disagree (SD) to strongly agree (SA), in order to mitigate the central tendency bias in survey.
Proceeding to the second phase of this empirical study, we invited three professionals having over 20-year experience of industry-academia corporation in construction field to guarantee content validity and intelligibility of the questionnaire. Professionals’ feedbacks were used for the improvement in question coverage, comprehension, format, organization, sequencing, and so on. After several flaw/error corrections, the content (expert) validity of this questionnaire was completely examined, and the final version of questionnaire was then determined accordingly.
Research Framework
These selected 26 factors contribute to the integral whole of risk sources perceived in eastern Caribbean small island states. This paper endeavors to statistically aggregate them to represent a theoretical construct of risk. The counterparts in this study are project implementation constraints of cost, time, and quality. Cost refers to a project’s budget or funds allocated to a project, whereas time refers to the schedule or project duration, and quality focuses on the project’s outcome and results. Analogous to risk, these three variables are combined to derive a theoretical construct of constraint. Canonical correlation is employed to examine relationships between risk variate (comprised of financial, contractual, design, management, and construction variables) and constraint variate (comprised of cost, time, and quality dimension) via measuring the relative contribution of each variable to the canonical functions that are extracted. Thus, the underlying structure of these two sets of variables that may associate with one another can be discovered integrally.
Figure 2 illustrates the proposed framework. We posit that risk features a significant dimension that is linearly composed of the five risk categories (to be defined as five research variables for canonical correlation analysis), each of which comprises their respective subclass risk factors. Likewise, constraint is primarily characterized by a linear combination of the three constraint variables. In this vein, we investigate the issue of whether risk correlates with constraint and how such a relationship is formulated, if at all. Acknowledging the exploratory nature of this study, the exact weights/importance of composite variables to the risk variate and constraint variate are not available beforehand. In other words, this research attempts to quantify the relationships of the proposed framework and hypothesize that each variable is not identically important.

Proposed framework and hypotheses.
Data Collection
The target population of this study covers experienced professionals who have been involved in the construction industry for 5 years or more, regardless of private or public sectors. They are but not limited to project managers, architects, engineers, quantity surveyors, and contractors with cross-national working experience for international enterprises in Saint Lucia. Due to the peculiarity of the target population who can provide more articulate perceptions about SIDS construction situation based on their cross-national comparison, two sampling techniques are utilized in this study: selective sampling and snowball random sampling procedure to ensure the target participants accessible and eligible. We initially distributed 200 questionnaires via e-mails, social network links, various online social media sites of construction-related communities and offline personal contacts.
The final survey was completed by 151 valid respondents, of which 52.9% represent the private sector and the remaining 47.1% the public sector. Their occupations (job titles) include project manager/coordinator, contractor, architect, engineer, consultant, accountant, and “other” professionals alike. Of the respondents, 70.6% have over 10 years of experience within this sector.
Empirical Results
The resulting descriptive statistics of the 26 risk factors from questionnaire survey are summarized in Table 2. All risk categories are normally distributed via the inference of the Shapiro-Wilk test (α = .05). The top 6 highest-ranked perceived risks are construction delays (the mean score = 4.549), inadequate project planning (M = 4.255), design changes (M = 4.235), financial delays (M = 4.137), lack of coordination (M = 4.118), and poor site management and supervision (M = 4.118). On the contrary, the lowest-ranked risk is misuse of funds (M = 2.569).
Descriptive Statistics of the 26 Risk Factors.
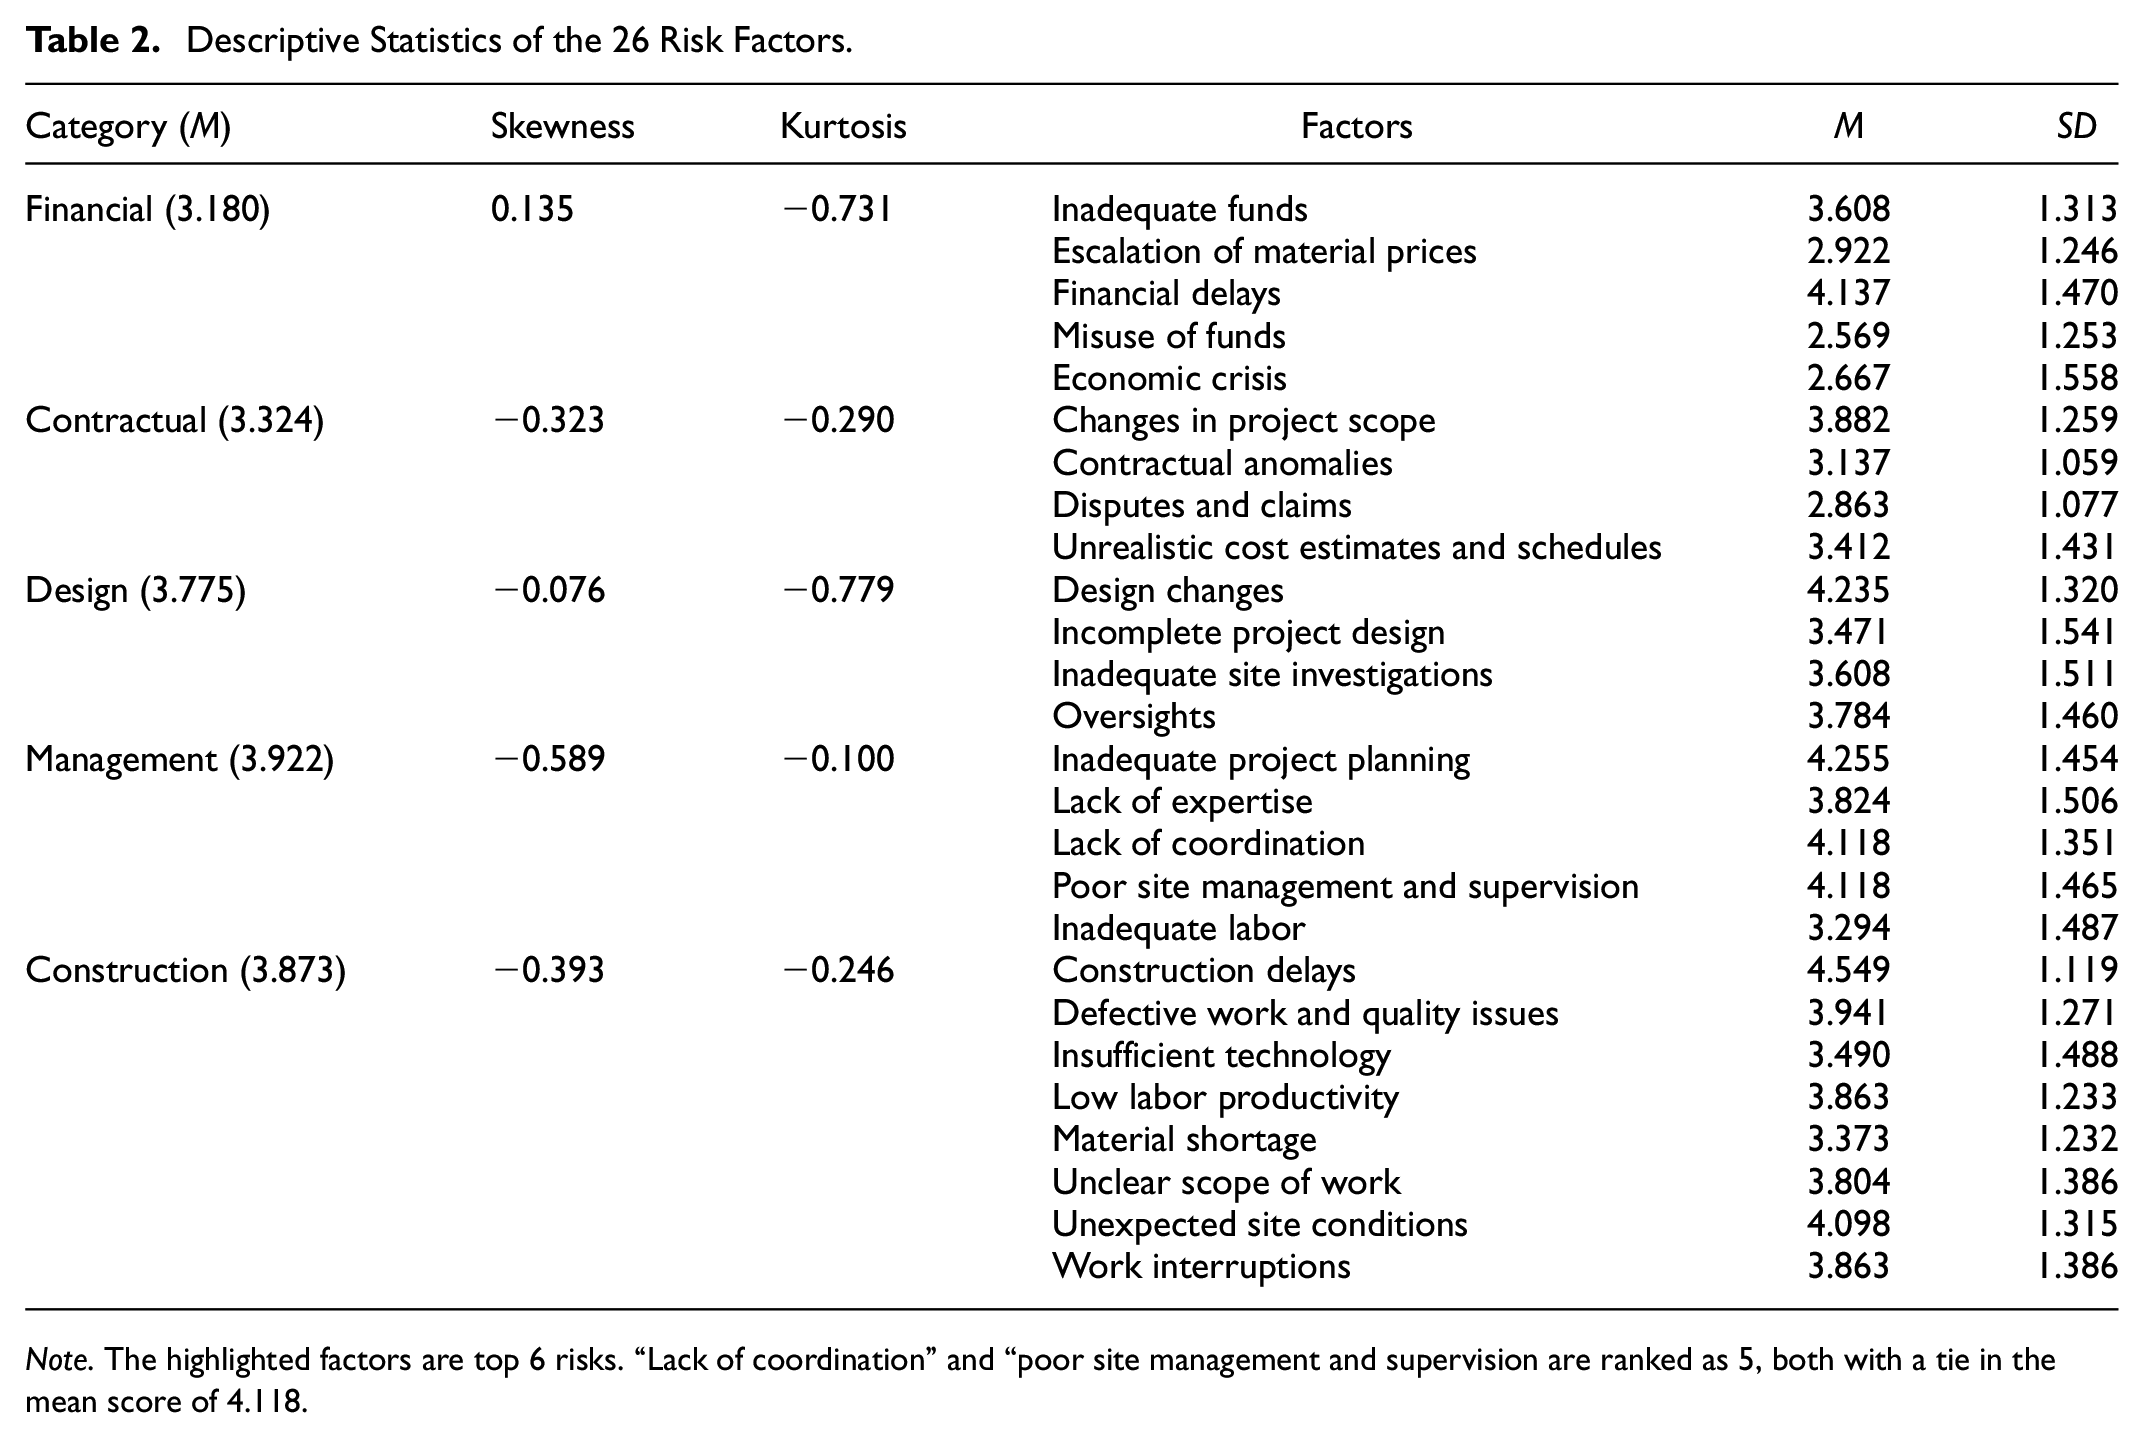
Note. The highlighted factors are top 6 risks. “Lack of coordination” and “poor site management and supervision are ranked as 5, both with a tie in the mean score of 4.118.
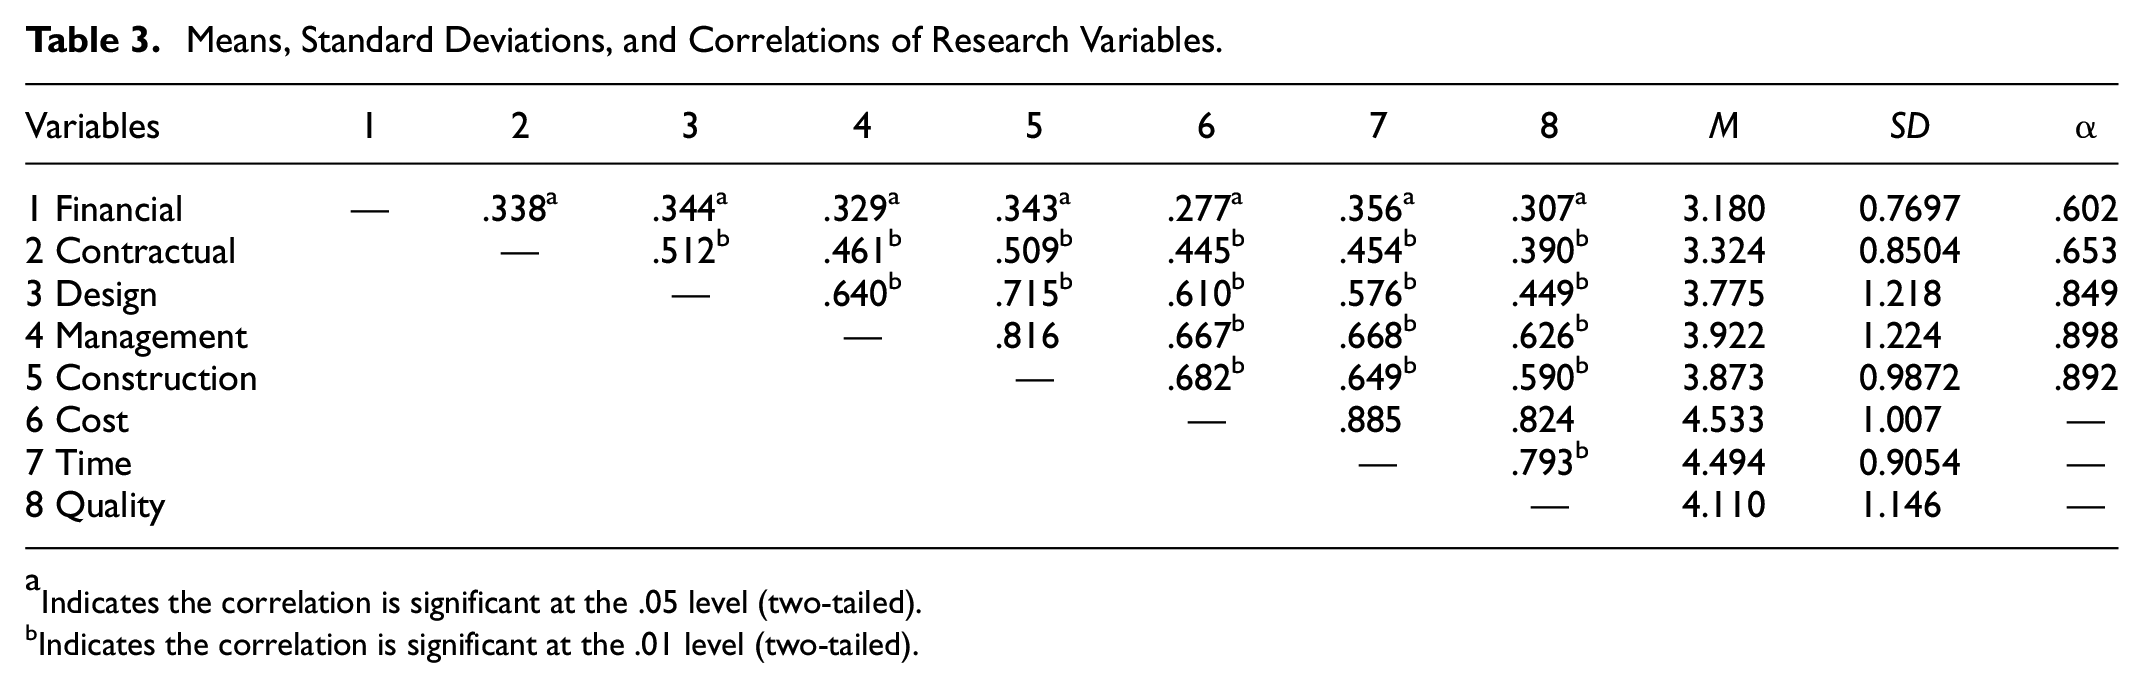
The 26 risk factors are examined by KMO and Bartlett’s test. The value of KMO is 0.64 and the p-value is .000 in Bartlett’s test, suggesting that the 26 factors can be confirmatively classified into five categories as expected. The internal consistency of the five risk categories is separately tested by Cronbach’s alpha. Three out of the five risk categories result in values of Cronbach’s alpha being greater than .8, indicating high reliability (Ursachi et al., 2015), while the other two factors of financial risks and contractual risks have Cronbach’s alpha values of .6 and .652, respectively, presenting an acceptable level of reliability.
Table 3 exhibits the statistics of research variables. Given that all the correlations are significant at the .05 level, not only are the internal relationships of constraints in the iron triangle verified, but its external relationships to the corresponding risk factors are also manifested. The highest correlation (.885) is between cost and time constraint, followed by the correlation (.824) between cost and quality, and the third highest correlation (.816) is between construction and management risks. Other important observed correlations are between construction and design risks (.715), management and design (.640), construction and contractual (.509), and contractual and design risks (.512). Management risks and each of the constraints (cost, time, and quality) have a relatively higher relationship at least with correlation value of .610. The weakest correlated variables are financial and cost (.277) in spite of their relationship being significant.
Means, Standard Deviations, and Correlations of Research Variables.
Indicates the correlation is significant at the .05 level (two-tailed).
Indicates the correlation is significant at the .01 level (two-tailed).
We note that these pairwise relationships signal an urgency to address the interdependence collectively amongst risk factors and constraints from practitioners’ perspective in order to proactively deploy more effective project management measures.
To examine the proposed framework and research hypothesis, a standard data analysis procedure of canonical correlation is implemented (Johnson & Wichern, 2007). Canonical correlation analysis lends itself to this empirical dataset and exhibits a goodness of fit by satisfying Pillai’s, Helling’s, Wilk’s lambda, and Roy’s multivariate criteria, all of which achieve the significant level of a p-value less than .05. The first primary canonical correlation coefficient is .74153 with an explained variance of 89.51% and an eigenvalue of 1.22153, manifesting that risk and constraint variates have a strongly positive relationship, offering a striking explanation for the variances. Thus, Hypothesis 1 is supported. Table 4 shows the canonical coefficients and correlation of each variable attributing to its own canonical variate (herein, risk, or constraint). The relative influence of each variable on its own variate is gauged by canonical standardized coefficients that function as the regression coefficients in some sense.
Coefficients and Correlations Between Covariate and Variables (in Descending Order).

Figure 3 visualizes the integral underlying structure of the study’s variables, linearly formulating the canonical functions of variates with weights based on their coefficients. In the constraint variate, cost has the most importance with a coefficient of .53025, followed by time and quality. In the risk variate, management is the most influential variable with a coefficient of .46222, which outweighs construction, followed by design, contractual, and lastly financial risk. It seems that quality constraint and financial risk are to be ranked with the least priority in project professionals’ consideration. Hypotheses 2 and 3 are thus supported since the weight of each factor is not equally important.

The diagram of canonical correlation results.
Conclusions
Through a three-phase analysis, this study has penetratingly examined the significant risk factors that are hindering construction project success in Caribbean SIDS. The study investigates the overall correlation between two research construct variables (risk and constraint) and estimates the relative importance weight of each single factor from either side (risk or constraint) to this integrated association. Research questions cast by this paper are thus answered by this embedded risk-constraint structure, which is evidently more feasible and region-specific to such a developing country as Saint Lucia but was unverified in the past literature.
The findings are recapitulated as follows.
Of the 38 risk factors exclusively and exhaustively adopted from previous studies, 26 risk factors attributable to five different groups of risk sources are identified as the most relevant, feasible typology of construction project settings in Caribbean SIDS like Saint Lucia.
An underlying structure of two sets of variables, respectively formulating risk and the project constraints, is unveiled via canonical correlation analysis. A strongly positive relationship exhibits a canonical correlation of .7415 between risk (comprised of financial, contractual, design, management, and construction) and constraints (comprised of cost, time, and quality). This suggests these two categories need to be jointly addressed through the use of effective PM practices.
The relative importance of each variable to the risk-constraint relationship is derived. In the risk category, management is the most influencing variable with a coefficient of .46222, outweighing construction, followed by design, contractual, and lastly financial risk. Cost gains have the most importance with a coefficient of .53025, followed by time and quality in the constraint category. Every factor identified by this research has an undeniable impact on the risk-constraint nexus. Notedly, management risks and constraints on cost should play more critical roles as the primary drivers of a positive reaction to any PM changes/innovations.
Knowing the direction and magnitude of resonance to any change in each factor of the risk-constraint structure can help leverage favorable outcomes for project management. Coping with uncertainties can also improve managerial measures to project success that rely on the risk-constraint relationships, which have been manifestly quantified by this study. This study contributes to offering insights for project stakeholders to evaluate the prospective problems and then formulate a suitable strategy to prevent risks and proactively mitigate the negative impacts on constraints. The concept of this research can be extended to other developing countries within the Caribbean region since they are prone to similar systemic challenges and risks.
Limitations and Suggestions
The limitations of this paper are the time frame and the target sample. Despite the fact that experienced professionals can offer comprehensive and highly valued advice and assistance for project management, a larger number of diversified sample in other countries is still suggested to be included to elicit more profound multi-faceted insights. Future studies can compare the effects of various risks and constraints/restrictions that may vary with the impacts of social, political, legal, and environmental conditions, like the pandemic, on project management in different industries or economic contexts. Other factors such as sustainability and culture impact have recently been gaining increasing attention in risk management. Thus, they are recommended to be taken into account as a complement to the current study.
Footnotes
Appendix A
The Typical Scope of Risk Factors in the Construction Industry.

| Source | Elements of risk factor/category/area/criteria | Development focus | Application | Note on factor origin and usage |
|---|---|---|---|---|
| Rahman and Kumaraswamy (2002) | 41 types of risks | Investigation of joint risk management of contractors and owners | Construction | Collected from 47 professionals and participators in Hong Kong and China |
| Baloi and Price (2003) | 7 groups of risk factors: estimator (4 biases); design (4 factors); level of competition (4 factors); fraudulent practices (3 factors); construction (6 factors); economic (5 factors); and political (14 factors) | Identification of global risk factors affecting cost performance | Construction | (1) Combination of literature and discussions with contractors in Mozambique (2) Provide a fuzzy decision framework |
| Chan et al. (2004) | Project success factors in 5 categories: project related (5 factors); procurement related (2 factors); project management (9 factors); human-related (22 factors related to client and the project team); and external (6 factors) | Project success factors | Construction | Obtained from a literature review |
| Ghosh and Jintanapakanont (2004) | 9 risks: financial and economic risk (6 indices), contractual and legal risk (4 indices), operational risk (4 indices), safety and social risk (5 indices), design risk (4 indices), force majeure risk (3 indices), physical risk (3 indices), and delay risk (2 indices) | Identifying critical risk factors | Underground rail project | In Thailand |
| Wanyona (2005) | 5 groups of the sources of financial risk indicators: contract (3 sources); client or professional (5 sources); estimating (6 sources); project risks (2 sources); and external factors (4 sources) | Examination of financial risk management in the cost planning and cost control | Building construction | (1) Survey of professionals in Kenya (2) Provide a general framework (3) Ph.D. Dissertation |
| Ling and Hoi (2006) | 6 risks | Identification of risk factors for international firms | Construction | Interview of 10 Singapore experts whose firms are in India |
| Zou et al. (2007) | 5 categories: related to clients (3 risks); to designers (4 risks); to contractors (13 risks); to subcontractors/suppliers (2 risks); to government agencies (2 risks); and to external issues (1 risk) | Determination of key risks influencing project objectives (cost, time, quality, safety, and environment) | Construction | (1) Parallel surveys in China and Australia (2) Organized from 85 risks within seven groups |
| Zayed et al. (2008) | 1) Macro-level (company area): financial (3 sub-areas); political (2 sub-areas); cultural (1 sub-area); and market (2 sub-areas) 2) Micro-level (project area): technology (2 sub-areas); contracts and legal issues (2 sub-areas); resources (3 sub-areas); design (5 sub-areas); quality (2 sub-areas); construction (3 sub-areas); and others (2 sub-areas) |
Identifying two risk areas and their sub-areas affecting highway projects | Highway construction | (1) Obtained from 4 experts (4 different Chinese cases) (2) Using analytic hierarchy process to weight the risk areas, with effect scores, and to prioritize sub-areas |
| Perera et al. (2009) | 4 types of risk sources: technical and contractual risks (6 sources); economic, financial, and political risks (5 sources); managerial risks (9 sources); and external and site condition risks (3 sources) | Investigation of risk factors and allocation for project management | Road construction | Interview of experts of two foreign-funded road projects in Sri Lanka |
| Zavadskas et al. (2010) | 3 group of project risks: external, project, and internal | Risk assessment process and decision making | Construction | (1) Obtained from 3 experts in Lithuania (2) Using TOPSIS gray and COPRAS-G to prioritize the risks of 4 projects |
| Sharma and Swain (2011) | 7 categories | Risk management process | Construction | Obtained from literature |
| Tamošaitienė et al. (2013) | 19 risks | Risk assessment and decision making | Commercial construction | Using TOPSIS-F(uzzy) to prioritize the risks of 3 projects in Lithuania |
| Choudhry et al. (2014) | 7 categories: financial (6 factors); contractual (4 factors); design (3 factors); health and safety (3 factors); management (6 factors); construction (10 factors); and external (5 factors) | Prioritization of cost and schedule related risks | Bridge construction | Survey in Pakistan |
| Munier (2014) a | 11 risk areas | Collection | Engineering project | General book |
| Wang et al. (2014) | 3 dimensions for sustainability: environment (3 criteria), economy (2 criteria), and social (3 criteria) | Identifying sustainability criteria | Social housing project | Data collected from multiple sources including interviews, document reviews, and on-site visits in England |
| Baghdadi and Kishk (2015) | (1) Three levels: internal; external; and force majeure (2) Internal level: client-specific (14 risks); design-specific (5 risks); contractor-specific (10 risks); subcontractor-specific (6 risks); and consultant-specific (4 risks) (3) External level: political (5 risks); social (2 risks); financial (2 risks); and natural (2 risks) (4) Force majeure: natural phenomena (3 risks) and weather (1 risk) |
Identification of risks and their consequences | Aviation construction | Interview of 13 experts in Saudi Arabia |
| Jarkas and Haupt (2015) | 4 groups of factors: Client (6 factors); Consultant (9 factors); Contractor (10 factors); and Exogenous (12 factors) | Determination of the relative importance of risk factors by contractors | Civil engineering and building construction | Survey of 126 organizations in Qatar |
| Babatunde & Perera (2017) | 25 factors | Prioritization of traffic revenue risk factors | Build-Operate- Transfer road construction |
Combination of literature review and surveys in Nigeria |
| Martens and Carvalho (2017) a | Key factors in sustainability: economic (13 variables); environmental (11 variables); and social (13 variables) | Ensuring sustainability factors | General project management | Obtained from a systematic literature review |
| Seker and Zavadskas (2017) | 14 occupational risks causal factors | Occupational risks | Construction | (1) Survey of 5 experts (in Turkey) (2) Using fuzzy DEMATEL to prioritize causal factors |
| Eskander (2018) | 6 levels of risks: acts of God (6 sub-parameters); physical (4 sub-parameters); economical (5 sub-parameters); political (8 sub-parameters); design (7 sub-parameters); and construction (7 sub-parameters) | Prioritization of influencing risk factors | Construction | (1) Questionnaire was distributed to companies in Egypt and Saudi Arabia (2) Using analytic hierarchy process to prioritize influencing factors |
| Xia et al. (2018) a | No specific risk | Review of the relation between risk management and stakeholder management | Construction | Review of 79 construction related papers |
| Taofeeq and Adeleke (2019) | 4 groups of factors: project related (3 variables); working capital (3 variables); human-related (4 variables); and environmental related (3 varaibles) | Contractors risk attitude | Building, bridge, and road construction | Survey of Grade 7 contractors (highest level) in Malaysia |
| Siraj and Fayek (2019) a | 20 risk categories | Risk identification tools, risk classification methods, and common risks with content analysis | Construction | Review of 130 construction related papers |
| Dixit et al. (2020) | 10 global risk factors | Identification and analysis of global key risks factors | Construction | Obtained from the literature and interview of an India construction company |
| Le et al. (2020) | 40 risks | Prioritization of significant risks | Build-Operate-Transfer Transportation | Interviews and a questionnaire survey in Vietnam |
| Viswanathan and Jha (2020) | 26 risk variables | Identification and analysis of critical risks factors | International construction | Obtained from the literature and from India construction firms |
Review paper or book.
Declaration of Conflicting Interests
The author(s) declared no potential conflicts of interest with respect to the research, authorship, and/or publication of this article.
Funding
The author(s) received no financial support for the research, authorship, and/or publication of this article.