
Abstract
This research aims to develop a school improvement scale determining the current levels and obtaining data for improvement. The need for a valid and reliable scale in process-oriented school improvement studies makes this research important. Based on a sample of 1,043 teachers in Bursa in 2021, the Kaiser-Meyer-Olkin value was .97; the Bartlett test’s chi-square value was significant. The exploratory factor analysis led the scale to consist of 33 items and 5 factors, explaining 69% of the total variance. The load values of effective leadership, school climate, teacher professional improvement, learning environment, and vision-mission varied between .51 and .98 and in the confirmatory factor analysis, with a different sample group, χ2 = 2.33 and RMSEA = .079. Other fit indices showed that the scale has good structural compatibility. Cronbach’s Alpha coefficient showed a high level of internal consistency. Hence, this scale is a valid and reliable tool that can be applied to measure school improvement.
Keywords
Introduction
Today, where the phenomenon of change and improvement is strongly felt in all areas of life, there is a great production of technologically improved knowledge (Karaca & Karaca, 2021; Öznacar et al., 2020; United Nations (UN), 2021). Inevitably, the change experienced in a world where information production is so rapid also affects education. It is important to bring change to the dimension of development, and the institution that can achieve this is the school, especially one open to improvement. United Nations Educational, Scientific, and Cultural Organization (UNESCO, 2020) released nine ideas for public action enhancing the future of education, where all partners need to create social contract for the development of education. According to this report, schools become public spaces that try to acquire skills and fulfill their social responsibilities well within the transformation. Redesigning the future of education requires mending inequalities and creating collective futures. In this respect, a new social contract should be facilitated through the new design of schools (UNESCO, 2020).
Today, schools are expected to reinvent themselves to demonstrate sustainable improvement and be accountable to the school community (Çalmaşur, 2019; Lee & Louis, 2019; Pata et al., 2022). In other words, schools, which are at heart of education have to transform, adding value to society (UNESCO, 2020). Therefore, schools need to constantly improve themselves, due to which school improvement studies have become mandatory to meet expectations and produce suitable solutions (Parlar, 2012). Data-based approaches should be adopted to initiate and maintain the dynamic school change process leading to improvement (Shelton et al., 2018). Based on this basic paradigm, there is a need for evidence-based development practices in schools (Schildkamp, 2019) which this study attempts to meet by developing a “School Improvement Scale (SIS).”
The Need for the Study
School Improvement
School improvement refers to efforts to take the school from its current to an ideal situation, where the actors are administrators, teachers, students, and families. It is a common responsibility area that the entire school community undertakes together (Koç Akran, 2020). The main prospect of school improvement is to create a new understanding that cares about the spirit of the time and planned work of all stakeholders to improve the school with a common vision (Ministry of National Education [MoNE], 2018). This involves coining various definitions considering the contextual and temporal differences related to school development (Hopkins et al., 2014). School development, initially perceived as the individual development of the school, later focused on student learning (Hopkins & Reynolds, 2001). In fact, according to Hopkins (2001), school development is defined as “to increase student achievement by focusing on the teaching-learning process.” Therefore, the starting point of school improvement, which is a “cyclical process,” is to “make the school effective,” and improve the problem-solving skills of the school (Seashore Louis & Lee, 2016; Sparks, 2018).
School improvement, a multidimensional concept, consists of leadership, teacher professional improvement, curriculum, learning environment, vision-mission, resource management, school culture, school climate, parents, students, high standards and expectations (Hopkins, 2001). Its ultimate goal is to improve outcomes for students (Mustofa et al., 2021). Therefore, school improvement, which considers the school as a whole, focuses on students’ learning outcomes, prioritizing their expectations in cooperation with stakeholders in the school learning ecosystem (Creemers & Reezigt, 2005; Feldhoff & Radisch, 2021; Klein & Schwanenberg, 2022). To carry out the process effectively, one must take into account the co-improvement of variables related to school, creating a culture of continuous improvement (Yeigh et al., 2019). Schools having a weak culture are unlikely to be successful even if they focus on development (Harris, 2006).
Many factors affect effective school and leadership, teacher professional development and cooperation, qualified student outcomes, quality in education, accountability, coordination and planning, continuous development and sustainability, that come to the fore during school improvement studies (Andreoli et al., 2020; Fullan, 2005; Hopkins et al., 1994). Leadership is the most important of these (Newman, 2020). School principals wanting to embrace change, and carry it to the improvement dimension, should understand that “school improvement is not an act of adaptation” (Hallinger, 2014; Trombly, 2014) but a continuous improvement effort. Teacher professional improvement is another important factor. A school’s transformation into a learning organization and its improvement depends on teachers’ self-improvement and reinvention (Jacobs & Struyf, 2015; Senge, 2016). In addition, a positive school climate, student-centered learning environment, and the common mission and vision of the school community affects school improvement positively (Bellibaş & Gümüş, 2021; Lee & Louis, 2019; Prenger et al., 2021).
School improvement adopts a process-oriented approach (Feldhoff & Radisch, 2021), which starts with a school improvement plan, successively followed by planning, implementation, evaluation, correction and back to planning (Parlar, 2014). Schools wanting to reinvent and improve themselves, must consider their current conditions, and then prepare their internal processes for change, focusing on improvement. Improvement attempts not powered by “well-studied school improvement plans” are likely to fail.
One must first recognize the complexity of school systems for school improvement initiatives to be successful and sustainable and for the school to develop effectively (Williams & Koh, 2020). Schools, consisting of many sub-systems are also a part of the education system of the state (Keshavarz et al., 2010; Mason, 2008). School development necessitates the cooperation of all stakeholders since they meet various needs of society and are therefore, intensely interactive by nature ( Fidan & Balci, 2017; McEwan, 2015; Yalaza & Cinoğlu, 2019). When school development efforts are evaluated as a whole, we find that the approaches are intertwined, i.e., not completely independent from each other, and may vary from country to country, culture to culture, education system to education system; making it impossible to apply the concept of “one size fits all” (Parlar, 2014; Preiser et al., 2014). Therefore, under school improvement studies, which is a developmental process, schools should make use of multiple data sources and create their own effectiveness criteria based on their internal dynamics (Scherer & Nilsen, 2019; Trombly, 2014).
Different countries follow different practices regarding school development, consisting of comprehensive framework plans created to measure and direct the change and development efforts of schools, and determine areas such as leadership, professional development, school climate, curriculum, and learning-teaching environment. One can consider the “Standards and Indicators for School Improvement (SISI)” document included in the Kentucky education reform, and the National School Improvement Tool (NSIT) developed by the Australian Education Council, Chicago School Studies Consortium’s 5 Essentials Survey as examples of the standards-oriented studies (Australian Council for Educational Research [ACER], 2012; Davis et al., 2021; Mackey, 2016). One can use these studies as reference points in school improvement plans, providing a basis for the success of evidence-based school improvement efforts. However, apart from the framework created in obtaining the data, it does not provide any real practicality in practice. Likewise, the “Dutch School Improvement Questionnaire” developed by Thoonen (2012) in his doctoral study at the University of Amsterdam, the “School Improvement Questionnaire” developed by Webb and Pajares (1996), and the Questionnaire developed by Elmore et al. (2014) also do not provide sufficient convenience in practice.
Although the number of studies on school improvement has increased in recent years, institutional and individual studies developed to measure school development are still insufficient (ACER, 2012; Davis et al., 2021; Elmore et al., 2014; Feldhoff & Radisch, 2021; Keeling, 2015; Mackey, 2016; Mustofa et al., 2021; Pata et al., 2022; Prenger et al., 2021; Thoonen, 2012; VanGronigen et al., 2022; Webb & Pajares, 1996). In the country where we conducted the research, studies on school development are mostly handled within the framework of the school development model and are few in number (Bozbayındır & Alev, 2020; Dağlı & Silman, 2009; Koç Akran, 2020). Since 2017, the announcement of the 2023 education vision document in the Turkish education system, has put in place a system understanding, placing the school in the center (MoNE, 2018). Therefore, there is a need for an in- depth investigation of school development components and multiple data sources to be used in school improvement studies in the context of accountability and sustainability. In addition, besides the scales developed for effective school at the local level, we have found no other scale that could be used in process-oriented school improvement studies (Balcı, 2016) other than the “Scale of Determination of School Development Needs” (SCA) developed by Ubben et al. (2004) and adapted into Turkish by Dağ (2009).
Scales developed previously, to use in school improvement, as a result of institutional and individual studies provide a basis for determining the important components in the provision of school development (ACER, 2012; Davis et al., 2021; Elmore et al., 2014; Keeling, 2015; Mackey, 2016; Thoonen, 2012; Ubben et al., 2004; Webb & Pajares, 1996). However, if we consider the factors that make up the scales, it seems that different dimensions are used and the number of items is high. On one hand the applicability of a scale that includes all components that affect school development is difficult, and on the other, a scale with a large number of items may also have low usefulness (Çalık & Kurt, 2010). One requires valid and reliable data collection to use in process-oriented studies. However, the practices differ from country to country. Besides neither do institutional and individual school improvement studies provide sufficient practicality in data-based decision making, nor do they carry together the five main factors affecting the studies. Additionally, there is also no unique scale in the context of the country where we conducted the research. Therefore, the relevant tools are needed. In this research, we aim to develop a School Improvement Scale (SIS) to meet this need.
This research aims to develop a school improvement scale, to keep up with the developing world and prepare students accordingly. We hope that through this scale, especially prepared for teachers, it will be possible to determine the current development levels of schools according to teacher perceptions, and obtain the data needed in school development. The idea is that the School Improvement Scale (SIS), will contribute to the literature, helping schools aiming to improve, make data-based analyses, thereby, becoming a source for further research.
Method
Research Model and Working Group
We used a survey model, one of the quantitative research methods, to determine teachers’ perceptions of school development. This is a research model that describes a past or current situation as it exists (Büyüköztürk et al., 2019). We conducted due diligence to measure the perceptions of school development of primary, secondary and high school teachers, who are the subject of the research.
The research’s study group consisted of 1,043 primary, secondary and high school teachers who worked in Bursa during the academic year 2020 to 2021. We used the data of 138 primary, secondary and high school teachers for pre-application, 687 for Exploratory Factor Analysis (EFA), and 218 for Confirmatory Factor Analysis (CFA). Table 1 presents the distribution of teachers whose data was used in EFA and CFA, according to their gender, school types, professional seniority and education level.
Demographic Characteristics of the Teachers in the Study Group.

Examination of the study group’s characteristics demonstrate that we carried out the research with teachers having different characteristics. The participants consisted of both female and male teachers, with a balanced distribution (EFA and CFA: 54.6%; 45.4%). We included teachers from primary, secondary and high school in the study group, and there was balance in distribution in general (EFA: 41.9%; 32.2%; 25.9%, CFA: 31.7%, 39.9%, 28.4%). The seniority of the working group in the profession showed that approximately one-third of the teachers (EFA: 31.7%, CFA: 28.0%) had experience of over 21 years, and the other groups were between 9.3% and 26.6% in EFA and 11% and 22.9% in CFA. Majority of the participants (EFA: 88.9%, CFA: 88.1%) had a bachelor’s degree. 10.9% and 11.5% of the participants in EFA and CFA had a master’s degree, respectively. Only one teacher among the participants had a doctorate degree. Based on these features, we can say that we applied this developed scale, without any problems, in measuring the perceptions and thoughts of primary, secondary and high school teachers, despite having different demographic characteristics.
Scale Development Process
During the writing of the draft items of the SIS, which is the first stage of the scale development study, we considered research on school development and similar scales developed on the subject (ACER, 2012; Aydın, 2020; Balcı, 2014; Bellibaş & Gümüş, 2021; Feldhoff & Radisch, 2021; Fullan, 2005; Harris, 2006; Hopkins, 2001; Lee & Louis, 2019; Mackey, 2016; M. Aydın, 2018; Parlar, 2014; Şişman, 2018; Taymaz, 2019; Thoonen, 2012; Ubben et al., 2004; Webb & Pajares, 1996; Yeigh et al., 2019). The second stage consisted of a pool of 64 items being prepared by the researchers, which was reduced to 59, in consultation with five academicians who are experts in their fields, without narrowing the scope of the scale. We consulted two experts to test for linguistic intelligibility.
In the third stage, we conducted a pilot study with a group consisting of 138 people. The results made it clear that all items could be understood and were compatible with each other. Therefore, we decided to start the main application.
We carried out the first main application of the study with 687 participants, sending the scale form, consisting of 59 items, to teachers from different school types and branches. We used promax rotation method in the exploratory factor analysis made on the data obtained from the application. If the correlation level range of overlapping items in separate factors is less than .10, Büyüköztürk (2020) recommends that the item be removed from the analysis. Accordingly, based on the factor analysis, we excluded the items with factor loading values below .40 and those whose values were found to be negative, and overlapping items with values for more than one factor at the same time and with a correlation level range of less than .10, from the analysis. After analysis, we obtained a structure with 33 items and 5 factors.
We carried out the second main application of the research for confirmatory factor analysis. In the final procedure, we applied the scale form consisting of 33 items to a sample group of 218 people, different from the study group in the first application. As explained in the findings section, resultant of confirmatory factor analysis, we determined that the 33-item and 5-factor structure of the scale had a viable fit.
Data Collection and Analysis
Following the permission of the Near East University Scientific Research Ethics Committee, dated 08.04.2021 and project number 2021/643, we contacted the Bursa Provincial Directorate of National Education for the implementation of the research. We carried out the research in May and June 2021, and owing to the Covid-19 outbreak, we sent informed consent forms and questionnaires to the participants online. We included their responses only after their approval was obtained.
We carried out the first (EFA) and second (CFA) phase of the main application of the research in May and June 2021, respectively, through the online method, further carrying out the research in 125 schools in Bursa, including 44 primary, 49 secondary, and 32 high schools.
We performed exploratory and confirmatory factor analysis to determine the validity of the scale, and in order to determine its reliability, we examined the Cronbach’s Alpha value and the Pearson correlation coefficient, showing internal consistency, and the relationship between the factors, respectively. We used SPSS 25 in exploratory factor and reliability analysis, and LISREL 9.2 package programs in confirmatory factor analysis.
Rating System of the Scale
We gave the participants statements about school improvement, and asked them to indicate levels of agreement, using a 5-point Likert-type rating scale. For example, “I reflect the knowledge and skills I have gained through professional improvement to teaching activities.” In response to the statement, “I do not agree at all.” (1), “I rarely agree.” (2), “I partially agree.” (3), “Mostly agree.” (4), “I totally agree.” (5) options were presented. No reverse coded item was included in the scale. As a result of this calculation, the lowest and highest score that could be obtained from the scale was 33 and 165, respectively. Thirty-three points indicate that the participant’s perception of school improvement is completely negative; whereas a score of 165 indicates a completely positive perception.
Results
In this section, we present the technical details of the validity and reliability analysis of the scale and the findings.
Validity Analysis
We measured the data’s suitability for factor analysis by the Bartlett test of sphericity and the Kaiser-Meyer-Olkin (KMO) sample adequacy test. A KMO value of .80 and above is “perfect”; between .70–.80, .60–.70, and .50–.60 is “good,” “medium” and “bad,” respectively, and below .50 is considered “unacceptable” (Yurtkoru et al., 2018). According to the analysis, the KMO value was .97. Also, the result of the Barlett test, showed that the χ2 value was significant [χ2 = 21,997.51; p = .000]. These values reveal that the sample size is sufficient and the scale is at an excellent level, respectively, for factor analysis. Table 2 presents the total variance explained by the scale.
Announced Total Variance Table.

In the first analysis, we excluded 26 items with low factor loads, which were negatively distributed, and in which the range of correlation levels displayed in different factors. As seen in the “Total Variance” column in Table 2, we determined that the number of factors with an eigenvalue above 1 was 5, and they explained 69% of the scale’s total variance.
Table 3 presents the results of the “Pattern Matrix,” resulting from the factor analysis applied after the aforementioned items were removed. The result shows that the scale is valid with 5 factors.
Components Matrix (Pattern Matrix).

Extraction Method: Maximum Likelihood.
Rotation Method: Promax with Kaiser Normalization.
The factors as a result of the applied factor analysis and factor load values, and their determined names are as follows:
Factor 1: Effective leadership: 8 items. Load values vary between .60 and .98.
Factor 2: School Climate: 6 items. Load values vary between .54 and .94.
Factor 3: Teacher Professional Improvement: 7 items. Load values vary between .51 and .78.
Factor 4: Learning Environment: 5 items. Load values vary between .61 and .92.
Factor 5: Vision and Mission: 7 items. Load values vary between .61 and .77.
As the factor loading values are between .51 and .98, we can interpret that the scale consists of items having a high level of correlation between them and can provide construct validity. This is consistent with a study that states that as the factor load values are above 0.45, the scale consists of items with a high level of correlation between them and can ensure construct validity (Büyüköztürk, 2020).
Figure 1 presents the path diagram formed in the confirmatory factor analysis based on the data obtained as a result of the second main application of the study.

Confirmatory factor analysis pathway chart.
Figure 1 depicts that the value of χ2 is 2.33 (1,134.88/485) and RMSEA is .079. which determines that the values of χ2 and RMSEA, which were the first values that we examined in the confirmatory factor analysis, and which agree. Because the χ2 value is between 2 and 3 and the RMSEA value is between .05 and .08, they are considered as being in harmony (Çokluk et al., 2018).
Figure 2 presents the significance levels of the latent variables explaining the observed variables in confirmatory factor analysis.

Confirmatory factor analysis T values.
Figure 2 depicts that all values are significant at the .01 level and there is no item that requires exclusion from the analysis. Because, if the t values exceed 2.56, we accept that the level of significance is .01 and the items are compatible (Çokluk et al., 2018).
Table 4 presents other fit indices obtained as a result of the confirmatory factor analysis.
Confirmatory Factor Analysis Fit Index Results.
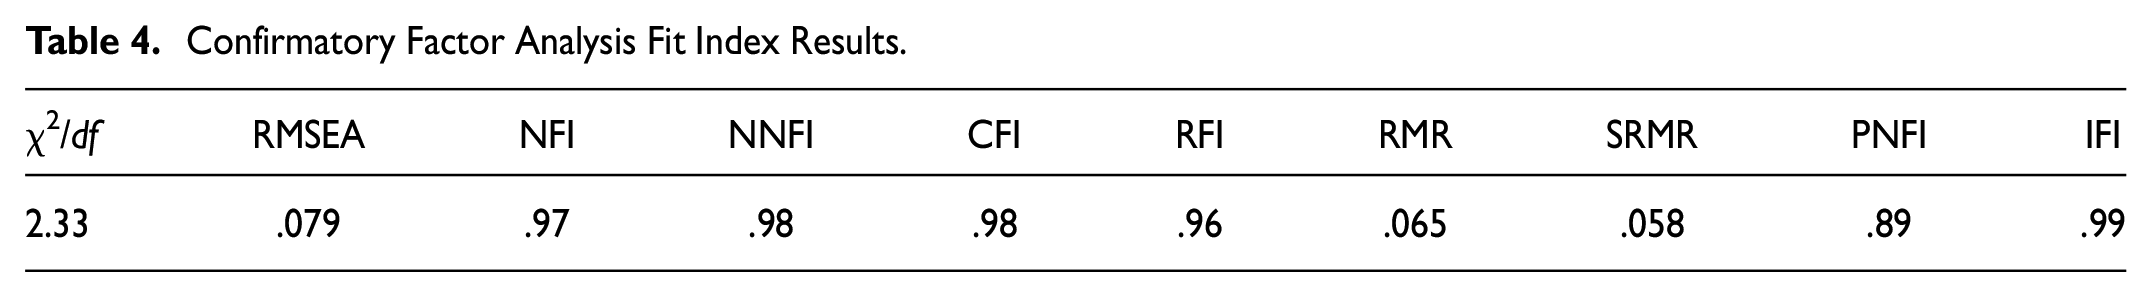
We subjected this 5-factor and 33-item structure, formed as a result of the final research analysis, applied on 218 people within the scope of the second main application of the study, to confirmatory factor analysis. As seen in Table 4, χ2 = 1,134.88, Degrees of Freedom-df = 485, Significance value-p: .00, (χ2/df = 2.33), Root Mean Square of Approximate Errors (Error of Approximation)-RMSEA = 0.079, Normed Fit Index-NFI = 97, Non-Normed Fit Index-NNFI = 98, Comparative Fit Index-CFI = 98, Relative Fit Index-RFI = 96, Root Mean Square Residual-RMR = 065, Standardized Root Mean Residual-SRMR = 0.058, Parsimony Norm Fit Index -PNFI = 0.89, Incremental Fit Index-IFI = 99. These values show that the 5-factor, 33-item structure formed in the exploratory factor analysis is well compatible (Çokluk et al., 2018). We finally subjected the 5-factor and 33-item scale, found to be in agreement as a result of EFA and CFA analysis, to reliability analysis. We found the Cronbach’s Alpha coefficient, which reveals the homogeneity feature of the structure of the scale i.e., its internal consistency to be .97, for the whole scale. Table 5 presents the reliability coefficients and item-total correlations of the 5 sub-dimensions of the scale.
Reliability Analysis of Factors.

Table 5 exhibits that the item-total correlations of .60 to .92 in the item analysis applied to reveal their consistency with the total score and with each other, shows that the items in the scale are distinctive. This is consistent with the findings of a previous study that states that items with an item-total correlation above .30 are an indicator of internal consistency (Büyüköztürk, 2020).
In Table 5, Cronbach’s Alpha reliability coefficients were .97, .94, .88, .92, and .94 for the factors of effective leadership, school climate, teacher professional improvement, learning environment, and vision-mission, respectively, demonstrating that there is a high level of internal consistency among the items that make up the scale and that they have a strong relationship among them. When the reliability coefficient of a test to be applied in the field of social sciences is .70 or higher, one considers it sufficient for the reliability of the test scores (Yurtkoru et al., 2018). In this context, one can say that the developed scale is reliable, both for the whole and its five dimensions.
Correlation Analysis
Table 6 presents the results of the correlation analysis applied to determine the direction and level of the relationship between the 5 factors of the scale.
Correlation Analysis Between Factors.

Correlation is significant at the .01 level (two-tailed).
p < .01.
The correlation results given in Table 6 demonstrate that there is a moderate/high level, positive and significant relationship among all the factors in the scale. According to previous studies, the correlation coefficient between .70 and 1.00 as an absolute value is high, whereas a correlation between .70 and .30, and .30 and .00 is interpreted as a medium and low-level relationship (Büyüköztürk, 2020), respectively. With detailed consideration of the direction and level of the relationship among the factors that make up the scale, we can interpret the following: There is a strong/moderate positive correlation between vision and mission, effective leadership, and school climate, and other factors (r = 81, r = 62, r = 72, r = 68; p < .01), (r = 81, r = 55, r = 70, r = 60; p < .01), and (r = 72, r = 70, r = 53, r = 69; p < .01), respectively. There is a moderate positive correlation between professional improvement, and learning environment, and other factors (r = 62, r = 55, r = 53, r = 56; p < .01) and (r = 68, r = 60, r = 56, r = 69; p < .01), respectively.
Discussion and Conclusion
This research aims to develop a school improvement scale to determine the current improvement levels of schools and obtain the data needed for their improvement.
The rapid change experienced on a global scale with the COVID-19 pandemic makes it more important than ever to analyze the current situation and needs, specific to schools. Especially in context of quality and sustainability in education, school improvement demands presented by general education reports reveal the fact that educational institutions need to be reshaped (UNESCO, 2020; United Nations, 2021; Yerel et al., 2021). Therefore, one can say that the criteria of obtaining high-quality data to be used in sustainable school improvement studies are of critical importance to overcome the challenges of time and provide quality education for a better future.
When one evaluates school improvement studies as a whole, one finds that all approaches are intertwined and not independent from each other (Parlar, 2014). Thus, schools should continue school improvement studies, considered as an improvement process, using multiple data sources by creating their own school effectiveness criteria based on their internal dynamics(Scherer & Nilsen, 2019; Trombly, 2014). With this vision put forth by the Ministry, one expects schools to first analyze their current situation and determine their improvement needs, making evidence-based decisions while doing this (Schildkamp, 2019). Schools require appropriate measurement tools to produce data-based decisions in our education system. We assume that the scale developed during this study will facilitate data-based decisions.
When one evaluates school improvement efforts together, it creates a complex structure, differing from country to country, culture to culture, and education system to education system (Parlar, 2014; Preiser et al., 2014). Therefore, one must carry out school improvement studies, considered as a dynamic process, based on data, because today data-based decision-making is considered as the driving force of school development in making school organization effective (Coldwell et al., 2017). In this study, we determined 5 basic factors by focusing on the variables revealed during previous studies. These factors are effective leadership, school climate, teacher professional development, learning environment, vision, and mission (Lee & Louis, 2019; Newman, 2020; Prenger et al., 2021). The minimum and maximum score obtainable from the developed scale is 33, and 165, respectively. Thirty-three points indicate that the participants’ perception of school improvement is completely negative, whereas 165 indicates a completely positive perception. Institutions applying the scale will be able to analyze the current situation in terms of school development areas and determine the its needs as a whole, according to the determined score range. We assume that this scale, which is considered to be able to guide institutions in school improvement studies, will also help educational institutions develop their own school effectiveness criteria.
This research, which aims to obtain the current development levels of schools and the data needed for their development, according to teacher perceptions, is based on previous literature (Feldhoff & Radisch, 2021; Fullan, 2005; Harris, 2006). We have also used similar scales developed in the past for use in school improvement studies (Mackey, 2016; Thoonen, 2012; Webb & Pajares, 1996). As a result of the analysis, we found that the factor evaluation of effective leadership, school climate, teacher professional development, learning environment, vision, and mission in school improvement studies overlap with the literature (Davis et al., 2021; Elmore et al., 2014; Webb & Pajares, 1996). The difference between this scale compared to others is that it is original in the context of the country from where we collected the research data, the number of items is low, and it can measure five factors on a single scale. Besides this, not only does it provide ease of use, but can also be applied to different education levels such as primary, secondary, and high school.
Previous studies show that many factors affect school improvement, of which leadership is the most important (Newman, 2020). Other important factors are teacher professional improvement and the school’s transformation into a learning organization (Jacobs & Struyf, 2015; Senge, 2016). In addition, we determined that a positive school climate, student-centered learning environment, and the shared mission and vision of the school community positively affect school improvement (Lee & Louis, 2019; Prenger et al., 2021). In this study, we combined these factors which were revealed in different studies, in a single scale.
The psychometric properties of the scale are as follows:
In order to subject the scale to validity analysis, we checked the value of the KMO test before the data was analyzed, and it was .97. Based on the result of the Barlett test, we found the χ2 value to be significant [χ2 = 21,997.51; p = .000], which revealed that the sample size is sufficiently large and the scale is at an excellent level for factor analysis. Thereupon, we performed the exploratory factor analysis (EFA), determining that the scale had a 5-factor structure consisting of 33 items and explained 69% of the total variance. The analysis made with the promax vertical rotation method, shows that the factor load values vary between .51 and .98, therefore, the scale consists of items having a high level of correlation between them and can ensure construct validity. We named the first, second, third, fourth and fifth factors in the scale with 8, 6, 7, 5, and 7 items as “Effective Leadership,” “School Climate,” “Teacher Professional İmprovement,” “Learning Environment” “Vision and Mission,” respectively.
In the confirmatory factor analysis (CFA) phase applied to determine the factor structure’s compatibility, we observed that χ2 = 2.33 and RMSEA = .079. Accordingly, we determined that the χ2 and RMSEA values were in agreement. Other fit indices were NFI = 0.97, NNFI = .98, CFI = .98, RFI = .96, RMR = .065, SRMR = .058, PNFI = .89 and IFI = .99. These values indicate that the structure formed in the exploratory factor analysis shows a good level of compliance. The results of exploratory and confirmatory factor analysis reveal that the scale is a valid measurement tool.
We then applied the reliability analysis for the 33-item scale, which we found had a good fit as a result of the EFA and CFA analysis. We found that the Cronbach’s Alpha coefficient, which reveals whether the structure of the scale has a homogeneous feature, that is, the internal consistency of the scale, was .97 for the whole scale. The Cronbach’s Alpha reliability coefficients of the factors emerged as .97, .94, .88, .92, and .94, respectively, showing that there is a high level of internal consistency among the items that make up the scale and that are strongly related to each other. In the item analysis, applied to reveal the consistency of the items in the scale with the total score and with each other, the item-total correlations between .60 and .92 indicate the internal consistency, thus, revealing that the scale is a reliable measurement tool.
Therefore, we can conclude that the “School İmprovement Scale (SİS)” is a valid and reliable measurement tool consisting of 33 items and 5 dimensions that can be used to determine the current development levels of schools, according to the perceptions of teachers working in primary, secondary and high schools and obtain the data needed for school development. One can repeat validity and reliability test on different groups for the scale. Besides this, one can develop more comprehensive “School İmprovement Scales,” including student-parent behaviors and that of other stakeholders of the school community.
Footnotes
Declaration of Conflicting Interests
The author(s) declared no potential conflicts of interest with respect to the research, authorship, and/or publication of this article.
Funding
The author(s) received no financial support for the research, authorship, and/or publication of this article.
Ethics Statement
All rules within the scope of “Higher Education Institutions Scientific Research and Publication Ethics Directive” were followed in this study.