
Abstract
Previous studies substantiate built environment influences street vitality. However, most of them focus on whether the built environmental elements have an influence on the street vitality, and ignore the spatiotemporal heterogeneity of the influences at the district scale. Using multisource big data, we comprehensively measure the street vitalities of different periods and the built environment in different dimensions on Xiamen Island. Geographically and temporally weighted regression (GTWR) models are constructed to systematically analyze the spatiotemporal heterogeneity of the influences of the built environment on the street vitality. Results show that the influence of function remains constant over time. Transit has the strongest effect on the improvement of street vitality during peak hours. The impact of design is strongest in the evening. The effect of accessibility gradually strengthened over time, reaching the highest in the evening. In terms of the spatial dimension, the heterogeneity brought about by the new and old urban areas is significant. The spatial heterogeneity of design’s influences is prominently brought about by large green lands and landscape streets. Density, bus station and spatial scale have strong temporal and spatial stability. Length is the most unstable during the weekdays. In order to maintain street vitality and form sustainable traffic, differentiated strategies of vitality enhancement should be formulated according to the locations and attributes of the streets.
Keywords
Introduction
Street vitality is an important symbol of sustainable transportation (Tao et al., 2020). Auto dependence in the past decades results in many urban problems, such as the squeeze of street space, the loss of the street life and the decline of public health. which lead to environmental issues (Brownson et al., 2009). To solve the above problems, many countries and cities have compiled guidelines for street design to enhance the vitality. Street vitality is produced by the frequency, duration and diversity of the activities in various street places (Jacobs, 1961; Lynch, 1984). The density and diversity of street functions brings about a variety of street activities, which leads to street vitality (Gehl, 1989; Montgomery, 1995, 1998). Scholars have conducted empirical research to analyze the relationship between street vitality and built environments, such as functional mix, the intensity of development, street facilities, spatial scale (including sidewalk scale, street width, street interface height, etc.), commercial services, etc. (Delclòs-Alió et al., 2019; Delclòs-Alió & Miralles-Guasch, 2018; Lunecke & Mora, 2017; Mehta, 2007; Sung et al., 2013, 2015; W. S. Wu et al., 2021; H. Yue & Zhu, 2020)
However, previous studies only focus on a few streets, and seldom conducts research from the district scale (Delclòs-Alió et al., 2019; Mehta, 2007). On different geographic scales, the dominant environmental elements that affect street vitalities are different, and the same environmental element plays different roles on different geographic scales (W. S. Wu et al., 2021). For example, whether the street form has an influence on residents’ activities on the block scale or a larger district scale has not yet been concluded (Crane, 2000). Some studies have compared the built environment and the activities on different scales, and found that the influential factors of the macro, meso, and micro scales should be different (Delclòs-Alió et al., 2019; Zeng et al., 2018). For instance, on the micro street scale, over-mixed street functions, and excessive population density will reduce pedestrian activities (Cheng et al., 2020), while density plays the most important role on the macro district scale (Q. Li et al., 2022). Limited by the high cost of field surveys and GPS tracking data, most of the related studies are conducted on street scales (Delclòs-Alió & Miralles-Guasch, 2018; Lunecke & Mora, 2017; Mehta, 2007). Whether existing arguments are still valid at the district scale remains to be determined.
Previous studies pay more attention to whether the built environmental elements have a significant influence on the street vitality, and less accurately assess the effects from the spatiotemporal perspective (Q. Li et al., 2022). Due to the existence of the “proximity effect,” spatial elements tend to produce spatial heterogeneity (Anselin, 1988), and spatial heterogeneity will change over time (Huang et al., 2010). In some studies, no significant relationship was found between some specific build environment features and street vitality (Fan et al., 2021; W. S. Wu et al., 2021; A. Q. Zhang et al., 2020). The mixed findings across the empirical studies could be due to the spatial non-stationarity or heterogeneity, which means the same environment features may lead to different responses and outcomes over space or changes within spatial context (Dormann et al., 2007; Fotheringham et al., 2004). For instance, the influence characteristics of the old and the new urban areas are quite different (Zeng et al., 2018). Further, the influences of environmental elements on the street vitality will also change over time. The features of street activities are more related with commuting behaviors (Crane, 2000). Traffic stations bring a large number of visitors to the street in the rush hours, and street squares can attract people to stay during the leisure time (W. S. Wu et al., 2021). Thus, accurately assessing the spatiotemporal heterogeneity helps clarify the most effective factors to stimulate the street vitality under different environmental conditions and during different periods.
On the basis of the study of spatiotemporal heterogeneity, the applicability of environmental factors can be distinguished by comparing the spatiotemporal stability of their influences on street vitality, so as to form targeted optimization strategies for streets with different attributes and built at different times. In the case of limited resources, the best street improvement effect can be achieved with the minimum investment budget. Therefore, this study attempts to answer the following question: (1) What are the time-varying characteristics of the influence of built environment on street vitality? (2) What are the heterogeneity characteristics of the impact of different street environments on vitality? (3) Among the environmental indicators, which has the strongest spatiotemporal stability?
To solve the problems, street vitalities in different periods and different locations should be measured first. Location-based service (LBS) big data provides a basis for the measurement. Besides the unique advantages of big data, such as wide space-time coverage, massive samples, and random sampling, LBS data also has the characteristics of accurate positioning based on GPS (with a minimum error of 10 m), making it especially suitable for street research. Starting from the individuals, LBS data can be used to continuously perceive the behavior preferences of street users (W. S. Wu et al., 2021). Furthermore, street view images can depict the microscopic characteristics of street space design on a district scale, including the walking space, the architectural interface, the street greening and the outdoor squares, which is difficult to realize with manual surveys.
Based on multisource big data, including LBS data, street view images, buildings vector data, points of interest (POIs), as well as other data, the street vitality and the built environment on Xiamen Island during weekdays and weekends are quantitatively analyzed. Geographically and temporally weighted regression (GTWR) models are constructed to systematically analyze the spatiotemporal heterogeneity and stationarity of the influences of the built environment on the street vitality.
The rest of the paper proceeds as follows. Section 2 describes the literature review. Section 3 introduce the study area, data, and methods. The spatiotemporal heterogeneity and stationarity are explored in Section 4. Conclusions are drawn in section 5 and the concluding remarks are offered.
Literature Review
Connotation and Measurement of Street Vitality
Based on the observation of American large cities, Jacobs (1961) assumes that vitality comes from the constant flow of people, no matter what their purpose is. Street usage time is as important as street users. Vitality refers to activities in different periods of time, which should be calculated by hour. The absolute number of people using streets and how these people are distributed at different times are different things. Gehl (1989), Montgomery (1995), Mehta (2007), and other scholars have conducted further discussions (Delclòs-Alió et al., 2019; Sung et al., 2013, 2015; W. S. Wu et al., 2021). They held that street vitality refers to the social activities on the street and the duration of these activities at various times. Traditional theories are mostly based on field investigations and observations at the street scale, which is difficult to clearly describe the quantitative features of street vitality. The time-varying characteristic is very important but lacks (Delclòs-Alió & Miralles-Guasch, 2018; Xu et al., 2018).
In recent years, with the popularization of mobile network and the development of communication technology, the data environment becomes more mature and abundant. Scholars have carried out a series of empirical studies to explore street vitality quantitatively (Cheng et al., 2020; Q. Li et al., 2022; H. Yue & Zhu, 2020). Street vitality refers to the social activities in the streets (Jia et al., 2021; J. Y. Wu et al., 2018). Mobile positioning big data, including LBS data, represents both online social activities and offline social communication activities (Lunecke & Mora, 2017; J. Y. Wu et al., 2018, 2021; Y. Yue et al., 2017; H. Yue & Zhu, 2020). In China, most shopping uses mobile payment, as a result, shopping behavior, as an important part of street activities, can also be referred to by mobile positioning big data. LBS data is an effective tool to measure street vitality (Wu, Ma, et al., 2022).
Relationship Between Built Environment and Street Vitality
The analysis of the relationship between built environment and street vitality has developed from qualitative to quantitative. Cervero et al. (2009) propose 5D concept of “Density, Diversity, Design, Destination accessibility and Distance to transit” to measure the built environment systematically. Density is the compactness of the built environments. Compact districts and neighborhoods tend to have better quality public services, wider mixes of land uses, less parking, and larger shares of low-income households, which increased residents’ walking willingness and the vitality. Diversity means that the neighborhoods are mixed in their land-use composition, which can produce convenience and more walking. Design can not only make destinations more accessible and conveniently reached by foot, but can also reward pedestrians with amenities (like shade trees and civic squares). Distance to transit can stimulate more activities and induce walking as a form of access and egress. Destination accessibility expresses the degree of accessibility to street activities. There is a fair amount of intercorrelation among the variables of the 5Ds, and the 5D framework is often used to assess the built environment and street quality (Sung et al., 2013, 2015; W. S. Wu et al., 2021).
Most studies focus on one or several streets (W. S. Wu et al., 2018, 2021). Land use pattern, pedestrian-oriented design and spatial accessibility (accessibility of all facilities, accessibility of retail facilities, and accessibility of service facilities) significantly affect the street vitality (Cao et al., 2009; Ding et al., 2017; Cervero et al., 2009; Duncan et al., 2010; Giles-Corti et al., 2013; Marquet & Miralles-Guasch, 2015; Oliver et al., 2015; M. Zhang, 2005). In addition, traffic factors, such as the features of road systems and transit-oriented development (TOD), will significantly affect the street vitality (Cao et al., 2009; Curtis et al., 2015; Ewing & Cervero, 2010; Oliver et al., 2015; Pan et al., 2009; Schwanen & Mokhtarian, 2005).
With the advancement of location aware device and location-based service, some studies have investigated the features of vitalities at the district scale (Ratti et al., 2006; W. S. Wu & Niu, 2019). Researchers conducted empirical research in South Korea, Spain, and Shanghai (Delclòs-Alió et al., 2019; Sung et al., 2013, 2015; W. S. Wu et al., 2021; W. S. Wu & Niu, 2019). The results indicate that at the district scale, the built environment has significant influence on the street vitality, but not all indicators will play a role. For instance, land use mix has no significant impact in the verification results of the above-mentioned cases. At the same time, some microscopic elements are ignored, such as the building height (Lu et al., 2019). Thus, further exploration is needed.
Spatiotemporal Heterogeneity
Traditional global regression models, such as ordinary least squares (OLS) models, spatial lag models, and structural equation models, are widely used as effective tools to explain the influence mechanism of the street vitality (Jia et al., 2021; Tu et al., 2020; J. Y. Wu et al., 2018; A. Q. Zhang et al., 2020). They can only reflect the average level of the spatial relationships, and cannot fully describe the spatial non-stationary phenomenon (Fotheringham & Brunsdon, 1999; Fotheringham et al., 1998). Street activities are very sensitive to the spatial locations, and there is spatial non-stationarity as well as spatial dependence between adjacent streets. Previous studies rarely explore the spatial heterogeneity of the street vitality and its influencing factors.
Noticing the limitations of the mean regression model, some studies introduced the geographically weighted regression (GWR) model to solve the problem of spatial non-stationarity (Fan et al., 2021; Fu et al., 2021; S. J. Li et al., 2020; Liu et al., 2020; A. Q. Zhang et al., 2020). However, the behaviors in the streets will also change over time. As an extended model of GWR model, the temporal and spatial geographically weighted regression (GTWR) model couples time and space factors (Sholihin et al., 2017). Considering spatial heterogeneity and time non-stationarity, the GTWR model can perform parameter estimation more effectively, thus has great applicability in exploring the temporal and spatial heterogeneity of the influencing effects of the environmental elements (S. J. Li et al., 2020; Tang et al., 2018; X. C. Zhang et al., 2021).
Data and Method
Study Area
Xiamen is China’s special economic zone approved by the State Council, as well as an important central city and scenic tourist city on the southeast coast (W. Zhang, 2016). The city has experienced many years of evolutions, and the streets here are rich in types and shapes (Fang et al., 2020). Xiamen Island is the birthplace of Xiamen (Wen et al., 2022). As the central urban area of Xiamen, Xiamen Island covers an area of approximately 132.2 km2 and includes two administrative districts (Figure 1). Xiamen Island has developed transportation and convenient public services. The street network and texture are diverse, including historical streets, residential streets, and new streets, which makes it appropriate for in-depth exploration of the relationship between built environment and street vitality (Wu, Ma, et al., 2022).

Study area.
Data
LBS Data
Mobile internet location services actively initiate or passively generate LBS data, recording accurate locations (up to 10 m) and corresponding timestamps. The high accuracy is especially suitable for street research. The LBS data in this study are the anonymous Aurora geographic big data. Aurora Mobile provides an SDK positioning development environment for approximately 1.452,000 Apps. It has strong universality and wide coverage. The SDK platform can screen out the data only for mobile terminal users. The data acquisition mechanism includes periodic location updates and event triggers. The data collection time was 2 weeks from October 17th to 30th, 2020, including 10 workdays and 4 weekends, with no holidays. During this period, the COVID-19 epidemic in Xiamen weakened. The local cases of Covid-19 infection in Xiamen were all zero, and there are no more than three cases of imported infection from overseas every day (https://wjw.fujian.gov.cn/ztzl/gzbufk/yqtb/202010/t20201018_5417823.htm). In fact, in 2020, until the end of the year, the epidemic has been relatively stable, with no outbreak. The temperature was between 19.8 and 26.9 degrees Celsius, and there is no rainy day. As a result, it was suitable for residents to move freely and travel daily in the city.
The original data are processed as follows: (a) All of the LBS records appearing in Xiamen during the data collection period is selected. A total of 6.021 million users have been identified, and 130,817,778 records are obtained. After data verification, it is found that the daily data volume is relatively stable; (b) Users’ locations on each time point from 8:00 to 22:00 are calculated. The location information of each user is pushed forward by 1 hr, and the record closest to the hour point is taken as the location of the user. On weekdays, up to 329,800 users are identified, and at the weekends up to 309,200 users are identified. As a reference, there are approximately 2.1 million permanent residents on Xiamen Island; (c) The users positioned in street space are selected. The multi-day averages of workdays and weekends are summarized respectively.
Street View Image
The street view images are crawled from Baidu Maps open platform, the street view images of which have a large coverage and can be updated quickly. Based on the center line of the streets, the capture points are generated every 40 m. If the street segment is less than 40 m, the midpoint is taken as the capture point. A total of 21,486 panoramic photos were crawled in June 2021, the size of which is 4,096 × 1,380 pixels. In order to eliminate the influence of the collecting vehicle in the photo, the bottom one-third of each image is uniformly cut off. Based on Cityscapes Dataset, the elements in the street view images are identified by the Deeplap-V3+ semantic segmentation tool. The results contain 19 subcategories, covering sky, plants, buildings, people, roads, cars, etc. (Figure 2).

Collection and recognition of street view images.
Street Network
The street network is crawled from the Open Street Map. After data preprocessing and topology checking, 2,768 streets are obtained on Xiamen Island. Referring to the Xiamen Urban Rail Transit Construction Plan (2011-2020), the streets are divided into four levels: branch road, secondary trunk road, arterial road, and expressway.
POI
The POIs are obtained from AutoNavi Open Platform in the year of 2020. There are 169,164 records in the original data of Xiamen Island, categorized into 21 major categories and 236 medium categories. Based on the functions closely related to street vitality, POIs are reclassified into eight categories: business (66.37%), corporate (14.21%), transportation (5.23%), education (4.65%), residential (2.86%), government agencies and social groups (1.87%), green space (0.33%), and others (4.47%).
Rail Station
There are two kinds of rail transit stations in Xiamen: metro stations and Bus Rapid Transit (BRT) stations. Based on Baidu Maps, 53 stations are obtained, including 33 metro stations and 20 BRT stations.
Building Vector
The building vector data are crawled from the Baidu Map open platform in 2021, including the vector boundaries of buildings and the floor numbers. Based on street view images and the QGIS online map, the location and floor numbers of buildings are checked and adjusted. After preprocessing, there are 49,558 pieces of data of Xiamen Island.
Variables
Spatial Unit
Street space is enclosed by physical elements on both sides of the street, such as buildings, trees, etc. (Jacobs, 1961; Mehta, 2007) As most of the streets are roadways, intersections will cut off spatial continuity to a certain extent. The spatial experience between two intersections is relatively complete. In terms of spatial experience, there is a complete space between two intersections, and the functions and activities on the same street segment are relatively unified. As a result, intersections are used to divide space units.
First, the centerline is offset to both sides, thus obtaining a two-lane street. According to the street level from high to low, the offset distance is 6, 40, 20 and 16 m respectively; Second, the two-lane streets are calibrated according to the Google online satellite images; Third, the spatial units divided by intersections are generated by the transformation tool of ArcGIS (Figure 3). Finally, a total of 2,768 spatial units are obtained.

Delineation of street space and division of spatial units.
Variable Calculation
The Explained Variables
The explained variables are the street vitalities on weekdays and weekends. Street vitality refers to the social activities that are in a stationary or slow-moving state in the street, and street vitality is the product of the quantity, type and duration of various social activities (Gehl, 1989; Jacobs, 1961; Mehta, 2007; Montgomery, 1995; Wu, Guo, et al., 2022; Xu et al., 2018). Mobile phone is an important communication tool for outdoor people, and LBS data can be regarded as a record of people’ social communication activities. These activities contain both online social activities and offline social communication activities (mobile payment, etc.). Activities located by LBS data on the street can be regarded as static or walking slowly, as people seldom operate mobile app when walking briskly in outdoor space. Thus, LBS data can effectively refer to social activities in slow-moving or stationary state in street space, and then refer to street vitality. Therefore, this study uses LBS data recorded in Xiamen during the day (8:00–22:00), to measure street activity. Further, to clarify the time features, time series are used to achieve a more detailed measurement (Table 1).
Index System and Statistical Description.
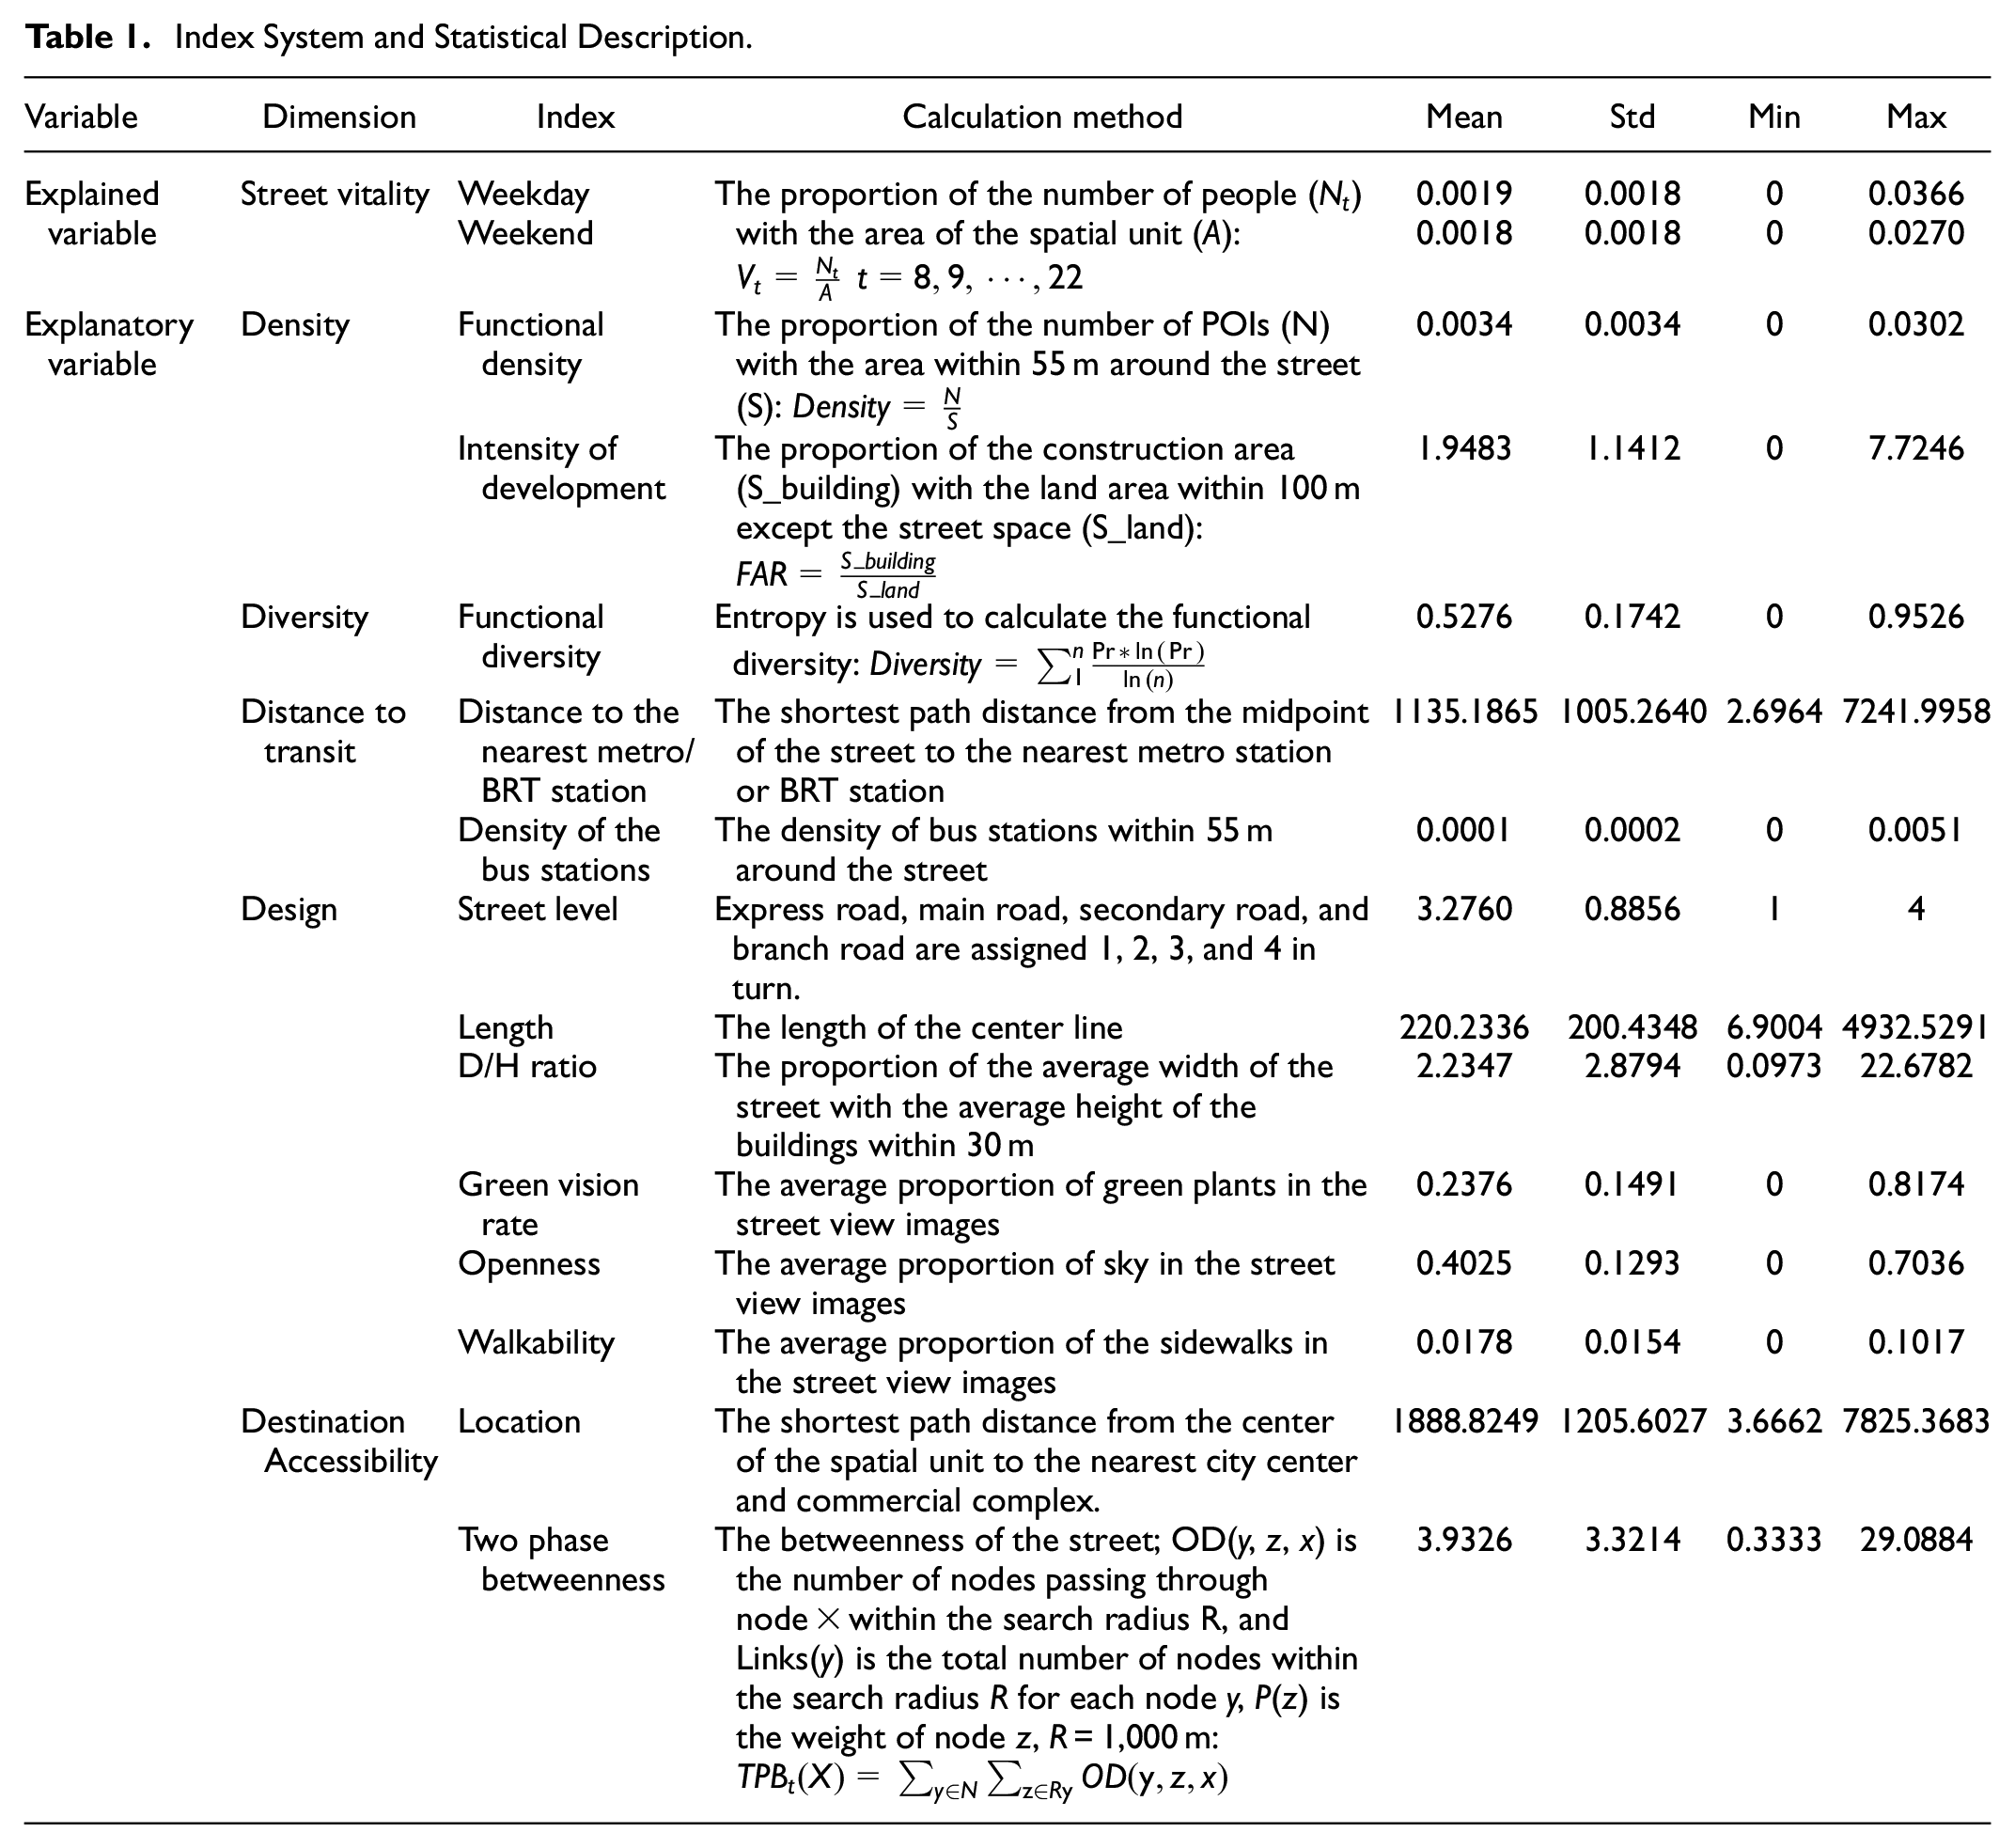
The Explanatory Variables
The explanatory variables are the built environments. They are the spatial manifestation of street design and important carriers of street activities. To better measure the “quality” of the built environment that was difficult to accurately define in the past, the 5Ds is often used quantify the built environment and to study its influence on behaviors (Crane, 2000; W. S. Wu et al., 2021; L. Z. Zhang et al., 2019). In this study, we extract from the 5Ds the key variables which are oriented by urban design and closely related to street vitality (Table 1).
Although private mobility accounts for a significant percentage of total mobility, this study did not take it as the influencing factor of street vitality. Street is an important public space. This study focuses on the activities in public space and the public interests behind it. Private parking serves some people who own private cars, not all people in the city, but all people in the city are served by public transportation. Previous studies focus more on the influence of public transportation on street vitality (W. S. Wu et al., 2021; Xiao et al., 2021), and the impact of parking facilities on street vitality has not been proved (Farrukh et al., 2018). Thus, the influence of public transportation is considered in the Distance to Transit variable.
Model Construction
As the same explanatory variable has inconsistent regression coefficients at different spatial locations and time points, geographically and temporally weighted regression (GTWR) model is an efficacious method to solve the spatiotemporal non-stationarity (Huang et al., 2010; Sholihin et al., 2017). Taking the street vitalities at each time point of weekdays and weekends as the explained variables, and the built environment indicators as the explanatory variables, the GTWR models are constructed. In order to eliminate the influence of data dimensions on the fitting results, all variable data are standardized. The model is constructed as follows:

Where i refers to the spatiotemporal position of the sample point; βk(ui+vi+ti) (k = 1,2,…,13) is the fitting coefficient of the k-th explanatory variable at the sample point (ui,vi,ti) estimated by the model; εit is the random error term.
Before the regression analysis, the GTWR models should be tested for collinearity, spatial autocorrelation and spatial heterogeneity to ensure the applicability and accuracy.
Collinearity Diagnosis
All the variance inflation factors (VIF) of explanatory variables are <10. There is no case where two or more condition indexes are >30 at the same time, and there is no situation where the variance contribution of two or more variables is >50% in the same row. There is no multicollinearity in the models.
Spatial Autocorrelation Test
Spatial autocorrelation analysis is conducted to determine whether it is necessary to introduce a complex model based on spatial locations. As shown in Supplemental Appendix A, the explained variables all have significant characteristics of spatial autocorrelation, and spatial econometrics should be introduced for precise analysis.
Spatial Heterogeneity Test
Breusch-Pagan method was used to test whether there is heterogeneous in space, and to determine whether a global or local spatial statistical analysis method should be introduced. It can be seen from the results in Appendix B that the Breusch-Pagan values all have strong significance, indicating that there is strong spatial heterogeneity in street vitality. Local spatial statistical analysis should be employed for estimation. Therefore, the GTWR model is finally chosen to explore the relationship between the street vitality and the built environment.
Results
Parameter Fitting Results
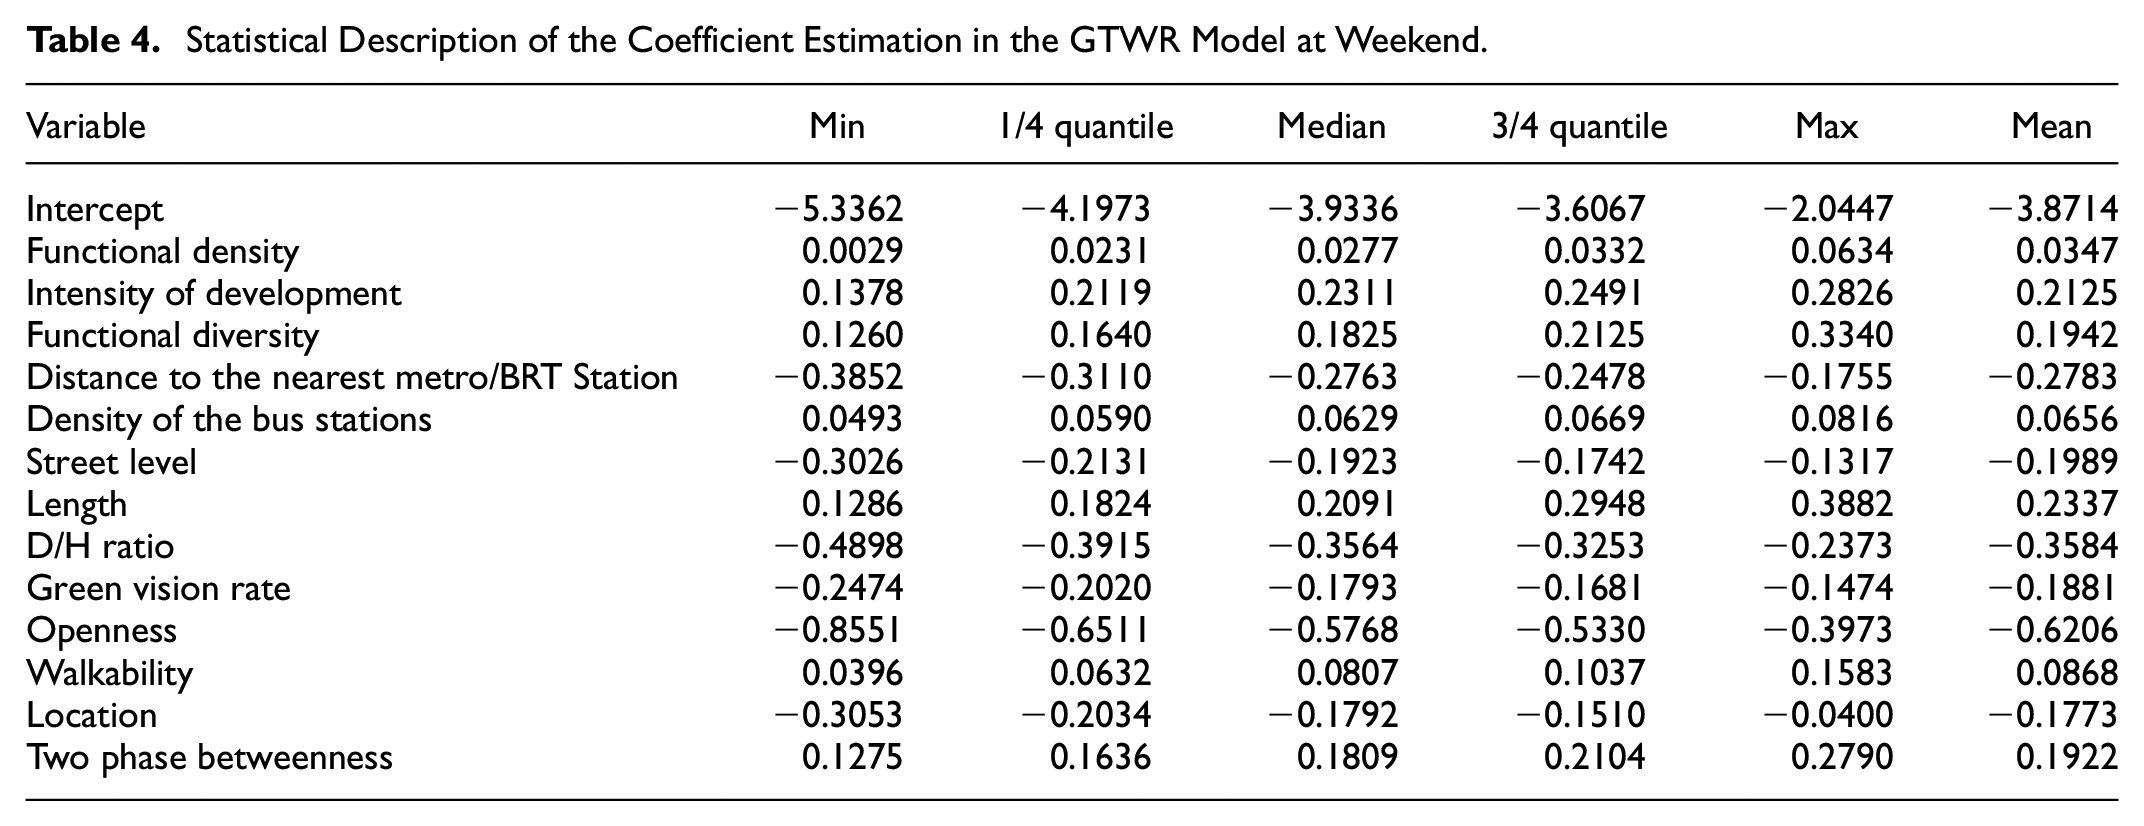
The parameter fitting results of GTWR models on weekdays and weekends are shown in Table 2, and the statistical description of the coefficient estimation results of each built environment variable is shown in Tables 3 and 4. Generally speaking, GTWR model can effectively explain the impact of built environment on street vitality. There are differences in the direction of environmental impact. Some indicators, such as distance to the nearest metro/BRT station, street level, D/H ratio, green vision rate, openness, and location, show negative effects. There are some differences between the effects of the built environment on weekdays and weekends, and there are both positive and negative effects of length on weekdays.
Parameter Fitting Results of GTWR Models.

Statistical Description of the Coefficient Estimation in the GTWR Model on Weekday.

Statistical Description of the Coefficient Estimation in the GTWR Model at Weekend.
Temporal Heterogeneity
The average values of the influence coefficients at each time point during the day on weekdays and weekends are summarized, and their changes over time are visualized.
Density
Functional density has a positive effect on the street vitality, and the degree of influences decreases with time (Figure 4(a)). The influencing features on weekdays and weekends are similar. The effect on weekday fluctuates greatly, reaching a peak at 17 o’clock. The influence in the morning and evening at weekend is stronger than that of other periods.
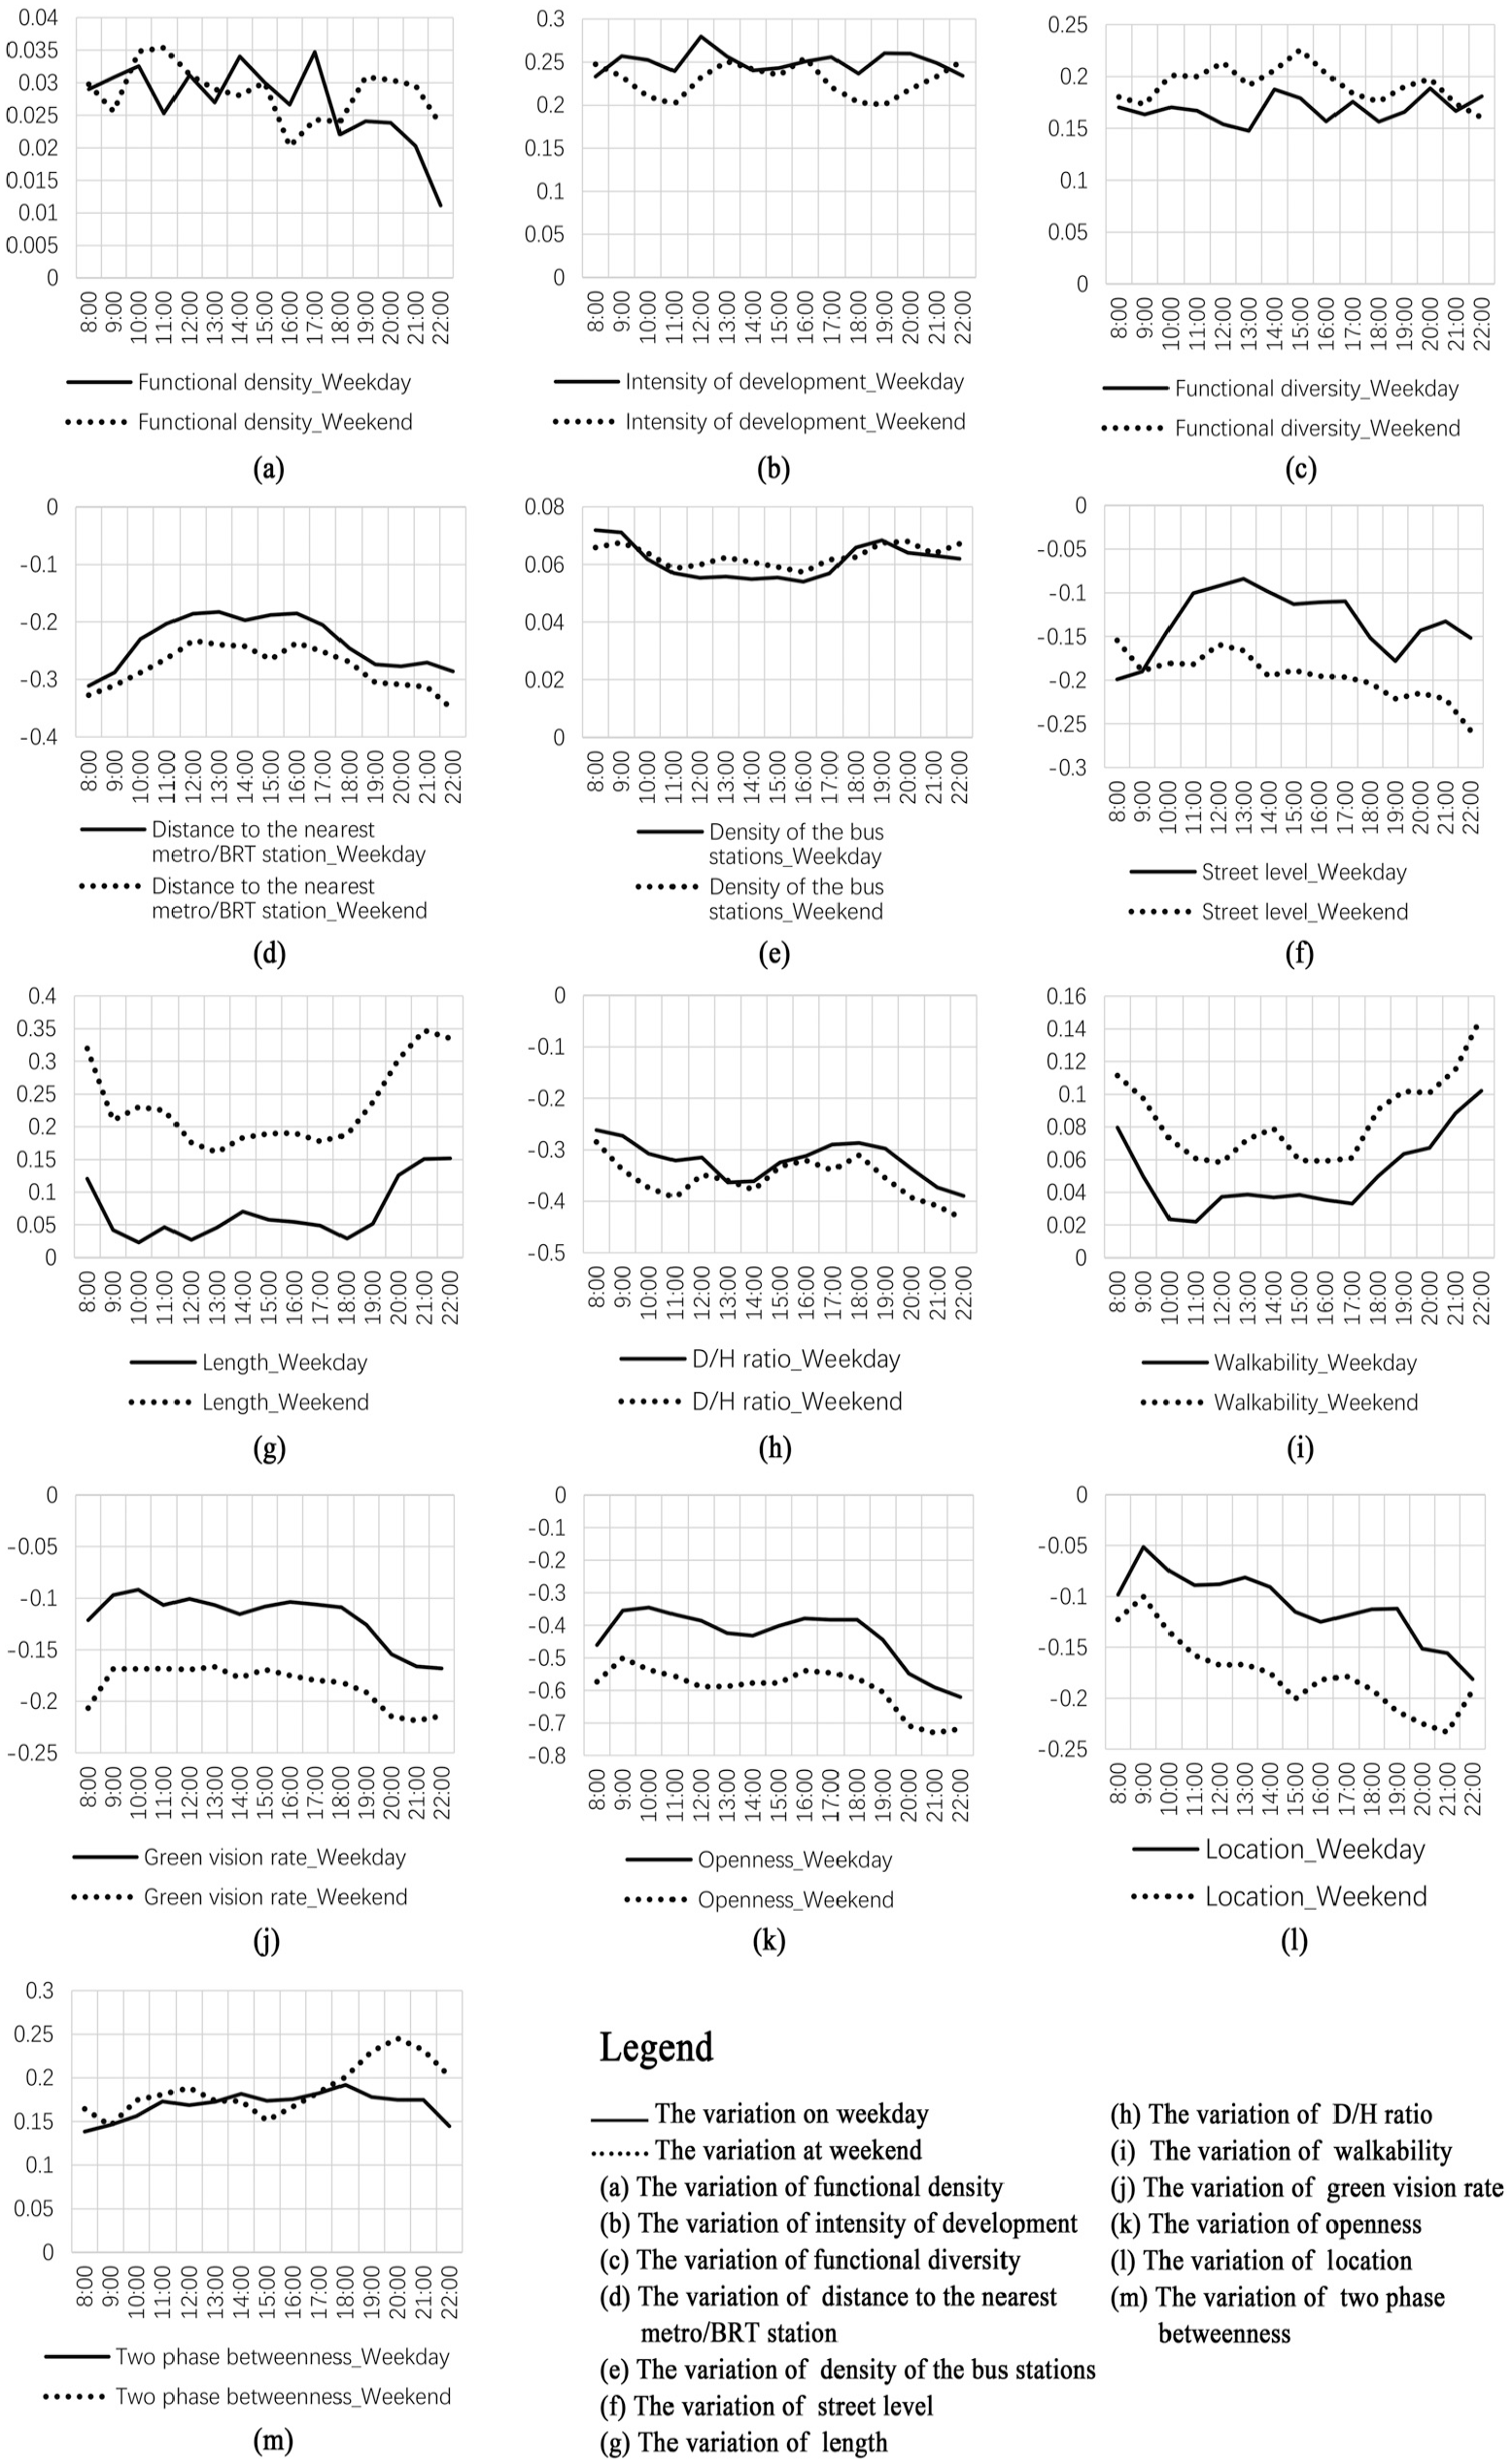
Changes in the influence coefficients of built environment indicators over time.
The intensity of development also has a positive effect on the street vitality, and the degree remains constant over time (Figure 4(b)). As high-intensity areas are mostly office and commercial functions on Xiamen Island, the effect on weekday is slightly higher than that at weekend. Such functions can attract more people in the streets on weekday. The effect peaked at 12 o’clock on weekday, which is related to the behavior of people eating out at noon.
Diversity
Functional diversity has a positive influence on the street vitality, and the effect remains stable over time (Figure 4(c)), suggesting that the influence of functional diversity on the street vitality is homogeneous over time. The impact at weekend is slightly higher than that on weekday. The reason lies in the fact that people go out for shopping and entertainment at weekend, and streets with diverse functions can satisfy their demands and attract more activities. Streets with high level of functional diversity are more likely to gather popularity, thus stimulate the vitality.
Distance to Transit
Both the metro/BRT station and bus stations promote the street vitality (Figure 4(d) and (e)). In general, the effects of the traffic stations first weaken and then rises over time, which is related to the higher travel frequency in the morning and evening. The influence of the distance to the nearest metro/BRT station at weekend is higher than that on weekday, manifesting that people have more freedom to choose travel mode at weekend. Transit-oriented development (TOD) guides people to choose rail transit. As a result, during the morning and evening rush hours, the influence of metro and BRT stations on the street vitality fluctuates more intensely.
Design
The higher the street level, the higher the street vitality (Figure 4(f)). This is due to the large traffic volume on high-level roads which lead to a higher statistical density. Further, the businesses on Xiamen Island are mainly distributed on both sides of high-level streets (such as Jiahe Road and Xianyue Road), and the vitality is relatively high. The influence degree on weekday decreases first and then increases with time, reaching its peak at 8:00 and 19:00. The influence degree at weekend shows an overall increasing trend with time.
Street length has a positive effect on the street vitality (Figure 4(g)). The street length is generally short and road intersections are dense on Xiamen Island, especially in the old urban area. The average street length is approximately 220 m, which is a suitable scale. In this case, too short streets are not conducive to gathering popularity. The effects during weekdays and weekends decreases first and then increases with time, and the degree at weekend is significantly higher than that on weekday.
D/H ratio has a negative inhibitory effect on the street vitality (Figure 4(h)). It is consistent with the conclusion of Yoshinobu (Yoshinobu, 1984), who declares that when the D/H ratio is 1 to 2, the scale of the street space is friendly and prone to stimulate vitality. As the D/H ratio increases, the sense of enclosure decreases and the street vitality will then be lost. In addition, the effect of the D/H ratio is generally increasing over time. The influence on weekdays and weekends fluctuates greatly over time, and both reach the lowest at 18 o’clock. The influence in the evening is stronger than that of other periods. The effect at weekend is slightly higher than that on weekday.
Walkability has a positive effect on the street vitality, and the degree decreases first and then increases with time (Figure 4(i)). The influence on weekdays and weekends fluctuates greatly over time, and the trend of change is similar. The effects in the morning and evening are stronger than other periods. The effect on weekend is significantly higher than that on weekdays, manifesting that people prefer streets with good walking conditions at weekend. On weekday, for the needs of commuting and working, more choices are made for short distances and convenience rather than walking conditions.
Both the green vision rate and openness have a negative effect on the street vitality (Figure 4(j), (k)). The reason lies in the fact that streets with higher vitality are mostly distributed in areas with low greening levels and small spatial scales, such as old urban areas; while the newly developed areas have a high greening rate and broad vision, but street activities are relatively sparse. The effects of the two indices decreases first and then increases with time. The influence at weekend is higher than that on weekday, suggesting that people prefer the streets in the old urban area with more greening and enclosure at weekend.
Destination Accessibility
Location promotes the street vitality. The closer the street is to the commercial center, the higher the street vitality (Figure 4(l)). The degree of influence shows a decreasing trend over time. The effect is strongest in the evening and is weakest in the morning. The effect at weekend is significantly higher than that on weekday, indicating that the better the location of the street, the higher the vitality and the stronger the central radiation effect.
The two phase betweenness has a positive effect on the street vitality, and the degree of influence is generally increasing over time (Figure 4(m)). The influence at weekend is slightly higher than that on weekend, and fluctuates greatly over time, reaching a peak at 20:00. This period is the peak time for people to go out at weekend, suggesting that people are more willing to choose streets with high accessibility in the evening.
Spatial Heterogeneity
The average values of the influence coefficients of the built environment indices on weekdays and weekends are summarized, and the changes with space are visualized and analyzed. To compare the spatial differences, the coefficients of the same indicator on weekday and weekend are segmented globally by natural discontinuity method, thus clearly describing the global heterogeneity characteristics of the same spatial unit.
Density
The spatial distributions of functional density’s effects on weekdays and weekends is roughly the same, showing that the influence is higher in the fringe areas of Xiamen Island, especially in the northeast and southwest areas (Figure 5). The most affected streets are mainly distributed around Xiamen Gaoqi International Airport, Wuyuan Bay, and Island Ring Boulevard. These streets have lower functional density and fewer businesses on both sides, as a result, the increase of functional density has a stronger driving effect on the street vitality. The streets with the weakest influence are mainly distributed around Amoy YatSen Road, Xiahe Road, and Yundang Lake. These areas have been developed with relatively complete facilities such as education, medical care, catering, and entertainment, as well as abundant commercial formats along the streets. Thus, the promotion of functional diversity is not obvious in enhancing the street vitality.

Spatial characteristics of the effect of functional density on street vitality: (a) weekday and (b) weekend.
The influencing characteristics of the intensity of development on weekdays and weekends are similar (Figure 6). The effect is stronger in the central area, with an average plot ratio of approximately 2.3. Increasing the intensity of development on both sides of the street can further enhance the street vitality. Streets with weaker influence are distributed in the newly developed areas with low density and less functions. Increasing the functional density has a weak effect on the street vitality.

Spatial characteristics of the effect of development intensity on street vitality: (a) weekday and (b) weekend.
Diversity
The influence of the functional diversity is stronger in the southwest and weaker in the northeast. The most affected streets are mainly located in the old urban areas, for instance, the Amoy YatSen historic neighborhoods with rich tourism resources and well-developed transportation. The diverse functions are more attractive to the people and tourists on the street. The streets with the weakest influence are distributed in the newly developed areas, with a relatively high proportion of local residents. The residents’ demand for functional types is relatively stable, and the abundance of street functions has a weaker influence on the street vitality (Figure 7).

Spatial characteristics of the effect of diversity on street vitality: (a) weekday and (b) weekend.
Distance to Transit
The metro/BRT and bus stations have a strong influence on the street vitality in the northern areas, including the airport, industrial areas, and the logistics parks (Figures 8 and 9). In contrast, the influence in the streets on the belt from Amoy YatSen Road to SM commercial plaza in the south is relatively weak. This result reflects the differences in the dependence on public transportation in different regions. In the remote areas with single functions, although the transportation facilities are limited, most people still rely on public transportation for trip. In the central and southern areas, people have more choices, and less dependent on public transportation.
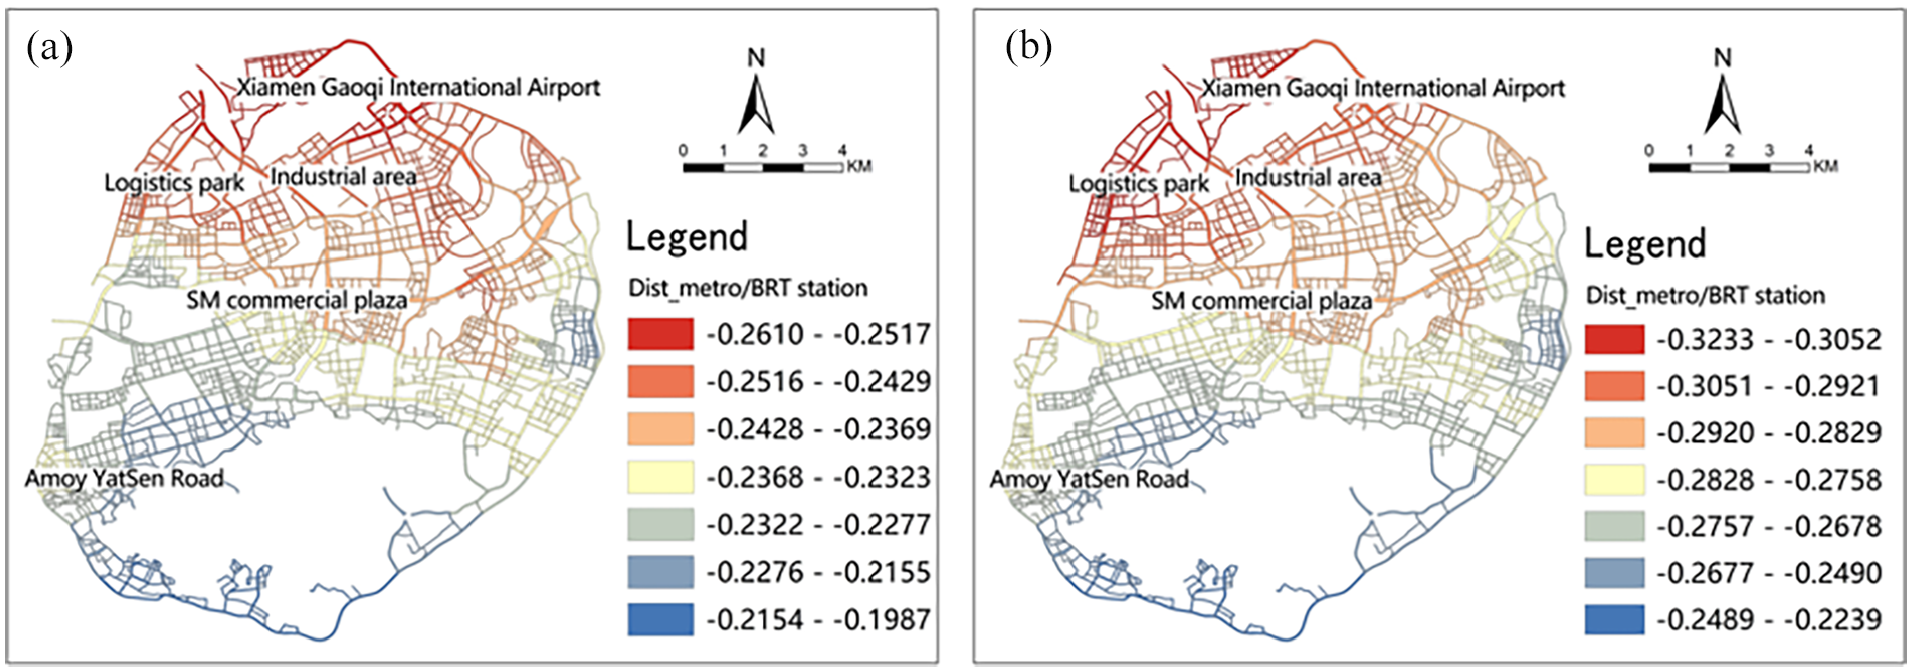
Spatial characteristics of the effect of the distance to the nearest metro/BRT on street vitality: (a) weekday and (b) weekend.

Spatial characteristics of the effect of the density of bus stations on street vitality: (a) weekday and (b) weekend.
Design
The influence of the street level on the street vitality is strong in the west and weak in the east. People tend to choose high-level roads for work and school on weekday, therefore, the most affected streets are mainly located around the Amoy YatSen Road area, Yundang Lake area, and Huweishan Park (Figure 10(a)). A large number of jobs are distributed here and the people have a higher commuting demand. The most affected streets at weekend are located in the most frequent areas in and out of Xiamen Island, indicating that the street vitality is mainly sourced from the cross-island traffic flow (Figure 10(b)).

Spatial characteristics of the effect of street level on street vitality: (a) weekday and (b) weekend.
On weekday, the influence of street length on the street vitality in the west is more significant than that in the east, which is closely related to the distribution of jobs (Figure 11(a)). At weekend, the street activities are no longer restricted by working hours and locations, and are more inclined to be affected by environmental elements such as the street length (Figure 11(b)). As a result, the overall vitality of longer streets is lower, and streets with appropriate lengths show a higher level of vitality.
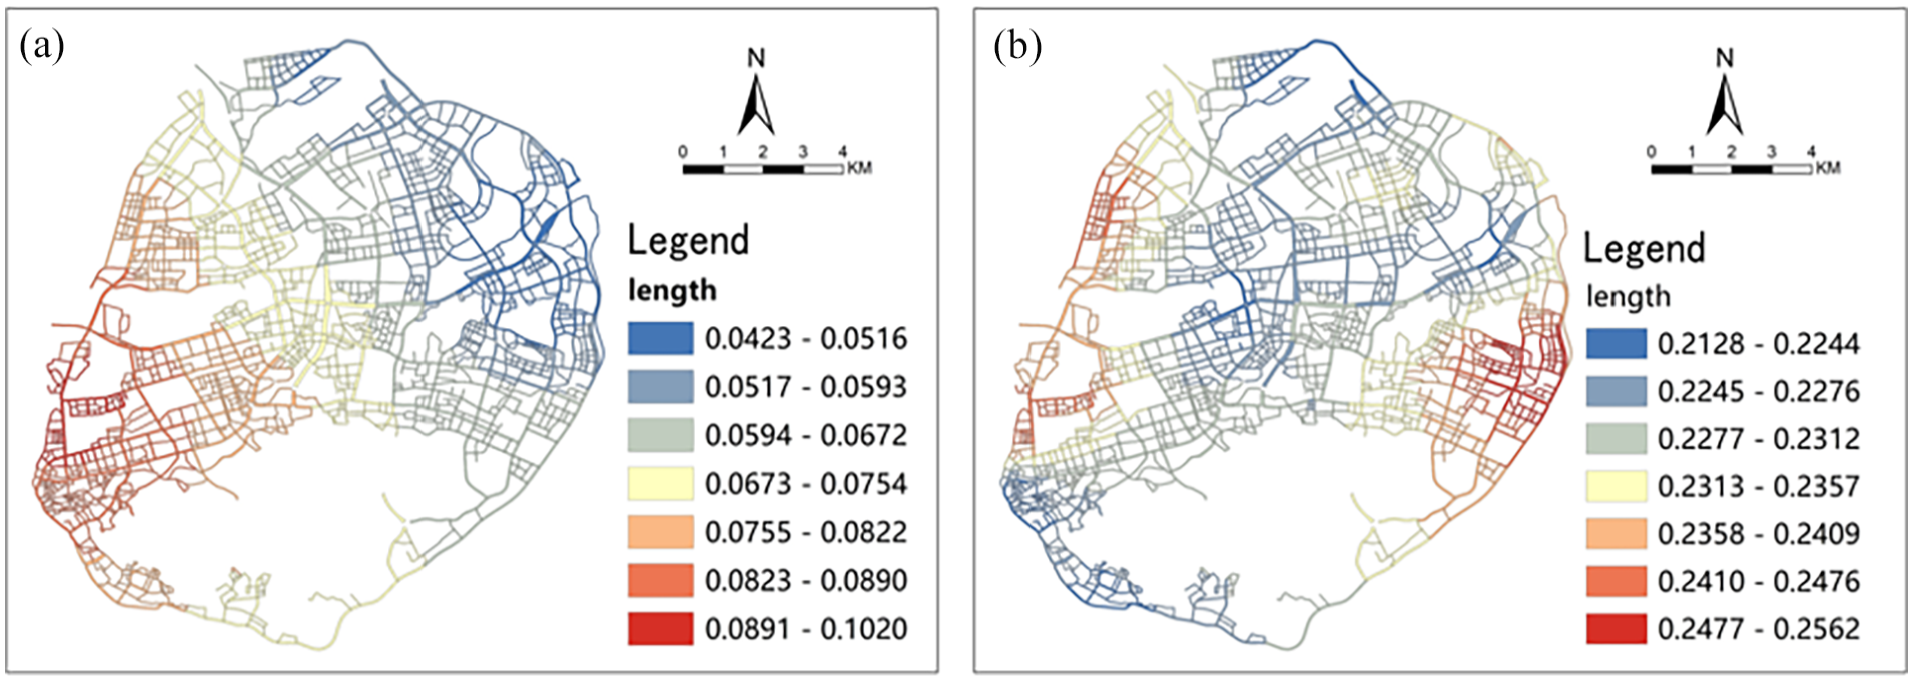
Spatial characteristics of the effect of length on street vitality: (a) weekday and (b) weekend.
The influence of D/H ratio and openness generally present the characteristics of strong in western old urban area and weak in eastern new urban area (Figure 12). The density of development in the old urban area is relatively high, the spatial scale is suitable, and D/H ratio has a strong influence on the street vitality. The lower the D/H ratio, the stronger the sense of enclosure and the higher the street vitality. Correspondingly, the openness is low and has a limited effect on the street vitality. The streets in the new urban area are large in spatial scale and lack a sense of enclosure. D/H ratio has a limited effect on the street vitality. The higher the openness, the lower the street vitality.

Spatial characteristics of the effect of D/H ratio on street vitality: (a) weekday and (b) weekend.
The green vision rate shows a significant restraint effect in the street surrounding large parks, such as the Island Ring Boulevard, Wuyuanwan Wetland Park, Xianyue Park, Huweishan Park, Bailuzhou Park, Zhonglun Park, and so on, indicating differences in the effects of the green vision rate on the street vitality (Figure 13). At the street scale, increasing the greening of a certain street section can improve the quality of the environment and attract street activities. At the district scale, better greening conditions mean sparse functions along the street and lower functional diversity, which is not conducive to attracting activities. The influence of openness is basically consistent with the green vision rate. In the eastern new urban areas with open vision, openness has a great influence on street vitality (Figure 14).

Spatial characteristics of the effect of green vision rate on street vitality: (a) weekday and (b) weekend.
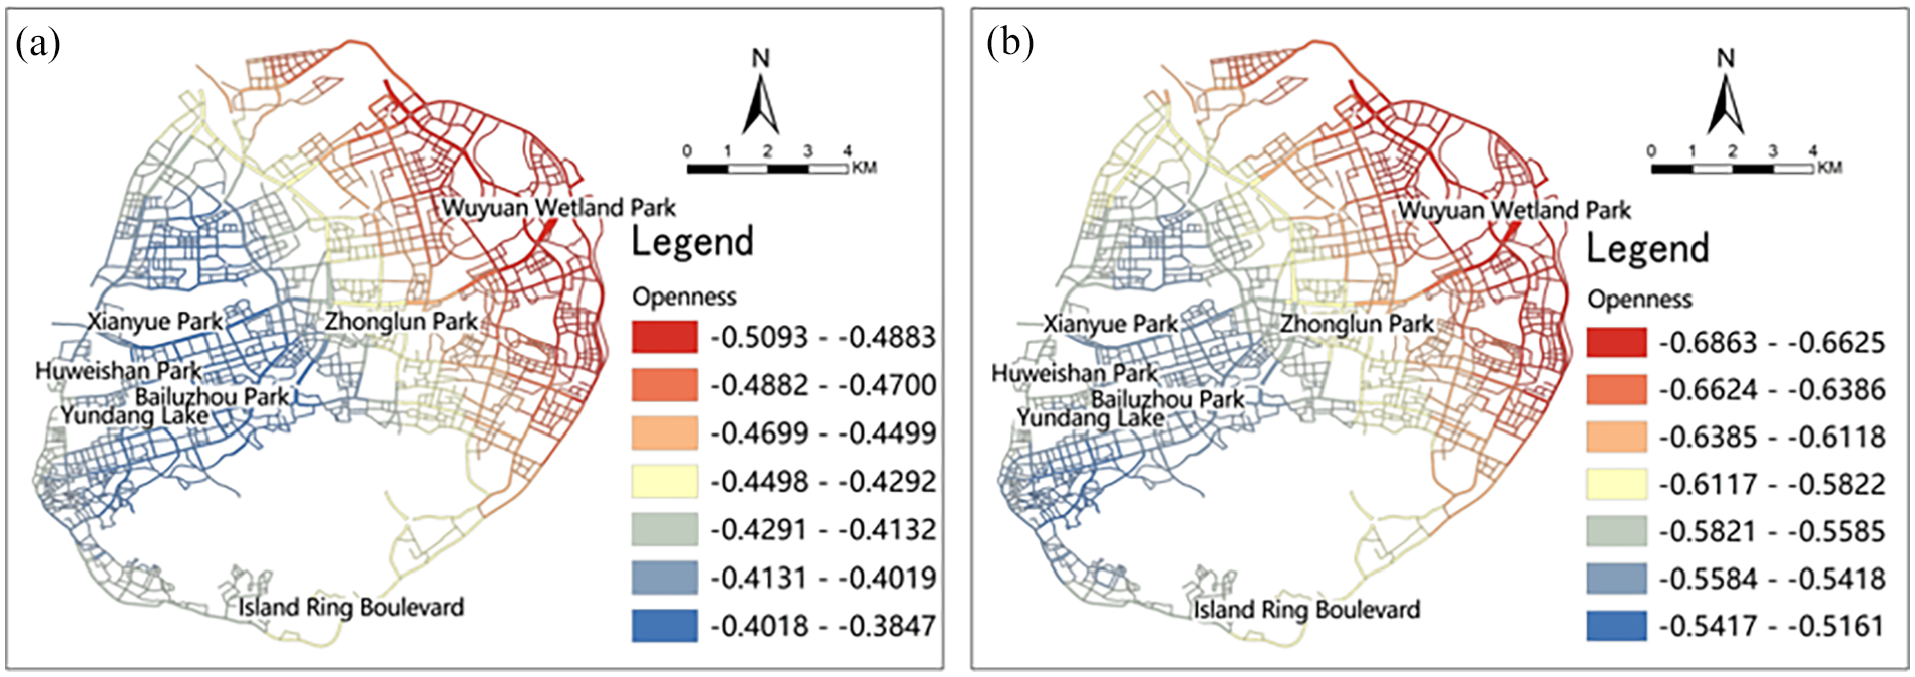
Spatial characteristics of the effect of openness on street vitality: (a) weekday and (b) weekend.
The influence of walkability is quite different on weekdays and weekends (Figure 15). On weekday, the promoting effect of walkability is significant in the employment gathering areas surrounding Yundang Lake, Amoy YatSen Road, and Xiahe Road, while at weekend, the internal streets in the entertainment and leisure areas can effectively attract activities.

Spatial characteristics of the effect of walkability on street vitality: (a) weekday and (b) weekend.
Destination Accessibility
The influence of location is strong in the north and weak in the south (Figure 16). The streets with the strongest effect are mainly located in the northern Gaoqi community, as well as the areas around the airport and the Wuyuan Bay, which are far from the city center and have not yet been fully developed. Location has relatively limited driving effect on the street vitality in the area close to the commercial centers. The weak influence in the southern coastal area is mainly due to the low density of population.

Spatial characteristics of the effect of location on street vitality: (a) weekday and (b) weekend.
The influence of two phase betweenness is much more significant in the marginal areas than the central areas (Figure 17). The streets in the coastal area of Xiamen Island are located at the edge of the street network, and the probability of streets being passed is far lower than the central area. Therefore, if the degree of betweenness increases, the probability of being passed will be significantly promoted, thereby driving the enhancement in the street vitality.

Spatial characteristics of the effect of two phase betweenness on street vitality: (a) weekday and (b) weekend.
Spatiotemporal Stationarity of Built Environment Indicators
Through comparing the spatiotemporal stationarity of the influence coefficients of built environment indicators, we can clarify the applicability of each elements in different spaces and at different times, which is conductive to making the street design strategies more targeted. Therefore, the coefficients of variation (CV) of the influence coefficients are calculated so as to explore the stationarity of their influence (Figure 18). When it is necessary to compare the dispersion degree of several groups of data, if the measurement scales are too different or the data dimensions are different, the influence of measurement scale and dimension should be eliminated, and CV can achieve the above purpose. CV has no dimension and can be compared objectively.

CVs of influence coefficients of built environment indicators in time and space dimensions.
In the time dimension, the CVs of intensity of development, functional diversity, density of the bus stations, D/H ratio and two phase betweenness are relatively small. Optimizing these elements of the street can improve the street vitality in various periods. The utility of these indicators has little difference in different periods. In contrast, the CVs of length and walkability are large. Improving the length and walkability of streets is the most effective way to improve the vitality of streets in the morning and evening. If the vitality of a street is low at other times, it is difficult to achieve the goal of promoting the vitality efficiently by improving the length and walkability.
In the spatial dimension, except for length, the instabilities of other indicators are similar on weekdays and weekends. The dispersion degrees of distance to the nearest metro/BRT station, D/H ratio, green vision rate and two phase betweenness are low, and their influences have strong spatial stationarity. Improving these street conditions can promote the street vitality of various attributes. The dispersion degrees of functional density, functional diversity and location are relatively high. Improving functional diversity and location conditions can effectively improve the street vitality in areas with sparse functions, such as new urban areas and large single-function areas. The two indicators have weak effects in the old urban areas with dense functions. However, improving the functional diversity can further promote the street vitality in the old urban areas, while its effectiveness in other areas is limited. Length can enhance the vitality of various streets at weekend.
To sum up, intensity of development, density of bus stations and D/H ratio have strong temporal and spatial stability. These indicators represent dense functions and good street space experience and feelings, which are beneficial for street users to feel the convenient and stable environment, thus gaining a strong sense of security. Optimizing the functions, traffic conditions and D/H ratio of streets can effectively promote the vitality of all kinds of streets in different periods.
Discussion and Conclusion
Discussion
Although previous studies have verified the relationship between built environment and street vitality from the macro level (Delclòs-Alió et al., 2019; Ratti et al., 2006; Sung et al., 2013, 2015; W. S. Wu et al., 2021; W. S. Wu & Niu, 2019), they mostly pay attention to which factors have significant influence and which factors have no influence. Although some factors are not significant globally, they are significant in certain periods or regions (Fan et al., 2021; A. Q. Zhang et al., 2020). As a result, it is necessary to generalize their influence characteristics. On the basis of previous studies, this study found the spatio-temporal heterogeneity of various factors affecting street vitality. For instance, although functional diversity has no influence on street vitality in previous empirical studies (Delclòs-Alió et al., 2019; Sung et al., 2015; W. S. Wu & Niu, 2019), it is found in this study that the index has a significant influence in the old urban area and a weak influence in the new urban area. The results provide empirical evidence for the spatio-temporal heterogeneity of street vitality, as well as a more accurate reference for street space design.
Multisource big data brings a new perspective to the research on microenvironment design including streets. First, the time-varying characteristics of the street activities can be portrayed at the district scale. LBS data track residents’ trajectories within a wide range of time and space, and meet the requirements of high positioning accuracy at the same time. Second, the detailed and microscopic space design can be described accurately at the city level by using street view images, POIs and web-crawled data, which is difficult to achieve with the traditional field survey data. That’s why most of the related studies are conducted at the street scale. These data make the understanding of 5D deeper, and also bring new cognition to street space and the vitality.
In order to maintain street vitality and form sustainable traffic, differentiated strategies of vitality enhancement should be formulated according to the locations and attributes of the streets. In the old urban area, more attention should be paid on improving the street infrastructure, optimizing the street network structure, and cautiously setting up large-scale and single-function service facilities. At the same time, in the new urban areas, excessive spatial scale and single business type should be avoided. Specifically, for streets located in underdeveloped regions or newly developed areas, the intensity of development and the number of functions on both sides of the street should be focused on. Streets located in densely populated areas such as central areas of the city should introduce diversified functions and business formats along the streets. Located in residential, commercial, and official areas, the transportation facilities should be further improved to satisfy the needs of daily travel, thereby promote the street vitality.
There are still a few limitations. First, although this study tries to draw general conclusions, and Xiamen Island is a representative case, the results are still inevitably context specific, thus entailing comparative studies to improve the universality of the method and conclusions. Second, during the data collection period, the local cases of Covid-19 infection in Xiamen were all zero. Nevertheless, this is still a study that is framed within the limitation of the pandemic’s movements. It is still necessary to collect data for a longer period. It is meaningful to compare the findings before and after the epidemic. Also, the comparison with other periods or other fields will enable us to draw different results and discussions after the analysis with greater confidence. Third, on both sides of the streets of different levels, the spatial distance that affects vitality is different, and we didn’t distinguish this difference when calculating indicators related to POI and buildings. The reason is that we set the index of street level, the influence of which on street vitality can be reflected in the results. Also, based on the different connotations of the indicators, different buffer ranges have been chosen to eliminate the deviation caused by different influence distances on both sides of different streets. Fourth, when recognizing streets view images, movable objects on the street may block the recognition elements. However, this error is not obvious in this study. Xiamen is a clean tourist city, thus, there are almost no mobile stalls on the street. In addition, we use panoramic photos, the images of people are relatively small, and people’s occlusion of buildings and greening can be neglected. Therefore, we can accurately extract and calculate the micro-environmental elements of the street.
Conclusion
Multisource big data are used to measure the spatiotemporal characteristics of the street vitality and the built environment at the district scale in this study. The geographically weighted regression model is carried out to explore the influence of multiple environmental variables on the street vitality, and the spatiotemporal heterogeneity are described in detail. The conclusions can help clarify and refine the improvement strategies of the street vitality in different urban environments, which is conductive to the improvement of public health and physical activities.
In the dimension of time, there is obvious heterogeneity in the influence of various environmental elements on street vitality. (1) The influence of function remains constant over time. Density and diversity can effectively maintain the street vitality during the day. (2) Transit has the strongest effect on the improvement of street vitality during peak hours, and the influence present an obvious tidal phenomenon. (3) The impact of design is strongest in the evening. (4) The effect of accessibility gradually strengthened over time, reaching the highest in the evening.
In terms of the spatial dimension, the heterogeneity brought about by the new and old urban areas is significant. The influence of function and transit in the old urban area are more significant than that in the new urban area. The spatial heterogeneity of design’s influences is prominently brought about by large green lands and landscape streets. The highly landscaped streets can easily lead to sparse functions and a sense of space fracture, forming a trough area of vitality.
Density, bus station and spatial scale have strong temporal and spatial stability. Dense buildings, convenient traffic and pleasant spatial scale can effectively promote the vitality of all kinds of streets in different periods. Length is the most unstable during the weekdays. The optimization of other indicators should be treated differently according to the attributes of streets and the requirements of vitality promotion in specific time periods.
The causes of spatio-temporal heterogeneity are complicated, including individual differences, geographical factors, spatio-temporal dependence, and are sensitive to scale. In order to explore the reasons why the built environment affects the spatial and temporal heterogeneity of street vitality, it is necessary to analyze in detail the individual characteristics and socio-economic characteristics of the active people in the street, as well as their behavior patterns such as commuting. Further, the proximity between spatial units and time units should be explored systematically by means of spatio-temporal geographical analysis.
Footnotes
Appendix
Results of Spatial Heterogeneity Test.

| Time | Weekday | Weekend | ||
|---|---|---|---|---|
| Breusch-Pagan value | p Value | Breusch-Pagan value | p Value | |
| Full-time | 41296.0*** | .000 | 29060.0*** | .000 |
| 8:00 | 2312.8*** | .000 | 1607.2*** | .000 |
| 9:00 | 3017.9*** | .000 | 1790.0*** | .000 |
| 10:00 | 3323.1*** | .000 | 2228.1*** | .000 |
| 11:00 | 3382.5*** | .000 | 2463.5*** | .000 |
| 12:00 | 3056.7*** | .000 | 2570.6*** | .000 |
| 13:00 | 2415.1*** | .000 | 2155.8*** | .000 |
| 14:00 | 3794.4*** | .000 | 2121.6*** | .000 |
| 15:00 | 3571.9*** | .000 | 2767.2*** | .000 |
| 16:00 | 3180.0*** | .000 | 2549.4*** | .000 |
| 17:00 | 3631.3*** | .000 | 2309.0*** | .000 |
| 18:00 | 3034.7*** | .000 | 2228.4*** | .000 |
| 19:00 | 2841.9*** | .000 | 1900.0*** | .000 |
| 20:00 | 2645.9*** | .000 | 1583.8*** | .000 |
| 21:00 | 2282.2*** | .000 | 1734.8*** | .000 |
| 22:00 | 2148.3*** | .000 | 1622.8*** | .000 |
is significant at the 1% significance levels.
Declaration of Conflicting Interests
The author(s) declared no potential conflicts of interest with respect to the research, authorship, and/or publication of this article.
Funding
The author(s) disclosed receipt of the following financial support for the research, authorship, and/or publication of this article: This research was funded by the National Natural Science Foundation of China [grant number 51908229] and the National Social Science Fund of China [grant number 20FJYB017].