
Abstract
This study explores the invisible bias quantification of urban governments in their affordable housing service delivery, which can accurately identify the deficiencies of affordable housing policy and alleviate homelessness, poverty, and inequality. We identified complicated eligibility criteria for public rental housing programs in 153 prefectural cities and constructed a public rental housing accessibility index for urban residents and migrants. We used the principal component analysis method; this study offers a new perspective to explore these disparities. We found distinct regional differences in local governments’ behaviors and preferences regarding affordable housing. Cities’ affordable housing provision for migrants is selective and mainly targets young and highly educated migrants. We suggest that local governments pay more attention to elderly migrant workers in affordable housing provision and build a comprehensive evaluation system to set reasonable access conditions to prioritize those with urgent housing needs.
Introduction
A country’s main goal must be to achieve the ideal of equality of opportunities to help distinct groups of the urban population have access to public services and eliminate conflicts in the provision of these opportunities Zail et al. (2016). However, urban governments have discriminated in their service delivery against migrants and the poor in some countries. In China, this bias in public service provision is reflected in regional disparity and between urban residents with local hukous (registered residence) and migrants without local hukous. To protect people’s livelihoods and promote economic development and social equity, this disparity should be narrowed. Therefore, this study explores the invisible bias quantification of urban governments in their affordable housing service delivery, which can accurately identify the deficiencies of affordable housing policies and alleviate homelessness, poverty, and inequality.
The lack of affordable housing of decent quality is a chronic problem in urban areas. Governments have tried to alleviate this by providing social housing for low-income households. However, such policies are costly. In recent decades, China has experienced strong economic growth, rapid urbanization, accelerated population mobility, and housing prices soaring. Facing the increasingly serious housing affordability problem in urban areas Shi et al. (2016), Yang et al. (2014), Mak et al. (2007), the central government introduced some affordable housing policies. They accelerated the construction of affordable housing at unprecedented rates and established a large-scale affordable housing system that covers most prefectural cities in China. Since 2008, affordable housing programs in China have mainly included public rental housing (PRH), cheap rental housing (CRH), economical and comfortable housing (ECH), and capped-price housing (CPH), with PRH taking the lead in the number of constructed units He et al. (2022). According to the Ministry of Housing and Urban-Rural Development (MOHURD), from 2008 to the end of 2018, a total of 24.5 million units of affordable housing began, with 16 million PRH units (this number includes CRH units), 5.7 million ECH units, and 2.8 million CPH units. From 2013 to 2016, the total area of land allocated for affordable housing (PRH, CRH, and ECH) was 86,735.7 hectares, accounting for 21.4% of the total land supply for urban residential use. More than 37 million people with housing difficulties had moved into the PRH, and approximately 22 million had received public rental housing subsidies by the end of 2018.
Although the nationwide availability of affordable housing has improved, variations across cities deserve more attention. From 2009 to 2017, the central government’s expenditures on affordable housing increased from 2.6 to 42.1 billion Yuan, while local governments’ expenditures jumped from 70 to 613 billion Yuan, and the share of affordable housing spending in local governments’ general public budget rose from 0.95% to 3.22% (NBSC 2010–2018). Affordable housing in China is a top-down policy owing to its intergovernmental structure and tax arrangements Zou (2014), Chen et al. (2014). To ensure people’s livelihood and maintain social stability, the central government formulates affordable housing policies, and requires local governments to construct and distribute affordable housing based on their financial capabilities. Therefore, local government is the main force to implement housing security in China. Taking the PRH as an example, the central government has not stipulated general rules regarding qualifications. This gives local governments the freedom to implement their distribution policies. The qualifications are broad and vary from city to city Chen et al. (2014). The intergovernmental system has exacerbated housing inequality between different regions. It forces local governments to rely on locally generated resources to pay for affordable housing Zou (2014).
Moreover, urban residents experience better housing welfare than migrants in the same city Yu and Cai (2013), Huang and Yi (2015), Wang and Otsuki (2015). Urban residents who have local permanent urban hukous can enjoy welfare benefits, such as schooling, health care, unemployment insurance, pensions, and housing subsidies. Migrants without local hukous experience lower levels of urban welfare benefits than permanent residents Shen (2006). An administrative regulation called “Custody and Repatriation” (C&R) promulgated in 1982 authorizes the police to detain immigrants who do not have a local residence permit (hukou) or temporary residence permit. Officials can then repatriate these “illegal immigrants” to the settlement where their permanent residence is located Chan and Buckingham (2008). Although the C&R law was formally abolished in 2003, the hukou system still restricts migration. Urban migrants include rural-to-urban migrants with agricultural hukous and city-to-city migrants with urban hukous of birthplace. For better job opportunities and public services, they move to one city. However, it’s hard for them to get permanent urban hukous in this city. He et al. (2022). Although the marketization of the housing supply has promoted migration from rural to urban areas and created millions of jobs for migrants, rising housing prices have made it increasingly difficult for migrants to afford decent housing. Chen et al. (2010), Yang and Shen (2008).
Few studies have assessed the variation in affordable housing provision at the city level. However, they have not assessed the disparity in affordable housing provision for urban residents and migrants within cities. Some scholars used the ECH proportion sales among total commercial housing sales to explore local governments’ affordable housing provision, the land proportion supplied for affordable housing of the total land supplied for residential use Ding (2003, 2007). They can also use the proportion of local government expenditures on affordable housing in general public budgetary expenditures. However, with the development of affordable local housing policies, these indicators have some shortcomings. First, the ECH method has been outdated since ECH has been gradually suspended in recent years Shi et al. (2016) and has only existed in a few cities such as Shanghai Chen et al. (2017). Second, since affordable housing provision is a long-term accumulation by local governments Cai et al. (2017), the land supply method share or affordable housing expenditure share is unstable and may vary across years. Moreover, all of the above methods fail to provide insights into local affordable housing policy preferences for urban residents and migrants.
An increasing number of housing studies have been based on big data. Li and Li (2018) examined the correlation between wind direction and walled buildings prices using big data analysis. We use data crawler technology to collect policy information in this method. Therefore, this research can fill those gaps by constructing the PRHAI (Public Rental Housing Accessibility Index for residents with local hukous) and the PRHAI-N (Public Rental Housing Accessibility Index for residents without local hukous) for each prefectural city to reflect the local provision of affordable housing for urban residents and migrants, respectively. A higher PRH accessibility index of a city indicates more relaxed PRH eligibility conditions and a higher level of local government’s affordable housing provision in the sense of meeting its actual affordable housing needs.
The other contributions of this study are as follows. (1) Compared with the case study analysis on eligibility conditions of affordable housing in the existing literature, this study makes a comprehensive analysis by categorizing and quantifying the eligibility criteria of PRH programs in 153 prefectural cities. It thus provides first-hand prefecture-level evidence of PRH entry barriers for urban residents and migrants. At the regional and city tier levels, basic characteristics are also offered to discuss affordable housing policy preferences. (2) Owing to limited data, affordable housing provision for urban migrants remains unclear to policy researchers and the public. For example, local governments only report aggregate investment or land supply areas for affordable housing; affordable housing units constructed or distributed are also not distinguished between urban residents and migrants in reporting data. By comparing the ranks of our calculated PRHAI and PRHAI-N in the same city, the policy preferences of local governments between urban migrants and residents can be easily distinguished.
Literature Review
Affordable housing is a hotly debated global issue. After the 20th century, affordable housing systems have been established in most countries to solve the housing problems of urban residents in the process of industrialization. Many studies have been conducted on affordable housing, and we focus on related research on affordable housing policies and accessibility.
Affordable Housing Policies
Research on affordable housing policies has mainly focused on policy design and effect. For policy design, Ohls (1975) found that the government builds affordable housing with efficiency losses by establishing a general equilibrium model of housing market filter and proposed a housing monetary subsidy policy to increase housing consumption for low-income people. Arnott et al. (1999) further developed a housing filter model and analyzed the impact of monetary subsidies, in-kind subsidies, and other policies on the housing market. Housing subsidies may be appropriate but not always optimal Apgar (1990). Laferrère and Le Blanc (2004) found that the efficiency of housing subsidies was better than the government’s direct construction of affordable housing. However, housing subsidies increased rent in the housing market, making it difficult to assess the overall welfare of the two programs.
Empirical studies have been conducted to verify the crowding-out effect of affordable housing on the commercial housing market Walters (2009), Malpezzi and Vandell (2002). Moreover, von Seidlein et al. (2017) studied the role of affordable housing designs for disease control and public health in Africa. Engelsman et al. (2018) analyzed the interaction between community land trusts, affordable housing, and community organizations in low-income areas of New York and Boston, USA. They argued that low-income residents could be provided with affordable housing through community-led land trusts.
Affordable Housing Systems
In the affordable housing systems of developed countries, when the housing market was seriously in short supply, the government would intervene through the construction of public houses. When the housing shortage problem disappears, the government uses market mechanisms to solve residents’ housing problems Bramley and Karley (2005), Choguill (2007). In developed countries such as the United States, Germany, Singapore, and Japan, housing security development is mature and no longer provides public housing directly but provides rent, tax subsidies, and financial support Bischoff and Maennig (2012), Noll and Weick (2014), Hsiao (2021). Shaped by the economic processes and demographic change, and urbanization, China’s housing system is difficult to integrate into a model of convergence between housing systems in different countries. However, it emerges as a hybrid system Wang and Murie (2011).
A substantial body of literature has attempted to understand how China’s affordable housing system has emerged and developed over the past decades. Zou (2014) analyzes the conflicts between the central and local governments in the division of incentives, responsibilities, powers, and revenue sources, which leads to a conflict between the local government and the central government’s goals of affordable housing. Hu and Qian (2017) explored local governments’ commitment to affordable housing by focusing on the share of land supply on PRH, ECH, and CRH in the total residential land supply at the prefectural level. They find that cities with a higher degree of land finance dependence and greater financial autonomy are less likely to devote land to constructing affordable housing. Cai and Wu (2019) provide an empirical analysis of municipal public officials’ affordable housing policy in China. Fan and Yang (2019) introduced a path incentive model for local policy implementation, including administrative, experimental, flexible, and symbolic execution.
China’s Affordable Housing Accessibility
China’s migrants, especially rural-to-urban migrants, face great challenges regarding housing affordability. Conversely, migrants did not benefit from China’s transition from socialist housing allocation, where the highest winners were those who were favored in the previous system, based on factors such as residence status, education, and occupation Logan et al. (2010). In contrast, many migrants are paid lower or work in the informal sector without social insurance owing to a lack of socioeconomic background; thus, they are less likely to afford commercial housing in the market. Lin et al. (2014) pointed out the marginal status of rural migrants in the affordable housing supply system. Chen et al. (2017) conclude that the PRH program in Shanghai is a very selective program with a clear goal to attract and retain “talented professionals” to enhance cities’ economic competitiveness and little consideration to solving the affordability problems of low-income migrants.
A growing body of literature focuses on the exit determinants, barriers, and China’s affordable housing residential satisfaction. Gan et al. (2019) examined residential satisfaction with a large PRH program in the developing municipality of Chongqing. Li et al. (2019) found that housing supply is the most important factor determining the tenant’s barriers to exiting PRH. Residential satisfaction is also seen as a motivation for PRH exits. However, as the first component of PRH programs, PRH has rarely been fully analyzed in the literature. Some scholars discuss PRH eligibility criteria in megacities such as Beijing or several cities as a case study comparison Cai et al. (2017), Lin et al. (2014). When an affordable housing supply is fully responsible for by local authorities, a horizontal cross-city comparison of entry barriers could help us understand local governments’ behaviors and policy preferences in affordable housing provision.
Although the above studies enrich our understanding of the local implementation of PRH policies and provision for migrants, studies in this field remain insufficient. A straightforward question is how local governments implement PRH policies and the extent to which they are achieved. Moreover, except for Beijing and Shanghai, how are migrants treated in other cities regarding affordable housing provision, or is there any common feature of local affordable housing policy for migrants and its reasons? In summary, previous studies regarding China’s affordable housing have emphasized the contradiction between the central government’s goal and local governments’ implementation, the marginal status of migrants, and the determinants or barriers of PRH exits. In terms of methodology, many studies are case studies in several cities or in-depth analyses of small survey samples. This article contributes to the existing literature by focusing on the eligibility criteria of China’s PRH programs in 153 cities for urban residents and migrants to discuss local governments’ behavior and preferences in affordable housing provision.
Affordable Housing in China: New Developments
Over the past decade, there have been three major policies for affordable housing in China: First, the coverage of affordable housing has expanded to include urban migrants. The earliest forms of affordable housing, such as ECH and CRH, targeted low- and moderate-income urban residents with a local hukou. In 2010, cities with extra financial capacity were encouraged to include urban migrants without local hukous but with stable employment in their PRH programs (MOHURD 2010 No.87). However, owing to the urgent housing affordability issue for local residents, most cities focus on providing PRH to their residents. Since 2017, an increasing number of cities have announced PRH policies for their migrants. Since 2019, the central government has required local governments to enforce their PRH provision for urban migrants, especially those working in public service industries and key industries in a city (MOHURD 2019] No.55). According to our estimations, over 90% of prefecture-level cities include urban migrants without hukous in their PRH programs.
Second, the main tenure type for affordable housing is changing from ownership to rental-oriented. Early affordable housing types such as ECH and CPH were owner-occupied. In 2003, the State Council formally abandoned the concept of the ECH as the main form of post-reform housing (SC 2003 No.18). Since then, the supply of ECH and its share of total housing in urban China have declined Shi et al. (2016). In 2010, the (MOHURD) promoted rental-oriented PRH as a favored public housing mode nationwide (MOHURD 2010] No.87). Since 2014, the CRH has been merged with public housing and treated as a special part of the PRH (MOHURD 2013 No.178). In 2019, local governments were encouraged to enhance PRH development through affordable housing provisions (MOHURD 2019 No.55).
Third, the central government encourages PRH in cash. From 2010 to 2016, the construction of PRH units occurred at unprecedented rates, with the target set at 11 million in the 12th Five-Year-Plan (2011–2015) Li et al. (2019). Since PRH in kind requires a huge and sustained devotion of local governments on land supply, constructing PRH buildings, allocating units, and managing tenants, it places a financial burden on local governments and causes issues in PRH locations or public facilities accessibility. At the end of 2016, the central government encouraged the combination of PRH in-kind and cash and gradually converted it to PRH in cash (MOHURD 2016] No.281). Qualified PRH applicants can choose between PRH in kind and cash. Cities are given the flexibility to set specific PRH in cash standards based on their financial capacity. Taking Wuhan City as an example, its newly qualified PRH applicants can choose from PRH in kind or PRH in cash. Qualified PRH applicants who already choose PRH in kind can also apply for conversion to PRH in cash. The amount of PRH in cash each month = subsidy standard (25 yuan per square meter per capita in 2017) × subsidy area (16 square meters per capita—current living area per capita) × household size × subsidy coefficient. There are three tiers of subsidy coefficients: 1.0 for households with an average income lower than the local minimum living standard; 0.8 for households with an average income higher than the local minimum living standard but lower than 2.5 times of local minimum living standard; 0.4 for households with an average income higher than 2.5 the local minimum living standard but lower than the income limit for PRH eligibility.
Data and Methodology
Data
To ensure data readability, we collected information from the PRH eligibility management policy documents officially issued by the cities’ official government website, such as Zhengzhou Municipal Public Rental Housing Management Measures issued by the website of the Zhengzhou government in 2010. The data source must be a policy documents issued by the city official government’s website and not related information published by the cities’ housing administration bureaus. After data collection, we found that 153 issued PRH eligibility documents through official government websites among all prefecture-level and above cities in China. Based on the official public documents available on PRH eligibility policy at the prefectural city level, this research collected related information of 153 prefectural cities from 2008 to 2018. This included 59 eastern cities, 48 central cities, 46 western cities, and all first-tier cities, most second-tier cities, most third-tier cities, and some fourth-tier cities. The city data we collect cover all types of cities and are evenly distributed in the east, middle, and west regions, ensuring that there will be no bias when constructing the index system. Some cities located in western regions such as Tibet, Xinjiang, and Gansu is vast and sparsely populated. Their economic development is backward, and they have no corresponding affordable housing policies. The distribution of cities is shown in Figure 1.
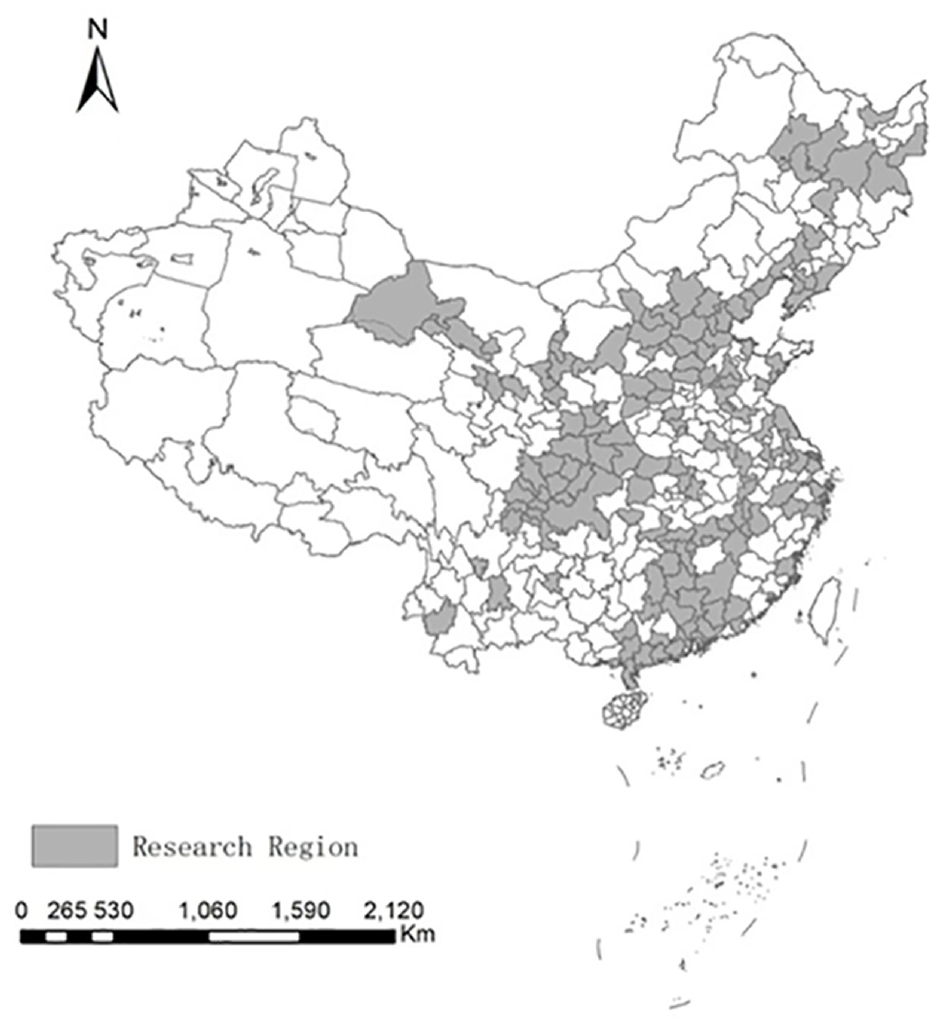
Distribution map.
The PRH Accessibility Index Construction
PRH eligibility indicators
The reasons why the PRH accessibility index can be an appropriate and reliable indicator of the level of local governments’ affordable housing provisions are as follows. First, other types of affordable housing programs have taken much smaller roles in affordable housing provision in recent decades than PRH. In 2010, the MOHURD promoted PRH as a favored national mode of public housing (MOHURD 2010 No.87). In 2003, the State Council formally abandoned the concept of the ECH as the main form of post-reform housing (SC 2003 No.18). Since then, the supply of ECH and its share of the total housing stock in urban China has been declining Shi et al. (2016). The central government does not mandate the CPH programs. The local governments show little enthusiasm for them because of the lack of benefits derived from the land supplied for CPH and concerns over whether CPH will compete with market housing Zou (2014). Thus, the CPH programs exist only on a small scale in many cities, such as Beijing and Shanghai. Second, eligibility conditions for affordable housing programs share some similarities within a given city. Specifically, the ECH and the PRH programs both set eligibility restrictions in aspects such as household income, living area per capita, hukou status, and household total asset value. For example, Nanjing City requires a household living area per capita below 15 square meters for the ECH and the PRH applications. Xi’an City has set this limit to 17 square meters for the ECH and the PRH applications. Third, the PRH accessibility index measures the level of affordable housing provision by the local government in that affordable housing provision serves to meet a city’s actual demand. In cities where population or housing prices rise rapidly, demand for affordable housing increases faster and thus requires more affordable housing provision. Suppose local governments can meet actual needs, the eligibility requirements will be looser. Suppose local governments cannot meet demand, the eligibility requirements will be strict. Since local authorities dynamically and voluntarily adjust eligibility conditions, PRH accessibility could represent the actual level of local governments’ affordable housing provision. Fourth, PRH is the only affordable housing program that targets urban residents with hukous and migrants without hukous Chen et al. (2014). Thus the constructed PRHAI and PRHAI-N would reflect the actual level of affordable housing provision by local governments for both groups and offer more insight into local governments’ policy preferences.
For a given fixed supply of public housing units, there is a concern that looser eligibility conditions would increase the waiting times before qualified applicants were allocated public housing units. Thus, the actual living needs of affordable housing may not be met because of insufficient provision. Several factors can help alleviate these concerns. First, local governments have little incentive to set loose PRH access requirements that are not in line with their capacity. In contrast, the central government has no restrictions and evaluations on the strictness of access conditions set by each city; thus, local governments do not need to lower PRH accessibility to cater to the central government. However, handling excess application documents, screening qualified households and allocating and managing tenants would increase management costs, which is not an attraction for local governments. Second, waiting to move to PRH units is not the only option for qualified applicants. They can choose between two forms of PRH benefit arrangements. One is waiting to move into the PRH units (PRH in kind). The other does not move into PRH units but receives a monthly cash subsidy (PRH in cash). Thus, all qualified applicants are guaranteed to receive benefits from local governments. Third, because of local government’s financial burden regarding the construction of PRH projects, the central government has encouraged local authorities to reduce the physical building of PRH units while promoting cash subsidies for qualified applicants of PRH, thus playing the role of the housing rental market itself since 2017. Therefore, owing to the development of affordable housing policies and their implementation in China, the PRH accessibility index based on eligibility requirements for the past 10 years and in the expected future could be a reasonable indicator of local governments’ level of affordable housing provision.
Since local governments adjust the PHR eligibility policy at irregular intervals over the years, we extract PRH access conditions based on up-to-2018 (the end of 2018) PRH eligibility conditions for urban residents with local hukous and migrants without local hukous. By organizing and categorizing the various complicated access conditions of 153 prefectural cities, we were able to quantify three types of PRH access conditions for urban residents and migrants: income thresholds, current housing conditions, and additional conditions (Table 1). Income thresholds and current housing conditions are the primary criteria that all cities set specific restrictions on for urban residents and migrants. Additional restrictions for urban residents are specified in the household head’s non-agricultural hukou status, hukou status of family members, household total assets, and vehicle ownership. However, additional restrictions for urban migrants without local hukous are specified in residence permits, stable employment status, degree of education, years of graduation from college, and participation in the Social Insurance or Housing Provident Fund. To reflect the accessibility of PRH programs in different cities, we quantified these indicators to ensure that the larger this indicator, the looser the eligibility criterion of a city. Each indicator here is independent, and the PRH applicants should meet all of these conditions to be qualified.
PRH Eligibility Indicators for Urban Residents and Migrants.

Principal component analysis
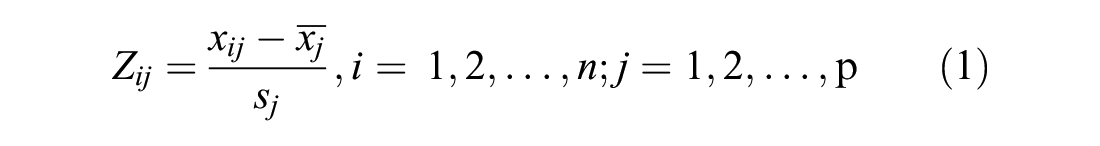
We obtained six eligibility criterion indicators for urban residents and seven indicators for urban migrants. Among these indicators, the income threshold is numerical, ranging from 0 to 2, whereas the other indicators are all binary. We adopted a widely used method, principal component analysis (PCA), to construct the PRH accessibility index for urban residents (PRHAI) and PRH accessibility index for migrants (PRHAI-N) of 153 prefectural cities in China.
PCA is central to the study of multivariate data, as it can simplify the data structure through dimensionality reduction and convert multiple indicators into a few comprehensive indicators (Tolmasky & Hindanov, 2002). PCA is one of the most important dimensionality reduction methods and is widely used in data compression to eliminate redundancy and data noise elimination Tomasson et al. (2020). This method has been applied to measure indicators in many fields, such as the economic policy uncertainty index Dai et al. (2021), corporate environmental responsibility index (Cai et al., 2016), financial fragility index Sensoy et al. (2014), and housing hedonic price index Zhou et al. (2008). The calculation formula is as follows:
The first step is to calculate the normalized matrix

Then, correlation coefficient matrix

By solving the eigenvalue equation (
Moreover, the standardized indicators are converted into principal components.
Results
PRH Eligibility Conditions for Urban Residents and Migrants
Income limit is a primary eligibility condition for urban residents and migrants. Different cities have set upper income limits in various ways. Here, all types of income restrictions are uniformly converted into a “real” income limit (EC01, Table 1): the ratio of the household annual income limit per capita divided by the urban household disposable income per capita (UHDI, hereafter). The UHDI statistic measures the annual average income level of urban residents in a city and is published and updated annually by China’s National Bureau of Statistics. The larger the real income limit, the more accessible the PRH is in a city. For example, Tianjin City requires applicants’ household annual income per capita to be less than 30,000 yuan, so Tianjin’s real income limit is calculated using 30,000 divided by its UHDI in the previous year. Similarly, Wuhai City requires that the annual household income per capita be no less than twice the city’s minimum standard of living (set and published annually by the government city authority). Then, the real income limit of Wuhai was obtained using twice the city’s minimum standard of living by the UHDI. A looser condition is selected when a city has more than one parallel condition regarding the income limit. Taking Beijing as an example, the city requires an annual income for three-member households no higher than 100,000 yuan (per capita 33,333 yuan) and no higher than 130,000 yuan (per capita 32,500 yuan) for four-member households; thus, 33,333 yuan is taken and calculated as a ratio using the UHDI of Beijing. The real income limit national average is 1 for urban residents, which is lower than the real income limit (1.4 for urban migrants (Tables 2 and 3), indicating that urban residents generally face a stricter income threshold than urban migrants.
Summary of PRH Eligibility Conditions for Urban Residents With Local Hukou.

Summary of PRH Eligibility Conditions for Migrants Without Local Hukou.

While all cities have restrictions on PRH applicants’ current housing conditions (EC02, Table 1), some cities are strict, allowing only households without self-owned housing to apply for PRH. In contrast, other cities are less strict, allowing homeowners with overcrowding issues, followed by an upper limit of household current living area per capita. According to our summary data, these upper limits are very close across regions and among different city tiers (15.00–16.12 square meters for urban residents, 14.20–16.78 square meters for urban migrants; Tables 2 and 3). In contrast, the percentage of cities allowing homeowners with overcrowding issues varies among different city tiers (75%−98% for urban residents, 25%−58% for urban migrants; Tables 2 and 3). That is to say, cities’ variation in current housing conditions is not mainly owing to the number of upper limits but from the difference in allowing homeowners with overcrowding issues. Therefore, we dummy the indicator EC02 here to give value 1 to cities that allow homeowners with overcrowding issues, such as Beijing City, and value 0 to cities strictly requiring no self-owned housing, such as Wuxi City, to reflect the accessibility of this eligible indicator. Approximately 94% of cities allow homeowners with overcrowding issues for urban residents, while only 46.4% of cities allow for overcrowding of migrant households.
For urban residents with local hukous, additional PRH access conditions include non-agricultural hukou status of the household head (EC03), family member hukou status (EC04), household asset restrictions (EC05), and vehicle ownership (EC06). All four indicators are set as dummy variables and given a value of 0 if a city has a restriction on that indicator and 1 if a city has no restriction on that indicator to reflect the accessibility of eligible conditions. Nationally, 81.7% of the cities require their residents to hold a non-agricultural hukou to be eligible for PRH programs (EC03 = 0). This is related to the difference in land property rights between agricultural and non-agricultural hukou in China. There were 22.2% of cities setting restrictions on the hukou status of applicants’ family members (EC04 = 0). For example, Meishan City requires the head of the household to hold a non-agricultural hukou and requires at least two family members to hold a local permanent hukous. Therefore, both eligibility indicators (EC03 and EC04) of this city have a value of 0. 24.8% of cities have asset limits for local PRH applicants (EC05 = 0). For example, Tongling City requires that total household asset values not exceed 150,000 yuan or 50,000 yuan per capita. Nanchang City requires applicants to have no commercial property. Tai’an City requires a household total asset value less than eight times the sitting tenants’ annual income per capita from the city’s PRH programs. This eligibility indicator is set as a 0/1 variable instead of numerical values owing to the complexity of asset limit criteria, as well as the difficulty of accurately verifying asset values. A total of 16.3% of the cities set restrictions on vehicle ownership for local PRH applicants (EC06 = 0). For example, Nanchang City requires that applicants have no motor vehicles (except scooters for people with disabilities). Chizhou City requires no minivans or other vehicles valued over 50,000 yuan (based on the purchase price).
For urban migrants without local hukous, additional PRH access conditions mainly include restrictions on the household head’s residence permits (EC07), stable employment (EC08), educational level (EC09), years of graduation from college (EC10), and participation in social insurance or the Housing Provident Fund (EC11). All five indicators are set as dummy variables and given a value of 0 if a city has a restriction on that indicator and 1 if a city has no restriction on that indicator to reflect the accessibility of eligible conditions. Nationally, 52.9% of cities require migrant applicants to have eligible residence permits (EC07 = 0). Cities with restrictions on the stable employment of urban migrants (EC08 = 0) is 73.9%, such as signing up in labor contracts or having worked in that city for 1 year or longer. For example, Shijiazhuang, Qinhuangdao, and Datong require applicants to sign labor contracts and work in the city for at least 1 year. Cities with restrictions on applicants’ educational level (EC09 = 0), usually junior college or above, is 28.1%. Approximately 40% of cities have requirements for applicants’ years of graduation from college (EC10 = 0), within 5 years. The indicators of EC09 and EC10 show a strong local affordable policy preference for newly graduated talent. A total of 69.3% of cities have requirements for migrant participation in social insurance or the Housing Provident Fund (EC11 = 0). The combined indicators of EC08 and EC11 represent local governments’ desire to attract a skilled labor force that contributes to the local economy. Summarily, among all additional restrictions for urban migrants, most cities emphasize legal and stable employment, participation with social insurance and housing provident funds, and years within graduation. Therefore, local governments tend to be selective by providing affordable housing for young, highly educated migrants rather than migrant workers who are elderly and work in the informal sector.
For urban residents, eastern cities have a slightly stricter real income threshold, fewer restrictions on household heads holding nonagricultural hukou, and more restrictions on household assets. Central cities have more restrictions on all additional access conditions. Western cities have the fewest restrictions on the hukou status of family members, household assets, and vehicle ownership. For migrants, eastern cities have additional restrictions, especially on stable employment, educational level, years of college graduation, and participation in the Social Insurance or Housing Provident Fund of the household head. Central cities have stricter restrictions on current housing and fewer restrictions on educational levels. Western cities have the loosest real income thresholds and current housing conditions, lower restrictions on residence permits, and no restrictions on the educational level.
For urban residents, first-tier cities set the loosest criterion in the real income threshold, most strict restrictions in current housing conditions, least additional restrictions, and have no restrictions on the hukou status of family members and household vehicle ownership. Second-tier cities have strict restrictions on current housing and less emphasis on vehicular ownership. Third- and fourth-tier cities have loose current housing conditions and emphasize vehicle ownership. For urban migrants, first-tier cities set looser criteria in real income threshold, stricter current housing conditions, more additional restrictions, and more emphasis on residence permits and participation with Social Insurance or Housing Provident Fund. Compared with fourth-tier cities, second-and third-tier cities have stricter requirements on the real income threshold and current housing conditions, more additional restrictions, and more emphasis on the educational level and years of graduation from college. Overall, first-tier cities tend to set a looser income threshold but stricter current housing conditions for urban residents and migrants than second-and third-tier cities.
The Cities’ PRH Accessibility Index
Using PCA, a negative value of PRHAI means that a city’s PRH accessibility for urban residents is low; a negative value of PRHAI-N means that a city’s PRH accessibility for migrants is low. We then ranked PRHAI and PRHAI-N among all cities in descending order (Appendix Table A1). In this way, the higher the index of a city, the fewer the requirements of its PRH eligibility, and the easier it is to access its PRH programs. Figure 2 shows the PRHAI and PRHAI-N in China’s major first -and second-tier cities (a full list of PRHAI and PRHAI-N and their rankings are attached in the Appendix). Because of the different indicators constructing the index, the values of PRHAI and PRHAI-N within a city are not directly comparable. However, we can compare their distance to the horizontal axis of 0 and their relative position among each PRHAI and PRHAI-N trend line. We also calculated PRHAI and PRHAI-N using the equally weighted method and entropy method and obtained similar rankings of PRHAI and PRHAI-N among cities.
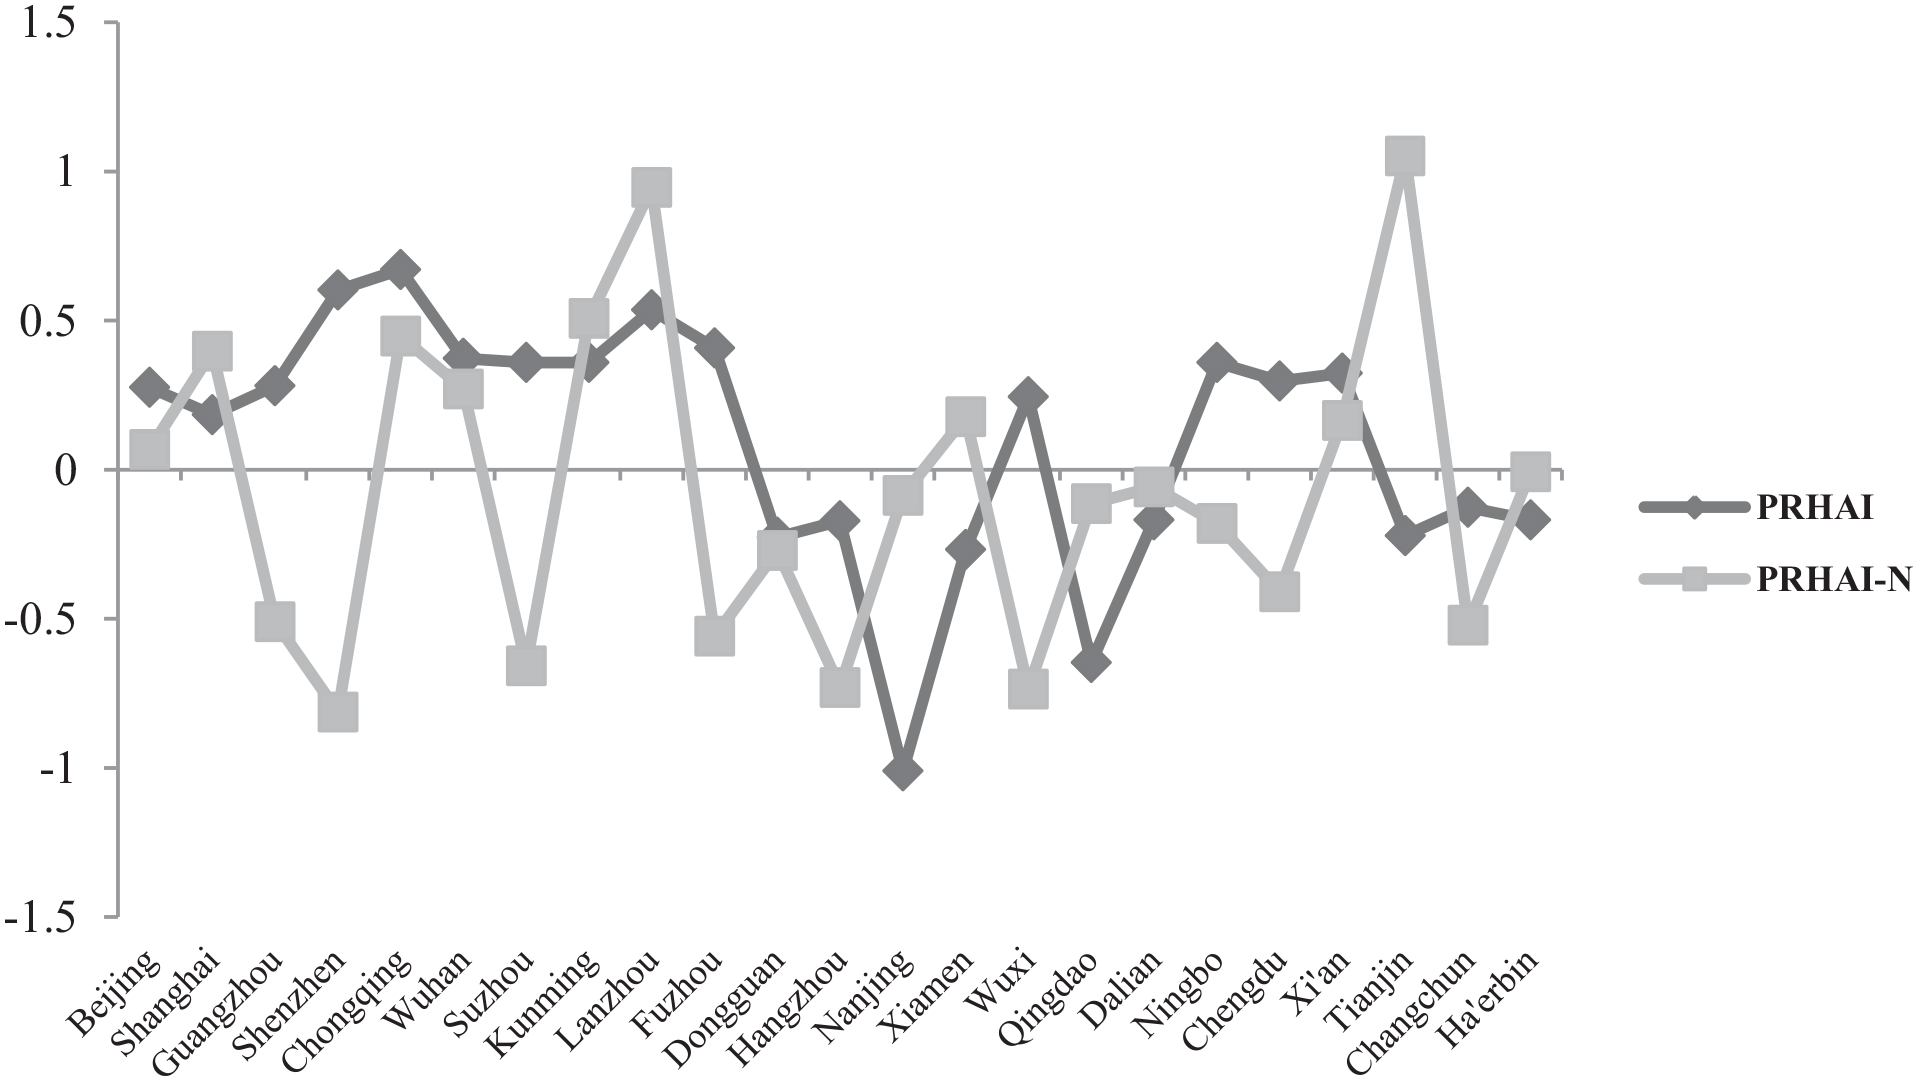
PRHAI and PRHAI-N in China’s major first-and second-tier cities.
Among the four first-tier cities, Shenzhen had a high PRHAI and the lowest PRHAI-N. Guangzhou had a medium PRHAI and low PRHAI-N. Shanghai had a medium PRHAI and high PRHAI-N. Beijing has both PRHAI and PRHAI-N media. Shenzhen provides good affordable housing accessibility for its residents but merely no affordable housing for its migrants (Shenzhen’s PRH program only targets urban residents). The other three first-tier cities provided moderate, affordable housing accessibility for urban residents. For migrants, Shanghai offers better affordable housing accessibility than Guangzhou or Beijing. Chongqing has the highest PRHAI among second-tier cities and among all 153 prefectural cities. PRHAI-N was also high. Some second-tier cities, such as Wuhan, Kunming, Lanzhou, and Xi’an, all have high levels of PRHAI and PRHAI-N, suggesting that these cities have equal priority in affordable housing provision for both urban residents and migrants. There are also some second-tier cities such as Suzhou, Fuzhou, Wuxi, and Chengdu, which tend to prioritize their affordable housing provision to urban residents, or cities such as Tianjin, which pay more attention to housing affordability for migrants. Other second-tier cities, such as Hangzhou and Changchun, have low levels of both PRHAI and PRHAI-N.
We visualized the values of PRHAI and PRHAI-N of 153 prefectural cities in a map in three categories: high, medium, and low (Figures 3 and 4). Specifically, we grouped all cities with negative PRHAI values into a low category. For cities with positive PRHAI values, we grouped the first half into the high category and the other half into the medium category. The same grouping method was used in the mapping of the PRHAI-N. As can be seen from the two maps, cities in the western and central regions have good affordable housing accessibility for urban residents and migrants. However, cities in the eastern, northeastern, and northern regions have distinctly better affordable housing accessibility for urban residents than for migrants. In contrast, cities in the southern regions have better affordable housing accessibility for migrants than residents.

Spatial distribution of PRH accessibility index for urban resident.
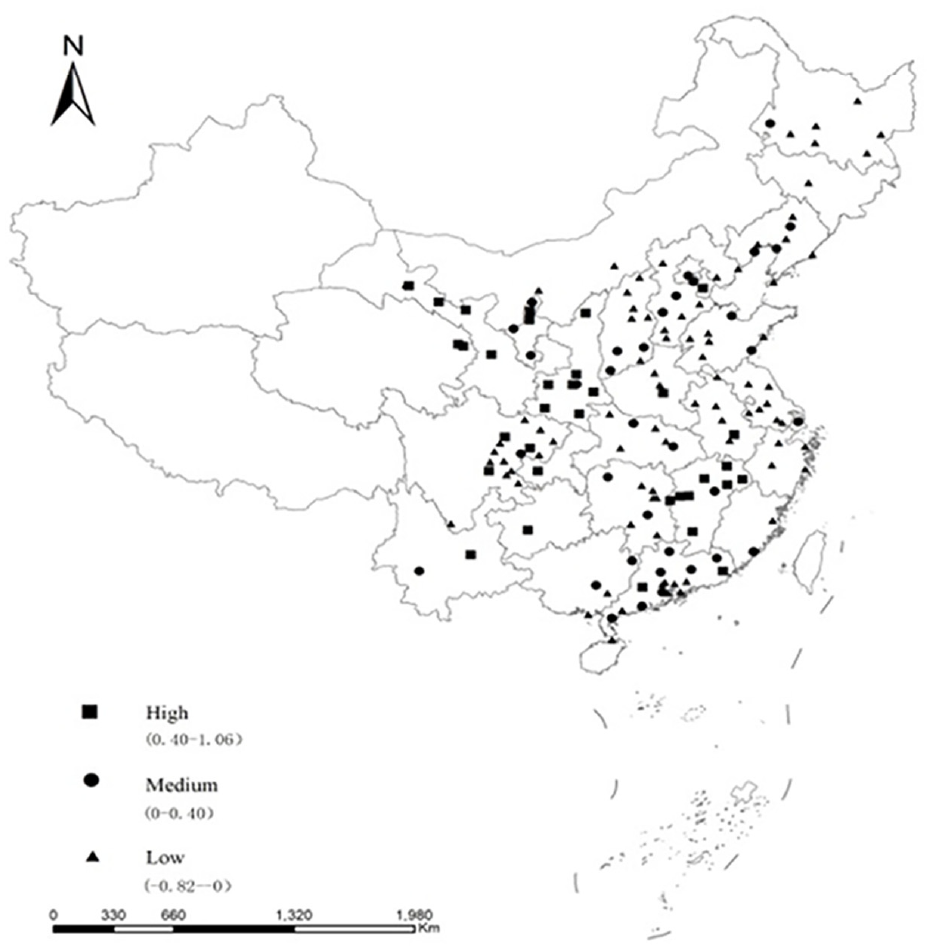
Spatial distribution of PRH accessibility index for migrants.
Robustness: Rank Correlation Test
We conducted a rank correlation test between cities’ PRH accessibility index and their proportion of local government expenditure on affordable housing in total general budgetary expenditures in 2017 (AHEP, hereafter). The AHEP directly measures how much the local government spends annually on affordable housing (PRH, CRH, and ECH). The Spearman’s and Kendall’s tau tests both showed a significant positive correlation between PRHAI and AHEP, with rank correlation coefficients of .21 and .144, respectively (Figure 5). That is to say; our constructed PRHAI reflects local governments’ affordable housing devotion to some extent. A low coefficient may result from the fact that AHEP is not a stable indicator and varies across years for a single city, as the construction of affordable housing is a long-term accumulation of local governments. Spearman’s and Kendall’s tau tests showed no significant correlation between PRHAI and AHEP (Figure 6). That is, cities with higher AHEP do not necessarily offer better affordable housing for their migrants. Summarily, the greater the government’s expense of affordable housing, the higher the accessibility. Further comparison of the accessibility of urban residents with local hukou and migrants shows that some cities guarantee local residents with hukou. Even cities with better affordable housing may not necessarily provide high accessibility for migrants, such as Shenzhen, Guangzhou, Suzhou, and Fuzhou.

Rank correlation test of PRHAI with local affordable housing expenditure share (AHEP).
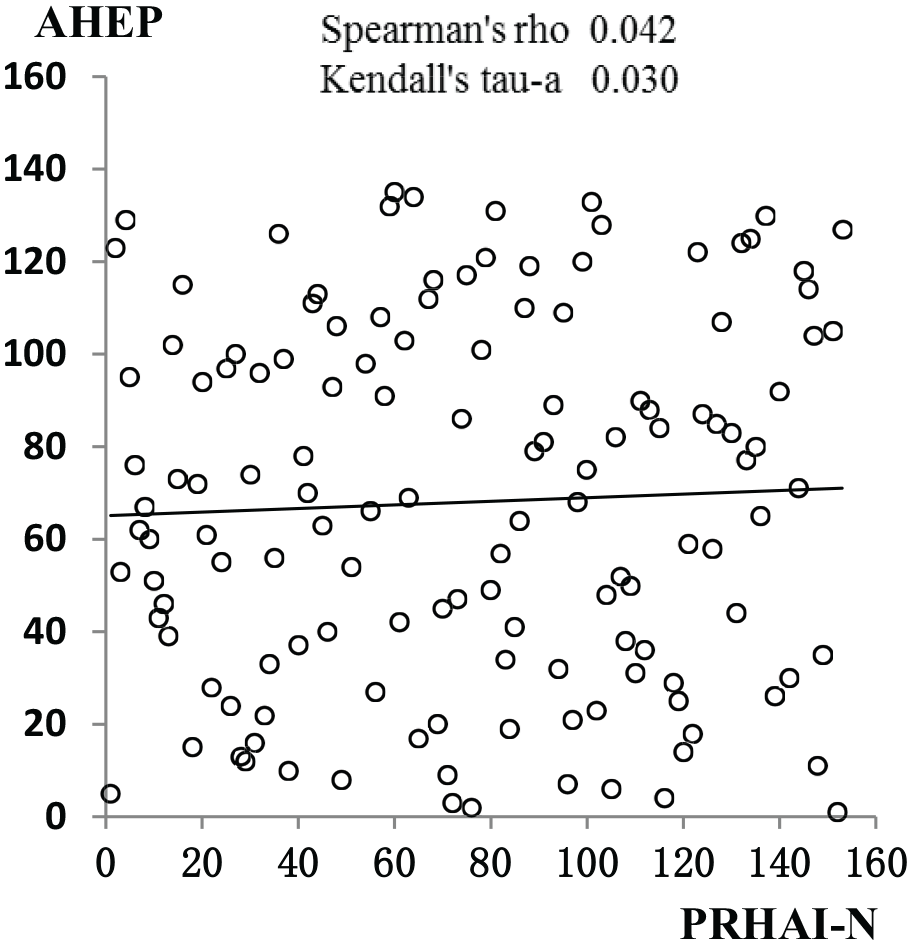
Rank correlation test of PRHAI-N with local affordable housing expenditure share (AHEP).
Factors Influencing the Accessibility of Affordable Housing
We tested the correlations between the two PRH accessibility indices and the possible influencing factors. The results are presented in Table 4. The proportion of land leasing revenue in general public budgetary revenue is used as a proxy variable to measure land finance. The greater the proportion of land leasing revenue, the stronger the local governments’ dependence on land finance. The results show that local government’s dependence on land finance is negatively correlated with PRHAI and PRHAI-N at a 10% significance level, suggesting that cities relying more on land leasing revenue tend to provide lower accessibility to affordable housing. This agrees with a previous study that found that cities with heavy dependence on land revenue may be less motivated to supply affordable housing land owing to its relatively low revenue than supplying land for commodity housing or industrial use Hu and Qian (2017), Zou (2014). Hu and Qian (2017) proposed that excessive reliance on land finance reduces local government’s enthusiasm for the construction of affordable housing. With the soaring of urban housing prices, land prices have also rise rapidly and land leasing revenue is an important supplement to the local governments’ public fiscal revenue, which has become the “second fiscal.” With the total supply of urban land is limited, the affordable housing land is supplied in the form of free allocation, which reduces the amount of land available for business use and local government’s land fiscal revenue. In that case, the more local governments depend on land finance, the less willing they are to construct affordable housing Zou (2014).
Correlation Analysis of Factors That Affect PRH Accessibility Index.

Note. Robust standard errors in parentheses.
p < .01. *p < .1.
GDP per capita and city tier are both negatively correlated with PRHAI, suggesting that more developed cities may face more demand pressure on affordable housing and thus tend to improve entry barriers. With rapid urbanization, many migrants have entered developed cities. Cities with better economic development have higher housing prices, and migrants have difficulty buying or renting houses; therefore, there is a great demand for affordable housing. However, these cities have high land prices, construction costs for affordable housing, and affordable housing demand, therefore, the urban governments endure huge financial burdens, and affordable housing is a shortage. In such cases, governments often set high barriers to access. Furthermore, PRHAI-N was not found to be significantly correlated with GDP per capita and city tier. The tertiary industry ratio was also not significantly correlated with PRHAI or PRHAI-N.
Conclusions and Implications
To quantitatively measure the cities’ bias and impact factors in public services provided from the perspective of housing security, by constructing PRHAI and PRHAI-N and ranking them among 153 prefectural cities, this study measures the level of affordable housing provision across cities and the disparity in affordable housing access within a city for urban residents with hukous and migrants without hukous. Analyzing the factors that may affect PRHAI and PRHAI-N, local governments’ dependencies on land finance and economic development are found to be significantly and negatively correlated with the level of affordable housing provision. This suggests that sufficient affordable housing supply remains a challenge in areas with better economic development or more dependence on local governments’ land leasing revenue.
In China, this bias of affordable housing services is reflected in regional disparities between urban residents with local hukous (registered residence) and migrants without local hukous. Improving the provision of affordable housing is important in establishing a long-term mechanism for the real estate market and identifying the deficiencies of affordable housing policies, and alleviating homelessness, poverty, and inequality. Based on the quantitative analysis results, we propose the following implications:
It is suggested that the central government establish and complete public services providing evaluation and accountability systems, scientifically evaluate the level of public services equity, optimize the implementation of policies of public services equity, and continuously improve public satisfaction. Meanwhile, part of the legislative tax power shall be delegated to local governments, and the local tax system shall be gradually improved to ensure that local governments could have more tax resources and steady fiscal revenue to offer proper public services to local residents. The results show that the more serious the dependence on land finance, the lower is the housing security level. The root cause for local governments hindering the affordable housing construction owing to land finance lies in the current fiscal and taxation system. This problem is difficult to solve in the short term. However, it can be improved by restructuring the local government incentive mechanism instead of using GDP growth as the only evaluation criterion for officials’ promotions. Additionally, local governments have expanded the coverage of affordable housing for migrants to ease the existing inequality of access to affordable housing between urban residents and migrants. More indicators such as affordable housing allocation rules, operations, residential satisfaction, and exit mechanisms can be considered in evaluating affordable housing provision by local governments.
Footnotes
Appendix
PRH Accessibility Index in 153 Cities.

| City | PRHAI | City rank of PRHAI | PRHAI-N | City rank of PRHAI-N |
|---|---|---|---|---|
| Chongqing | 0.671083 | 1 | 0.447659 | 32 |
| Yichun | 0.623338 | 2 | 0.948474 | 7 |
| Shenzhen | 0.602445 | 3 | −0.813479 | 152 |
| Hanzhong | 0.570431 | 4 | 0.847697 | 9 |
| Xining | 0.570431 | 5 | 0.646954 | 18 |
| Lanzhou | 0.535159 | 6 | 0.946424 | 8 |
| Cangzhou | 0.44698 | 7 | −0.071597 | 75 |
| Wuzhong | 0.44698 | 8 | 0.447659 | 29 |
| Baoding | 0.425817 | 9 | 0.226225 | 50 |
| Fuzhou | 0.408182 | 10 | −0.558735 | 134 |
| Shangrao | 0.399364 | 11 | 0.530967 | 22 |
| Lincang | 0.388911 | 12 | 0.228334 | 49 |
| Mianyang | 0.386334 | 13 | 0.788314 | 14 |
| Wuhan | 0.37291 | 14 | 0.270985 | 45 |
| Anshan | 0.358802 | 15 | −0.33685 | 110 |
| Guyuan | 0.358802 | 16 | 0.081227 | 65 |
| Handan | 0.358802 | 17 | −0.463893 | 124 |
| Hezhou | 0.358802 | 18 | 0.186167 | 56 |
| Jinchang | 0.358802 | 19 | 1.00118 | 3 |
| Jiuquan | 0.358802 | 20 | 0.520454 | 23 |
| Kunming | 0.358802 | 21 | 0.506721 | 24 |
| Ningbo | 0.358802 | 22 | −0.180265 | 91 |
| Shijiazhuang | 0.358802 | 23 | 0.186167 | 57 |
| Suzhou | 0.358802 | 24 | −0.657403 | 138 |
| Taiyuan | 0.358802 | 25 | −0.180265 | 92 |
| Tieling | 0.358802 | 26 | −0.638911 | 137 |
| Xuchang | 0.358802 | 27 | −0.180265 | 93 |
| Yulin | 0.358802 | 28 | 0.841008 | 10 |
| Zhangjiajie | 0.358802 | 29 | 0.345436 | 40 |
| Xinzhou | 0.349984 | 30 | −0.713333 | 143 |
| Yuncheng | 0.34822 | 31 | 0.184623 | 58 |
| Huludao | 0.341166 | 32 | 0.215084 | 54 |
| Datong | 0.337638 | 33 | −0.425884 | 116 |
| Luzhou | 0.335753 | 34 | −0.038584 | 73 |
| Daqing | 0.332348 | 35 | −0.602646 | 136 |
| Dandong | 0.332348 | 36 | −0.429046 | 117 |
| Hegang | 0.332348 | 37 | −0.073815 | 76 |
| Jinzhou | 0.332348 | 38 | −0.073815 | 77 |
| Xingtai | 0.325422 | 39 | −0.095932 | 83 |
| Deyang | 0.323544 | 40 | −0.322212 | 107 |
| Bazhong | 0.32353 | 41 | −0.271553 | 102 |
| Haidong | 0.32353 | 42 | 0.680628 | 17 |
| Shangluo | 0.32353 | 43 | 0.819924 | 11 |
| Shizuishan | 0.32353 | 44 | 0.215743 | 52 |
| Suizhou | 0.32353 | 45 | −0.434317 | 119 |
| Suining | 0.32353 | 46 | 0.378508 | 38 |
| Taizhou | 0.32353 | 47 | −0.678487 | 139 |
| Tongchuan | 0.32353 | 48 | 0.447659 | 28 |
| Xi’an | 0.32353 | 49 | 0.165084 | 61 |
| Xuzhou | 0.32353 | 50 | −0.339441 | 111 |
| Yingkou | 0.32353 | 51 | 0.215743 | 53 |
| Neijiang | 0.320241 | 52 | −0.271553 | 104 |
| Nanchong | 0.318466 | 53 | 0.401781 | 34 |
| Foshan | 0.318368 | 54 | −0.143339 | 88 |
| Guigang | 0.318368 | 55 | 0.117016 | 63 |
| Zhangye | 0.318368 | 56 | 0.447659 | 31 |
| Ziyang | 0.314712 | 57 | −0.322212 | 109 |
| Hefei | 0.311185 | 58 | −0.736525 | 147 |
| Yulin | 0.307658 | 59 | −0.563615 | 135 |
| Zhenjiang | 0.30413 | 60 | −0.740742 | 149 |
| Wuhai | 0.302367 | 61 | −0.497626 | 130 |
| Zhangjiakou | 0.297204 | 62 | −0.10533 | 84 |
| Ankang | 0.297076 | 63 | 0.804112 | 13 |
| Chengdu | 0.296992 | 64 | −0.409152 | 113 |
| Shuozhou | 0.290163 | 65 | −0.413234 | 115 |
| Huizhou | 0.288258 | 66 | −0.25306 | 101 |
| Jinan | 0.288258 | 67 | −0.202401 | 95 |
| Yangjiang | 0.288258 | 68 | 0.07963 | 66 |
| Yunfu | 0.288258 | 69 | 0.72969 | 16 |
| Xianyang | 0.283096 | 70 | 0.819924 | 12 |
| Guangzhou | 0.281204 | 71 | −0.510276 | 131 |
| Yinchuan | 0.281204 | 72 | 0.447659 | 30 |
| Zhanjiang | 0.281204 | 73 | 0.121292 | 62 |
| Beijing | 0.275913 | 74 | 0.067494 | 67 |
| Linfen | 0.274278 | 75 | 0.210472 | 55 |
| Shiyan | 0.260169 | 76 | −0.018858 | 71 |
| Hohhot | 0.251364 | 77 | −0.487085 | 128 |
| Meizhou | 0.247824 | 78 | 0.378508 | 36 |
| Wuxi | 0.24431 | 79 | −0.735471 | 146 |
| Xiangyang | 0.223006 | 80 | 0.31321 | 43 |
| Shanghai | 0.183887 | 81 | 0.397 | 35 |
| Yingtan | 0.150653 | 82 | 0.625871 | 19 |
| Fuzhou | 0.095708 | 83 | 0.344292 | 41 |
| Xinyu | 0.063964 | 84 | 0.608945 | 21 |
| Pingxiang | 0.062474 | 85 | 0.999133 | 4 |
| Qinhuangdao | −0.006165 | 86 | −0.360526 | 112 |
| Changsha | −0.025705 | 87 | −0.708063 | 141 |
| Jieyang | −0.025705 | 88 | 0.451303 | 27 |
| Leshan | −0.029598 | 89 | 0.467468 | 26 |
| Meishan | −0.029973 | 90 | −0.251968 | 100 |
| Changzhi | −0.036287 | 91 | 0.256226 | 46 |
| Jixi | −0.052159 | 92 | −0.159152 | 90 |
| Qiqihar | −0.052159 | 93 | 0.221014 | 51 |
| Panzhihua | −0.060376 | 94 | −0.271553 | 105 |
| Yangquan | −0.060977 | 95 | −0.113764 | 86 |
| Dazhou | −0.061009 | 96 | −0.434337 | 120 |
| Jincheng | −0.066139 | 97 | −0.463893 | 125 |
| Fuyang | −0.078613 | 98 | −0.739688 | 148 |
| Yongzhou | −0.078613 | 99 | −0.218912 | 97 |
| Langfang | −0.08065 | 100 | 0.238875 | 48 |
| Shaoguan | −0.08065 | 101 | 0.328993 | 42 |
| Chenzhou | −0.096248 | 102 | −0.750229 | 150 |
| Tangshan | -0.096248 | 103 | -0.813479 | 153 |
| Zhuzhou | −0.096248 | 104 | −0.222432 | 98 |
| Beihai | −0.101813 | 105 | −0.322212 | 106 |
| Maoming | −0.113884 | 106 | −0.533045 | 133 |
| Yiyang | −0.113884 | 107 | −0.710112 | 142 |
| Xiaogan | −0.124466 | 108 | −0.239298 | 99 |
| Changchun | −0.126362 | 109 | −0.521839 | 132 |
| Yancheng | −0.152554 | 110 | −0.476089 | 126 |
| Mudanjiang | −0.165028 | 111 | −0.496513 | 129 |
| Dalian | −0.168829 | 112 | −0.058002 | 74 |
| Harbin | −0.168829 | 113 | −0.007343 | 70 |
| Hengyang | −0.168829 | 114 | 0.243656 | 47 |
| Xiangtan | −0.168829 | 115 | −0.411185 | 114 |
| Hangzhou | −0.171813 | 116 | −0.7302 | 145 |
| Tai’an | −0.195283 | 117 | −0.479706 | 127 |
| Jiangmen | −0.200573 | 118 | 0.098041 | 64 |
| Baoji | −0.201596 | 119 | 0.417983 | 33 |
| Tianjin | −0.221736 | 120 | 1.05184 | 2 |
| Dongguan | −0.226899 | 121 | −0.271553 | 103 |
| Haikou | −0.232318 | 122 | −0.451184 | 122 |
| Zhongshan | −0.26217 | 123 | −0.089627 | 81 |
| Xiamen | −0.267589 | 124 | 0.177793 | 59 |
| Shenyang | −0.443745 | 125 | 0.30794 | 44 |
| Guangyuan | −0.458065 | 126 | −0.202401 | 94 |
| Jining | −0.470199 | 127 | −0.750229 | 151 |
| Zigong | −0.470199 | 128 | −0.038584 | 72 |
| Dongying | −0.475361 | 129 | 0.011149 | 68 |
| Jiayuguan | −0.544 | 130 | −0.322212 | 108 |
| Huainan | −0.553087 | 131 | −0.105358 | 85 |
| Taizhou | −0.623879 | 132 | −0.455401 | 123 |
| Zhengzhou | −0.6289 | 133 | −0.443864 | 121 |
| Hengshui | −0.634332 | 134 | −0.153852 | 89 |
| Qingdao | −0.646805 | 135 | −0.113873 | 87 |
| Jingdezhen | −0.698021 | 136 | 0.948474 | 5 |
| Suihua | −0.845887 | 137 | −0.21457 | 96 |
| Ganzhou | −0.86027 | 138 | 0.618522 | 20 |
| Jinhua | −0.872341 | 139 | −0.079086 | 79 |
| Luohe | −0.882923 | 140 | 0.482504 | 25 |
| Yichang | −0.962557 | 141 | −0.09268 | 82 |
| Zhongwei | −0.974774 | 142 | 0.378508 | 39 |
| Guang’an | −0.980221 | 143 | −0.429677 | 118 |
| Rizhao | −1.00299 | 144 | 0.011149 | 69 |
| Nanjing | −1.01017 | 145 | −0.086465 | 80 |
| Qingyuan | −1.01547 | 146 | 0.378508 | 37 |
| Huaian | −1.0171 | 147 | −0.716496 | 144 |
| Chizhou | −1.0331 | 148 | −0.681077 | 140 |
| Tongling | −1.03826 | 149 | 0.769265 | 15 |
| Heyuan | −1.04355 | 150 | 0.166702 | 60 |
| Anshun | −1.05237 | 151 | 1.05184 | 1 |
| Nanchang | −1.08253 | 152 | 0.948474 | 6 |
| Liaocheng | −1.42101 | 153 | −0.078031 | 78 |
Note. This research was conducted while Ding Li was at Institute of Development Studies, Southwestern University of Finance and Economics. They are now at School of Public Administration, Southwestern University of Finance and Economics and may be contacted at
Acknowledgements
The authors wish to gratefully acknowledge the editors and reviewers for their valuable comments and suggestions that improved the manuscript. In addition, we would like to thank everyone that participated in the research process for the invaluable information they shared with us.
Declaration of Conflicting Interests
The author(s) declared no potential conflicts of interest with respect to the research, authorship, and/or publication of this article.
Funding
The author(s) disclosed receipt of the following financial support for the research, authorship, and/or publication of this article: This work was supported by the Research Center of Scientific Finance and Entrepreneurial Finance of Ministry of Education of Sichuan Province (No. KJJR2021-004).