
Abstract
Scholars are polarized on the issue of the best approach for measuring housing affordability. This has generated a lack of consensus on the best method to adopt in measuring the concept. Consequently, this study is set-out to extend the literature on housing affordability by examining the public housing affordability for each income group in Nigeria using Abuja as a case study city. This study is aimed at providing the contextual framework for the redefinition of housing affordability based on the diversity of income. The housing cost approach was used to measure housing affordability, whereas the principal component analysis determined factors that caused the unaffordable housing market. The results showed that public housing was not affordable to low and medium-income earners. The unaffordable housing market for each of the three income groups was influenced by diverse factors. Consequently, public housing provision should consider the affordability of each income group. This is because factors that determine housing affordability are peculiar to each of the three income groups.
Introduction
The idea of housing affordability began in the 1930s in the United States of America as a measure to alleviate the housing hardship caused by the Great Depression. This led the USA congress to pass the “US Housing Act” in 1937 to address the housing challenges of the low-income group through public housing (Bhatta, 2010). “Housing affordability became widespread in the 1980s in Europe and North America” (Bourassa, 1996, p. 4). Since then housing affordability has become a major challenge facing many cities across the globe. The challenge has been aggravated in the past decades by the phenomenal growth in the world urban population. Consequently, there are over 7 billion people that live in cities in both developed and developing economies. Besides, the number of cities with a population of 1 million inhabitants has grown to more than 500. Also, many cities across the globe have transformed from megacities to megalopolitan city regions with a population of more than 60 million residents (Bhatta, 2010). The consequent effect of the rapid growth in the urban population is the need for affordable housing which has become problematic in most cities of the world. This problematic situation is because many low and medium-income urban households do not have access to decent and affordable housing, thus resulting in a housing crisis of high proportion (Bridge & Watson, 2011).
The housing affordability challenge adversely strains the family budget and constrains the availability of resources for other household needs such as education, health, transportation, and feeding. It places some households in danger of not having the ability to maintain their occupancy, thereby giving rise to an increased possibility of homelessness. Also, it portends adverse negative impacts on the overall health and wellness of the city inhabitants. The high cost of renting houses is the major reason people choose to live in slums and squatter developments in most cities (Ashkin, 2013).
In the past three decades, decent and safe housing has remained a dream for the majority of the cities of the developing countries. The situation in capital cities although assumed to be more problematic, yet government considers affordable housing as merely a social burden (Ndubueze, 2009). In Nigeria, the provision of affordable housing that is safe, secure and accessible in relation to income is a fundamental human right (National Housing Policy, 2012). However, housing is expensive and hardly affordable for the majority of urban low and medium-income earners (Ashkin, 2013). Consequently, they have fewer choices of a place of residence, resulting in increasing numbers of slum and slumber settlements.
Myriad of policy instruments have been formulated by the national governments across the globe to respond to the challenges posed by housing affordability at various levels of governance. These policies range from “stop-gap financing tools to intergovernmental infrastructure changes” (Hulchanski, 2006, p. 5). In Nigeria for instance, the housing policy focused on direct provision of public housing for the various income groups which were later sold to workers on an owner-occupier basis. However, the houses were sold at very high prices which were beyond the affordability of medium and low-income earners.
The measurement of housing affordability is a very complex exercise among nations. The housing cost-to-income ratio approach, otherwise known as the rule-of-thumb or traditional/conventional ratios that are commonly used in most countries has been called to question (Stone, 2006b). However, the commonly applied standard of measuring housing affordability using the rule-of-thumb in most countries such as the USA, Australia, and Canada indicates that “housing is deemed appropriate and affordable when households spend less than 30%” of their gross “income on housing cost.” Some other countries like India adopted a 40% gross income standard (Hulchanski, 1995).
There is a diversity of views on the best approach to measure housing affordability among scholars. Some studies (Bramley, 2012; Chen et al., 2006; Napoli et al., 2016; Newman & Holupka, 2015; Vizek, 2009) have argued in favor of the traditional rule-of-thumb approach, describing it as the best single approach to measure housing affordability. Other studies (Aryeetey-Attoh, 1989; Jawkes & Delgadillo, 2010; McConnell, 2012; Stone, 2006a, 2006b) have challenged the approach on the ground that it is logically unsound and misleading. This indicates a lack of consensus among scholars on the best approach for measuring housing affordability. Consequently, this study is set-out to building a knowledge system for enhancing measures toward an appropriate assessment of housing affordability.
The aim of this study, therefore, is to measure public housing affordability and determine factors that account for the unaffordable housing market for the various income groups in Nigeria’s new-town capital, Abuja. Also, this study will answer the following two research questions: first, how affordable are public housing among the diverse income groups? Second, what are the determinants of the unaffordable public housing market for the diverse income groups? The answers to these questions will be useful to policymakers in developing a framework for the redefinition of housing affordability based on income diversity. It will also provide a contextual base for considering housing affordability issues across diverse income groups. The contextual base will facilitate the building of a peculiar system of knowledge to aid the formulation of appropriate policy on housing affordability.
Literature Review
Housing affordability has remained ill-defined and a contested concept despite its popularity. Whitehead (1991) defined housing affordability based on the commonly applied housing cost-to-income ratio standard of measurement. According to him “housing affordability is the household’s ability to meet housing costs without imposing excessive constraints on non-housing consumption” (p. 4). Similarly, Hancock (1993) defined affordable housing “as the opportunity cost between housing and non-housing consumption” (p. 3). Also, Gopalan and Venkataraman (2015) definition of housing affordability aligned with the views of Whitehead (1991) and Hancock (1993). They defined the concept “as any housing that meets some form of affordability criterion, which could be income level of the family, size of the dwelling unit or affordability in terms of the ratio of house price to annual income” (p. 7). They opined that “the metrics vary depending on whether households consume housing as renters or purchase housing as an investment and consumption good” (p. 7). However, Linneman and Megbolugbe (1992) doubted the concept of housing affordability as postulated by Whitehead (1991), Hancock (1993), and Gopalan and Venkataraman (2015). They argued that housing affordability is a myth “manufactured by middle class and efficient young people with ever-growing expectations” (p. 5). They opined that “much of the perceived affordability crises simply reflect changes in tastes for housing amenities and unrealistic expectations for housing price appreciation” (p. 5). Hulchanski (1995) supported the view of Linneman and Megbolugbe (1992) by questioning affordability as a concept of analyzing housing problems and as a definition of housing needs. He argued that the concept failed to bring intellectual organization and understanding to housing research. He advised scholars against using the term “housing affordability.” In the same vein, Sendi (2014) questioned the affordability concept. He argued that housing affordability does not necessarily guarantee housing accessibility for all. Rather access to adequate housing can be assured for all through the shifting of emphasis from housing affordability to housing accessibility. The apparent turbulence in the conceptualization of housing affordability may have accounted for polarization on the best approach to measure the concept.
There are polarizations among scholars on the best measure of housing affordability. Many scholars have argued in favor of the most common use standard for measuring housing affordability which is the housing costs-to-income ratio approach, otherwise known as the rule-of-thumb or the traditional ratios. Chen et al. (2006) applied the housing cost-to-income ratios rule in assessing the housing affordability in Shanghai, China. They found that “low-income households will never have access to affordable housing, whereas only low percentile of the medium can have access to affordable housing (p. 10). Besides, the high-income groups which constitute 20% of the household population have access to affordable housing.” This implies that “a large majority of households in Shanghai do not have access to affordable housing” (p. 10). They argued that the conventional ratio approach remains the best measure of housing affordability. Similarly, Bramley (2012) used the traditional housing cost-to-income ratio at a 25% standard to measure housing affordability in Britain. He found that “housing affordability challenges affected 2.6% of all households with pronounced variation between owner-occupation (1.2%) and private renting (7.9%)” (p. 9). The geographical variation of housing affordability was less pronounced than was the case between household types and aged groups. He opined that “the use of the traditional ratios is still probably the best objective measure of housing affordability” (p. 9). The results of Napoli et al. (2016) analysis of housing affordability in Calabria, Italy using the income threshold approach showed similar empirical evidence with the works of Chen et al. (2006) and Bramley (2012). The study found that “15.3% of low-income households cannot access affordable housing whereas the 15.6% of medium-income households can afford housing at a minimum price” (p. 8). Also, the study found that “best houses located in the central and historical areas can only be afforded by the 22% of high-income households” (p. 8). They opined that “the application of income threshold approach enables the policymakers to adequately evaluate the gap between the income of households and housing cost to design policies that will minimize housing affordability challenges” (p. 9). Interestingly, Herbert et al. (2018) measurement of housing affordability based on the 30% of income standard in the United States of America showed a small deviation from the previous studies. They found that the approach “exaggerates housing affordability challenges for high-cost markets and higher-income and smaller households but yields similar results regarding overall levels of affordability” (p. 7). However, the method remains a dependable measure of housing affordability in the long-run and across income groups due to its simplicity. The study suggests that “caution should be taken in using this measure to assess housing affordability challenges among income levels or household types as variation in the cost of other necessities would indicate the need for corresponding variations in the payment standard” (p. 8). In the same vein, Corrigan et al. (2019) examined the appropriateness of the strict application of 30%/40% of income rule in measuring housing affordability in Ireland. They found that “applying the 30-percent of housing cost-to-income rule is reasonable because it ensures housing affordability for the majority of the households” (p. 6). On the other hand, “the 40-percent will exclude some households with low levels of residual income from affordable housing.” They opined that “income, not just the housing cost-to-income ratios is the main determinant of housing affordability challenges” (p. 7). The outcome of this study suggests that the conventional ratio approach is the simplest and best measure of housing affordability.
On the other hand, several studies have argued against the use of ratios standards (rule-of-thumb) in measuring housing affordability on the ground that the approach is misleading and logically unsound. Aryeetey-Attoh (1989) applied the residual income approach to measure housing affordability in Brazil in order to provide evidence against the use of the rule-of-thumb standard. He found that “the mean affordability for urban Rio was 64%, with slightly lower percentages for the low (5.6 m%) and moderate-income regions (6.2%). It was a slightly higher share for residents in the upper-income regions (7%)” (p. 8). He revealed that “the outcome of this study is quite low compared with estimates with the rule-of-thumb approach from other studies.” He argued that “the traditional enshrined rules-of-thumb approach is inadequate for some geographic subgroups located in different regions of a city” (p. 8). This is because “using a single percentage income to measure housing affordability does not correspond to the real existence of basic and obvious variations among households spatially dispersed in urban space” (p. 9). He favored of residual income approach on the ground that it provides the best estimate of housing affordability. Similarly, Stone (2006b) used the residual income approach to measure housing affordability in the United States of America. He found that “small households have lower rates of shelter poverty than conventionally measured affordability problems” (p. 6). On the other hand, “the larger households have considerably higher rates of shelter poverty than conventionally measured affordability problems” (p. 6). The difference by household size is anticipated for any measure of residual income approach because non-housing expenses tend to increase with household size. He argued that “the conventional ratio concept (rule of thumb) is logically unsound and misleading” (p. 7). Rather a more realistic measurement of affordability can be developed from understanding the special attributes of housing costs which shows the interaction among incomes, housing costs, and the costs of non-housing necessities. He opined that the residual income approach is the best measure because it does not produce a simple rule of thumb rates. Instead, it recognizes that affordability is responsive to differences in household composition and income. Stone (2006a) also argued in support of the residual income approach in housing affordability measurement. He found that “larger and lower-income households in the United Kingdom can afford rather less for housing than is implied by the conventional ratio standard, whilst smaller and higher-income households can afford rather more” (p. 9). He opined that “the only reason people continue to adhere to the rule-of-thumb approach is that it is a well-established approach which can be applied to specific policies” (p. 9). In the same vein, Jawkes and Delgadillo (2010) examined the three commonly used housing affordability indices in the United States of America. They found that the residual income approach, based on whether the remaining households’ income after housing expenses is enough to meet their non-housing needs, is a more appropriate measure of housing affordability. They opined that large households under the same 30% affordable ratio of “housing costs-to-income” with a small household will spend more on non-housing necessities than a small household. This is an indication that small household will afford to “spend more on housing than” large households with the same income level. This is because the non-housing expenditure of small households is likely less than in large households. Consequently, a smaller household can devote a higher portion of its income to housing than a large household. They argued that the advantage of the residual income approach over the rule-of-thumb approach is predicated on its “ability to consider the household size” and geographical locations in the measurement of housing affordability. McConnell (2012) examined the appropriateness of the residual income approach in measuring housing affordability in Los Angeles, the United States of America. He found that lower-income households spend a small amount of their income on housing costs and have very “limited resources to spend on” non-housing necessities. More than 40% of the households experienced a poverty standard of living after the housing costs. This indicates a high level of housing affordability challenges among the city’s residents. Also, extended living arrangements oftentimes reflect difficulties in affordable housing expenses. Furthermore, households with one income earner are more susceptible to housing affordability challenges than households with two income earners. The study opined that the residual approach yielded better results than those based on the rule-of-thumb standard.
Some studies have argued in favor of new affordability measurement approaches. Kutty (2005) used the concept of housing-induced poverty to measure housing affordability in the United States of America. He found that 3.8 million households could not afford non-housing goods after meeting the housing costs. The housing affordability problem was 2.7% higher than the official threshold. Moreover, the study found that housing subsidy meaningfully reduces the likelihood that near-poor households will experience housing induced poverty. Robinson et al. (2006) argued for a middle ground between shelter first (rule-of-thumb) and non-shelter first (residual) approaches on the ground that no single approach can give a clear picture of housing affordability. They found, using the shelter first approach that 22% of households spend 30% of their gross income on housing cost, whereas this figure is 34% for low-income households. On the other hand, the residual income approach indicates that the proportion of households living below the living allowance rose rapidly in 1994 before leveling off at a level lower than the earlier peak. The results of the two approaches show clear evidence of housing affordability challenges in New Zealand. They opined that there is a need to consider more than one approach in measuring affordability at both aggregate and disaggregate levels. This is because the variations between each approach could reveal the hidden and significant elements of housing affordability. Gan and Hill (2008) developed a new affordability measure from the value-at-risk concept. They found that housing affordability indexes in Sydney, Australia were positive whereas it indicated negative for Houston, USA. The implication is that an average household has more access to affordable housing in Houston than in Sydney. This is because a high level of immigration, tough zoning restrictions, and geographical constraints has made Sydney one of the most unaffordable housing markets in the world. The study opined that the housing affordability challenge is worse than suggested by standard median measures.
The argument presented by various studies indicates that the turbulence on the issue of the best approach for the measurement of housing affordability stemmed out of diversity and incompatibility in the definitions of the concept. This study will extend housing affordability literature by measuring housing affordability and its determinant factors for the large income diversity groups in Abuja.
The Case Study City
Abuja is a new town and the capital city of Nigeria. It is located in the north-central part of the country and lies between latitudes 8.28° and 9.20° north of the equator and longitudes 6. 45° and 7.39° east of the Greenwich Meridian. It currently occupies 250 square kilometers out of 800 km2 of landmass designated as the Federal Capital Territory. The city has a hot humid climatic condition and lies within the savanna vegetation belt.
The idea of Abuja as a new Federal capital city for Nigeria was mooted in 1970 immediately after the Nigerian civil war. This was a result of severe traffic congestion, housing shortages, environmental pollution, overstretched infrastructure, insecurity, and poor living conditions in Lagos, which doubled as the capital and commercial nerve center of Nigeria. The federal government issued decree number 6 of 1976 establishing Abuja as the new capital of Nigeria. This led to massive infrastructural development based on the city’s master plan (Abubakar, 2014).
The seat of government was officially moved from Lagos to Abuja in 1991. The city comprises six area councils namely: Abaji, Amac, Bwari, Gwagwalada, Kuje, and Kwali. It has been a very fast-growing city. The phenomenal growth is largely due to its position as the federal capital territory. The 2006 national population census put the city’s population at 1,405,201 people. This figure comprises 740,889 males and 664,712 females (The Federal Republic of Nigeria, 2007).
The concept of the Abuja master plan is based on the principle of a functional city with a crescent-shaped structure, occupying a prominent position in the northeast quadrant of the capital territory. The master plan has four phases with the incremental planning model being the foundation for implementation (International Planning Associates, 1979). The first phase of the master plan which has been completed consists of several residential districts which include Asokoro, Wuse I, Wuse II, Garrki I, Garrki 2, Maitama, and the Central area (see Figure 1). Abuja has been described as the wealthiest, fastest-growing, the most expensive, and best-purpose built city in Africa (Abubakar, 2014).

The city of Abuja phases 1 to 4.
The public housing in Abuja consists of apartments, and bungalows located in Wuse, Garki and Mabushi districts which were built in the 1980s and 1990s. They are known as Shagari low-cost housing estates, prototype housing program, public-private partnership housing program, among others. This was targeted at providing accommodation to the various cadres of civil servants (Ndubueze, 2009).
The Federal Government of Nigeria, in consonance with its monetization policy later ordered the sale of all its Abuja residential buildings in 2005 at competitive rates and tenors. Under this policy, every civil servant in the federal civil service was to provide for their accommodation but will be paid between 50% and 70% of annual basic salary, depending on grade level, as an accommodation allowance (Ademiluyi, 2010; Ndubueze, 2009). Consequently, the public housing estates that provided accommodation to more than 25% of civil servants at subsidized rates were sold by public auction to the highest bidder. The government argued that such a policy represents a more efficient allocation of resources and equity in the provision of amenities for public officers. However, the policy corresponds to substituting direct housing supply subsidy with a pro-market oriented housing demand subsidy.
The impact of the policy was that public houses were sold at current market rates which made them unaffordable to the civil servants who occupied them before the monetization policy. This forced them to look for substandard accommodation in less desirable locations in the surrounding States. Others who rented the buildings from the buyers pay as much as 80% of their income on rent. Three diverse income groups namely low, medium and high incomes are distinct and discernable in the city. Their distinction was based on the equivalent of salary grade levels of 01 to 06 (low income), 07 to 12 (medium income), and 13–17(high income) in Government employment. The composition of population income shows low-income, medium-income, and high-income groups constitute 50%, 40%, and 10% of the population, respectively. This indicates that about 90% of the city residents’ fall within low and medium-income groups.
Abuja is chosen as a case study area because as a new town and the capital city of Nigeria it pioneered the application of housing affordability program in the country. The issues of rapid urban growth, housing shortages and inclusiveness that impact affordability are outstanding in the city. In addition, the city pioneered the monetization policy that launched housing affordability awareness in Nigeria, and the 16 years’ timeframe of its application positions the city as the most appropriate for a planning study.
Conceptual Framework
Methods of Measuring Housing Affordability
Affordable housing is broadly defined “as that which is adequate in quality and location and does not cost so much that it prohibits its occupants meeting other basic living costs or threatens their enjoyment of basic human rights” (UN-HABITAT, 2011). The conceptualization and measurement of housing affordability have been the topic of debate among housing researchers over the past few years. Generally, measurement of housing affordability usually examines the association between housing costs and earnings, that is, the extent of family income that is taking up by the costs of housing as well as whether there is an adequate amount left over to live on once rents and mortgages are paid (Whitehead et al., 2009). The affordability measures were classified into two broad groups termed “shelter first” (Ratio/Housing Cost Approach) and “non-shelter first” (Residual Approach) measures (Robinson et al., 2006).
Housing cost approach
The shelter first approach (i.e., housing cost approach) assumes that housing is the priority on the household budget, and other expenditures are met from the remainder. It conceives housing affordability as the measure of the ratio between households’ expenditure on housing and their income. This is a “rule of thumb” standard for measuring housing affordability. It indicates that not more than 25% (or sometimes 30%) of household monthly income expenditure on housing is deemed appropriate and affordable (Whitehead et al., 2009). The housing cost approach consists of two components namely house price-to-income ratio and house rent-to-income ratio.
House Price-to-Income Ratio: It refers to the number of annual median earnings required to purchase a medium-priced house. The ratio is determined by dividing the price of a medium-size house by the income of a medium household (Aboutorabi & Abdelhalim, 2000; Stone, 2006b). This method allows for identification of the ratio of income that households should not exceed when purchasing a house of adequate size and quality (Whitehead et al., 2009).
House Rent-to-Income Ratio: This approach presupposes that affordable rental-housing should not cost more than a certain percentage (usually about 25%–30%) of a household’s monthly income (Mulliner & Maliene, 2012). It is the most widely accepted approach of all housing affordability indicators. Despite its apparent simplicity and uncomplicated outlook, there has been a sizable debate regarding the precise formula that ought to be employed in determining the ratio, for this reason, the results varied in different analytical studies. The debates, which centered around the use of gross income, net income, equivalent income, equivalent-after-tax income, the addition of housing allowance to rent or to net income, the use of actual expenditure and expected expenditure, etc., have led to the creation of different types of this ratio. (Yates et al., 2007). Consequently, many variations of this ratio have been adopted by different countries in their application of this approach by taking into consideration the prevailing housing subsidy or social housing benefit systems (Ndubueze, 2009).
Residual approach
The non-shelter first approach, on the other hand, is based on the assumption that other expenditures have the first claim on the household budget, with housing costs met from the remainder. The development of this approach is based on the ground that housing cost has the strongest significant and inflexible demand on household income due to the distinct nature of housing as a necessity. In other words, non-housing expenses are constrained by the amount of income that is left after deciding to pay for housing (Stone, 2006b). This indicates that a household housing affordability problem is a result of its inability to meet the non-housing needs at some fundamental degree of adequacy after procuring housing. The correct indicator of the association between the cost of housing and income is thus the variation that exists between the two factors, that is, the residual income left after purchasing housing-instead of the ratio (Stone, 2006b; Stone et al., 2011). This implies that a large family would have to spend a considerably greater proportion of its income on non-shelter requirements than the small family to obtain a comparable quality of life. Consequently, a large household will likely spend less of its income in meeting the cost of housing than a small family with equal earnings.
The relevance of the conceptual framework in this study cannot be over-emphasized. This is because it formed the basis for the choice of method used in measuring housing affordability of the various income groups in Abuja.
Methodology
Data used in this study were collected from both secondary and primary sources. Data from secondary sources, which include federal public salary structure, the cost of sale of public housing units and the schedule of housing loans, were obtained from official records in Nigeria. Primary data on the determinants of housing affordability for low, medium, and high-income groups were collected through the use of a questionnaire. The sample size of 494 household heads was determined using Williams (1978) formulas from the sample frame of household heads of 1,302 Federal Government-owned housing units (owner-occupier apartments, bungalows detached, and semi-detached housing units) built for public servants in Garki, Wuse and Mabushi districts of Abuja. The low-cost houses were sold to the highest bidder between 2004 and 2006. The household heads were either the owner-occupiers or renters of the houses.
A stratified sampling technique was employed to select the household heads that were sampled in the study. The Wuse, Garki and Mabushi districts where the public housing was located were stratified into 7, 11, and 2 strata respectively based on the existing zones that make-up each of the districts. Afterward, 264 flats were randomly selected from a total of 608 blocks of flats having 8 flats of 1, 2, and 3 bedrooms and above from the 7 zones that make-up Wuse district. For Garriki district, 152 flats were randomly selected from a total of 424 blocks of flats of the 11 districts that make-up Garriki district. For the Mabushi district, 78 flats were randomly selected from a total of 270 blocks of flats of the 2 districts that make up the district. The number of flats chosen in each district was proportional to the total flat population. Overall, 494 flats were randomly selected from a total of 1,302 number blocks of flats in the three districts. The household heads of the selected flats were then sampled. Out of a total of 494 copies of a questionnaire that were administered, 455 copies representing 92.1% were returned. The housing cost approach (i.e, house price-to-income ratio) method was adopted in measuring housing affordability of the renters of Federal Government owner-occupier houses in Abuja. This is due to its simplicity, comprehensibility, availability of required data and amenability to spatial and trend comparative housing studies.
The principal component analysis (PCA) was used to determine factors that cause the unaffordable public housing markets with respect to the income of low, medium, and high-income households in Abuja. This technique transforms a possible set of observations of correlated variables into a set of values of variables called principal components.
The formula of PCA is given as:

Where:
W1–W11 = factor weights
XLC = Land use charges/property tax (original variable)
XPI = Percentage of income saved monthly (original variable)
XIR = Interest rate (original variable)
XNB = Number of bedrooms (original variable)
XPIH = Percentage of income spent on housing (original variable)
XHZ = Household size (original variable)
XPIN = Percentage of income spent on non-housing costs (original variable)
XCL = Cost of Land (original variable)
XIN = Income (original variable)
XCI = Cost of infrastructure (original variable)
XBC = Building costs (original variable)
Analysis of Data
Measurement of Public Housing Affordability
The 30% house price-to-income ratio was used to measure public housing affordability in this study (see Tables 1–4). The capacity to afford public housing by the three different income groups was determined by calculating 30% of the gross annual income used for mortgage repayment for each income groups and then multiplying the value by 15 years, which is the period required for the payment of the mortgage for the sale of houses by the Federal Government. The capacity to afford public housing was, therefore, compared with the official costs of the houses to determine their affordability by the respective income groups.
Analysis of Harmonized Public Service Salary Structure (HAPSS), 2000 and Housing Affordability.
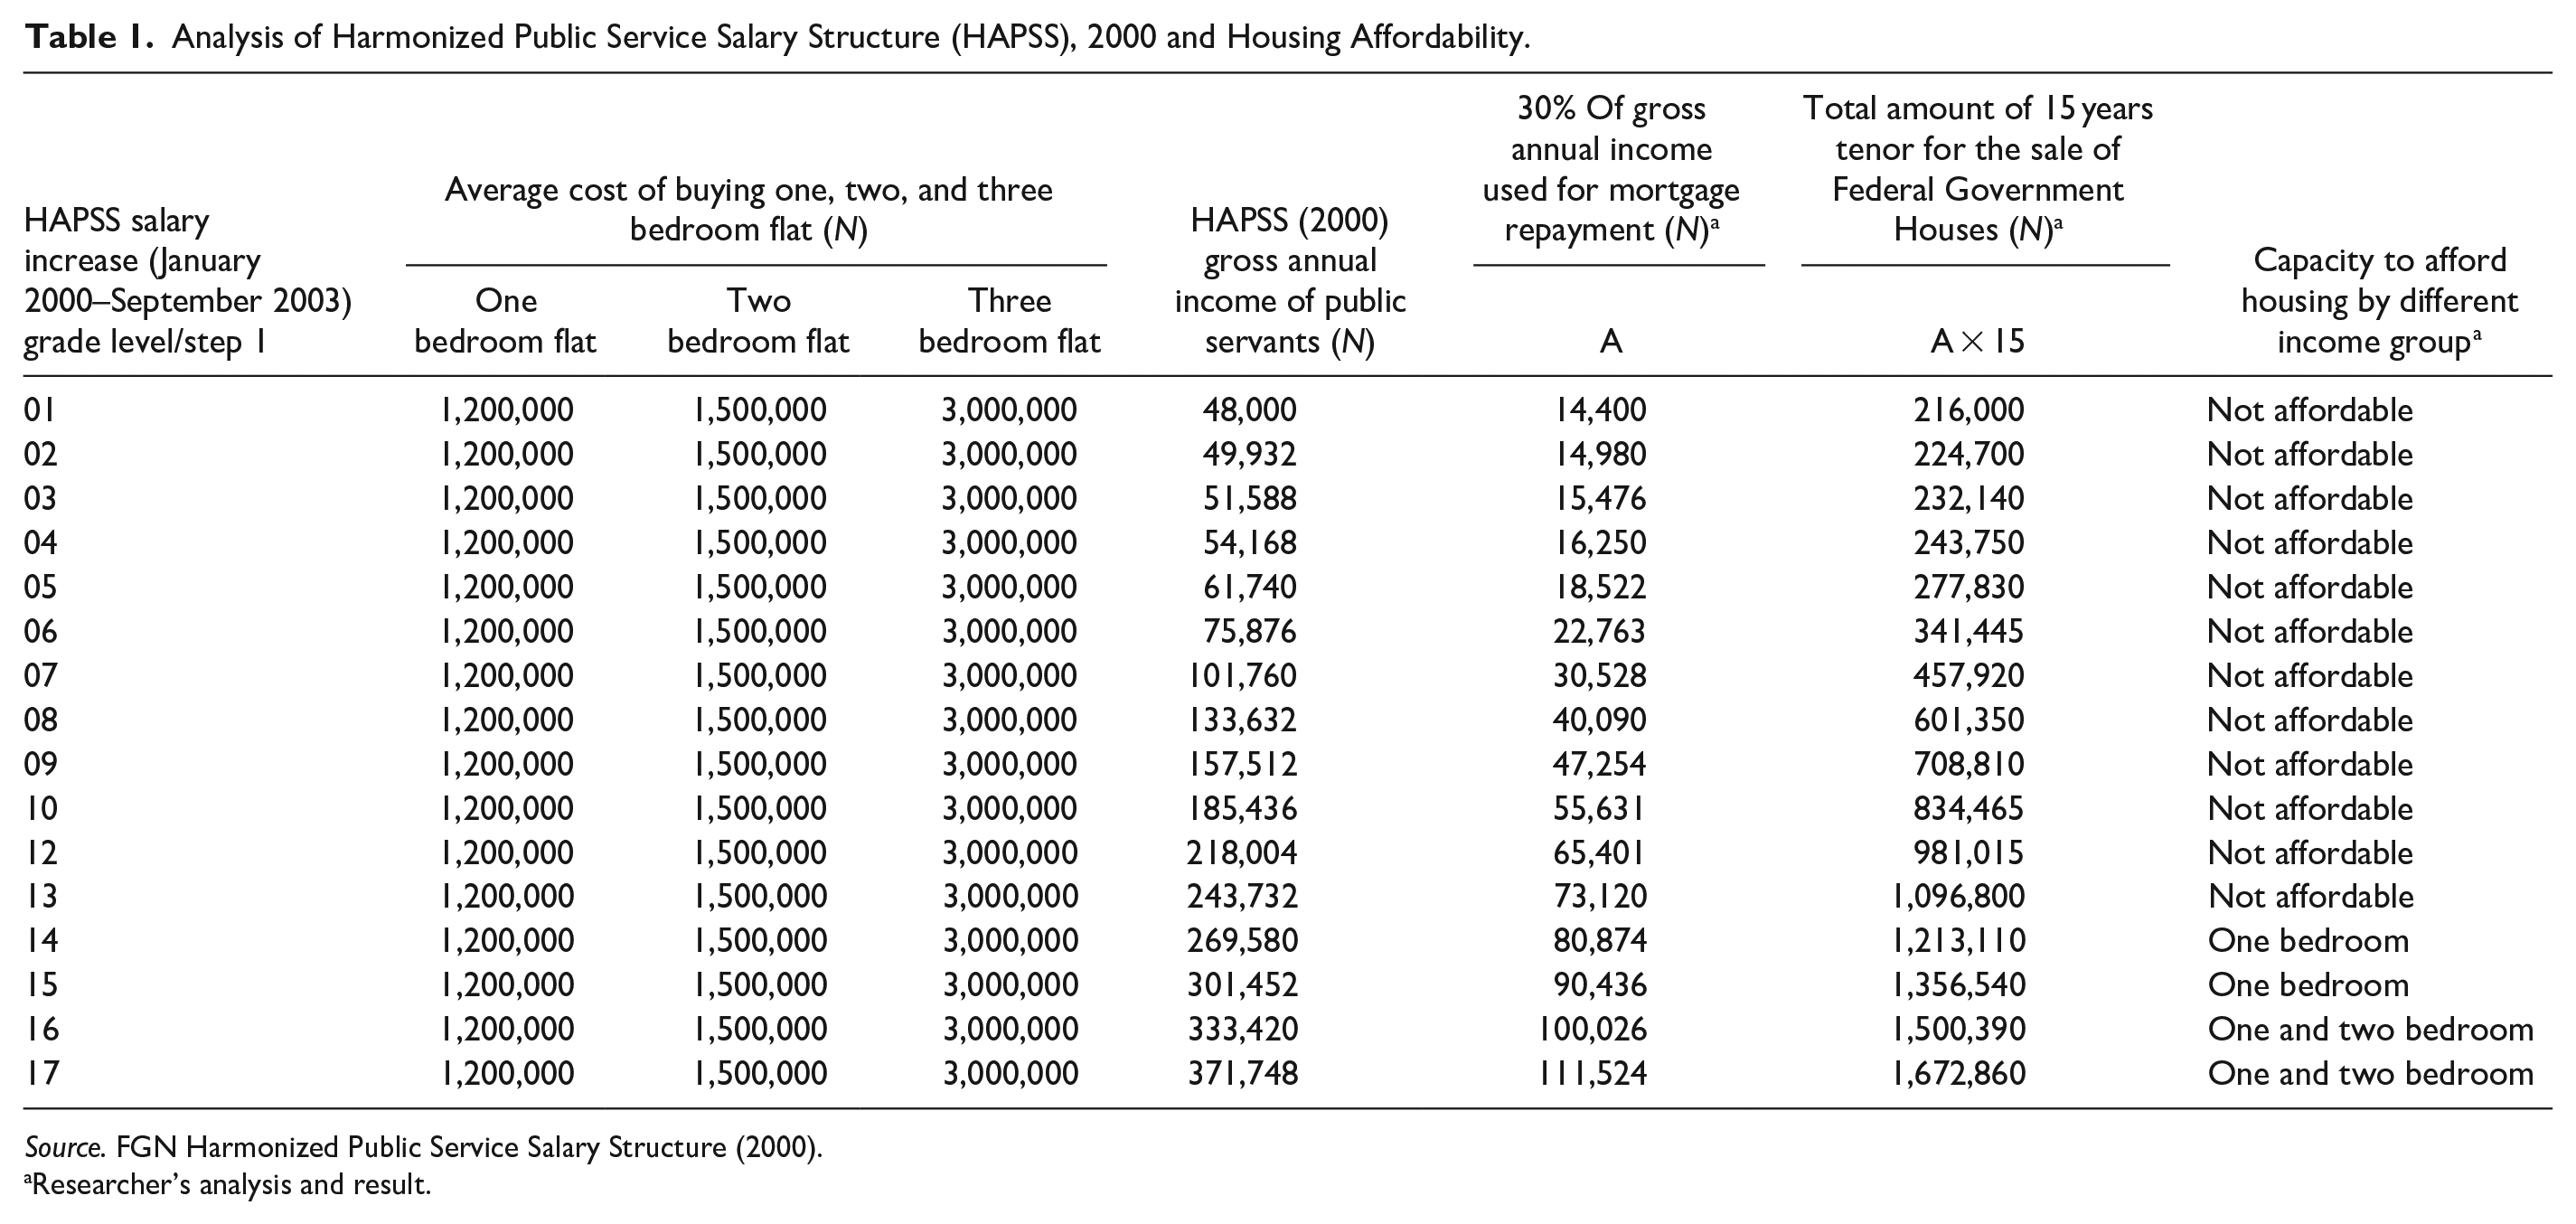
Source. FGN Harmonized Public Service Salary Structure (2000).
Researcher’s analysis and result.
Analysis of Harmonized Public Service Salary Structure (HAPSS), 2003 and Housing Affordability.
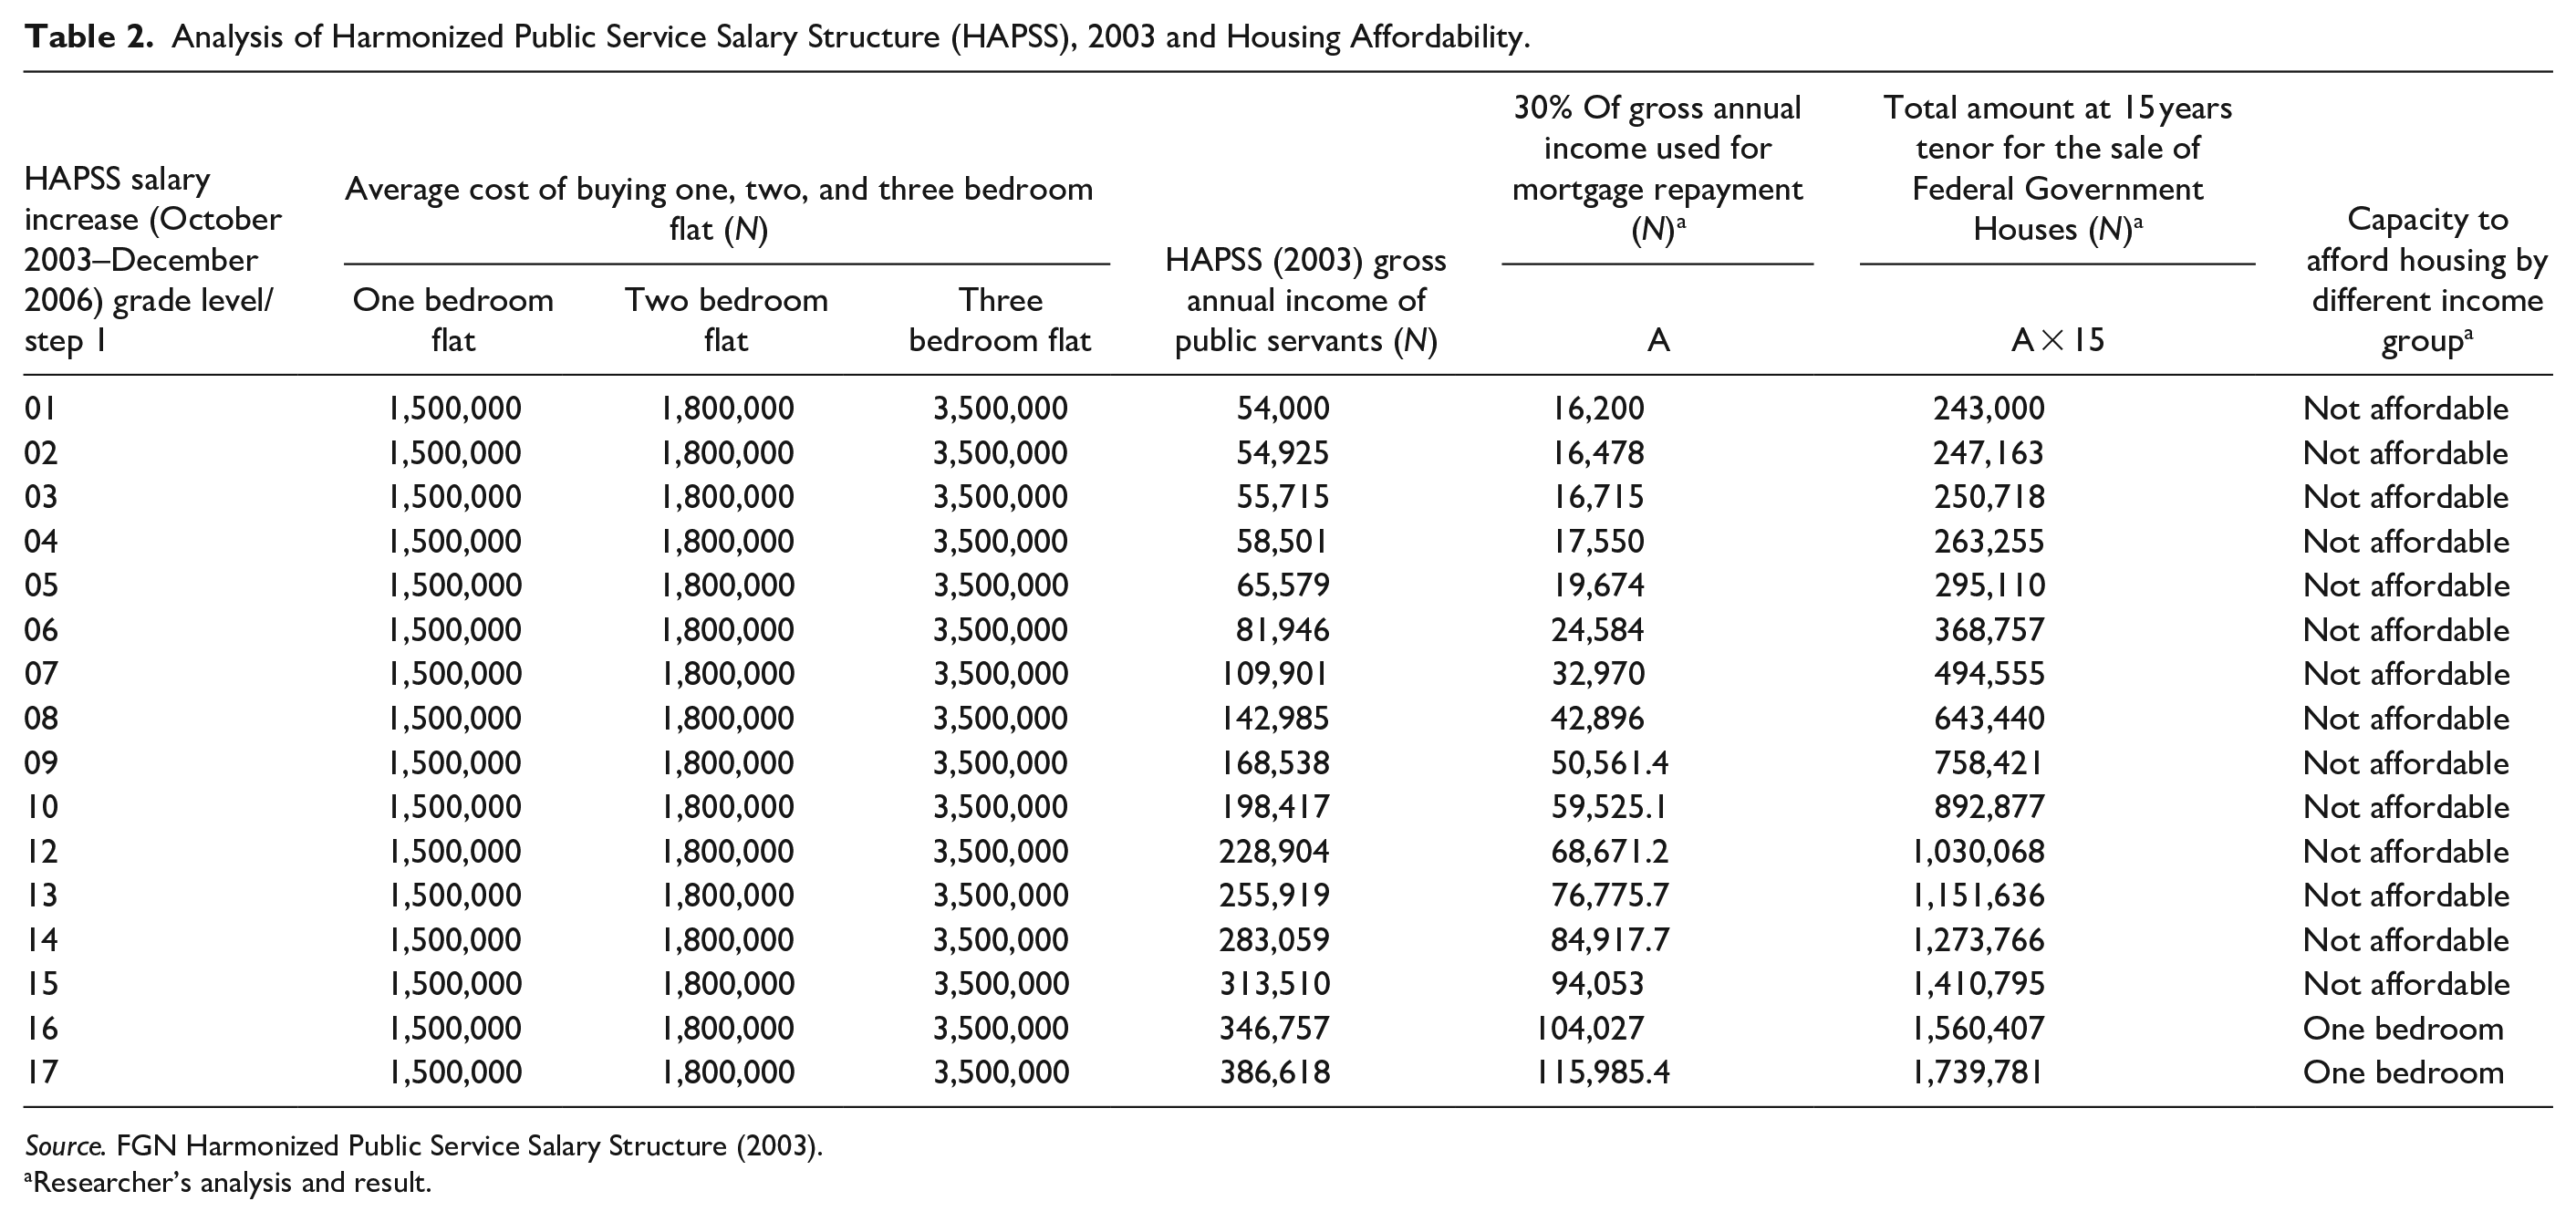
Source. FGN Harmonized Public Service Salary Structure (2003).
Researcher’s analysis and result.
Analysis of the Consolidated Public Service Salary Structure (CONPSS), 2007 and Housing Affordability.

Source. FGN CONPSS (2007) and Guide to Schedule of Housing Loan (2007).
Researcher’s analysis and result.
Analysis of the Consolidated Public Service Salary Structure (CONPSS), 2010 and Housing Affordability.
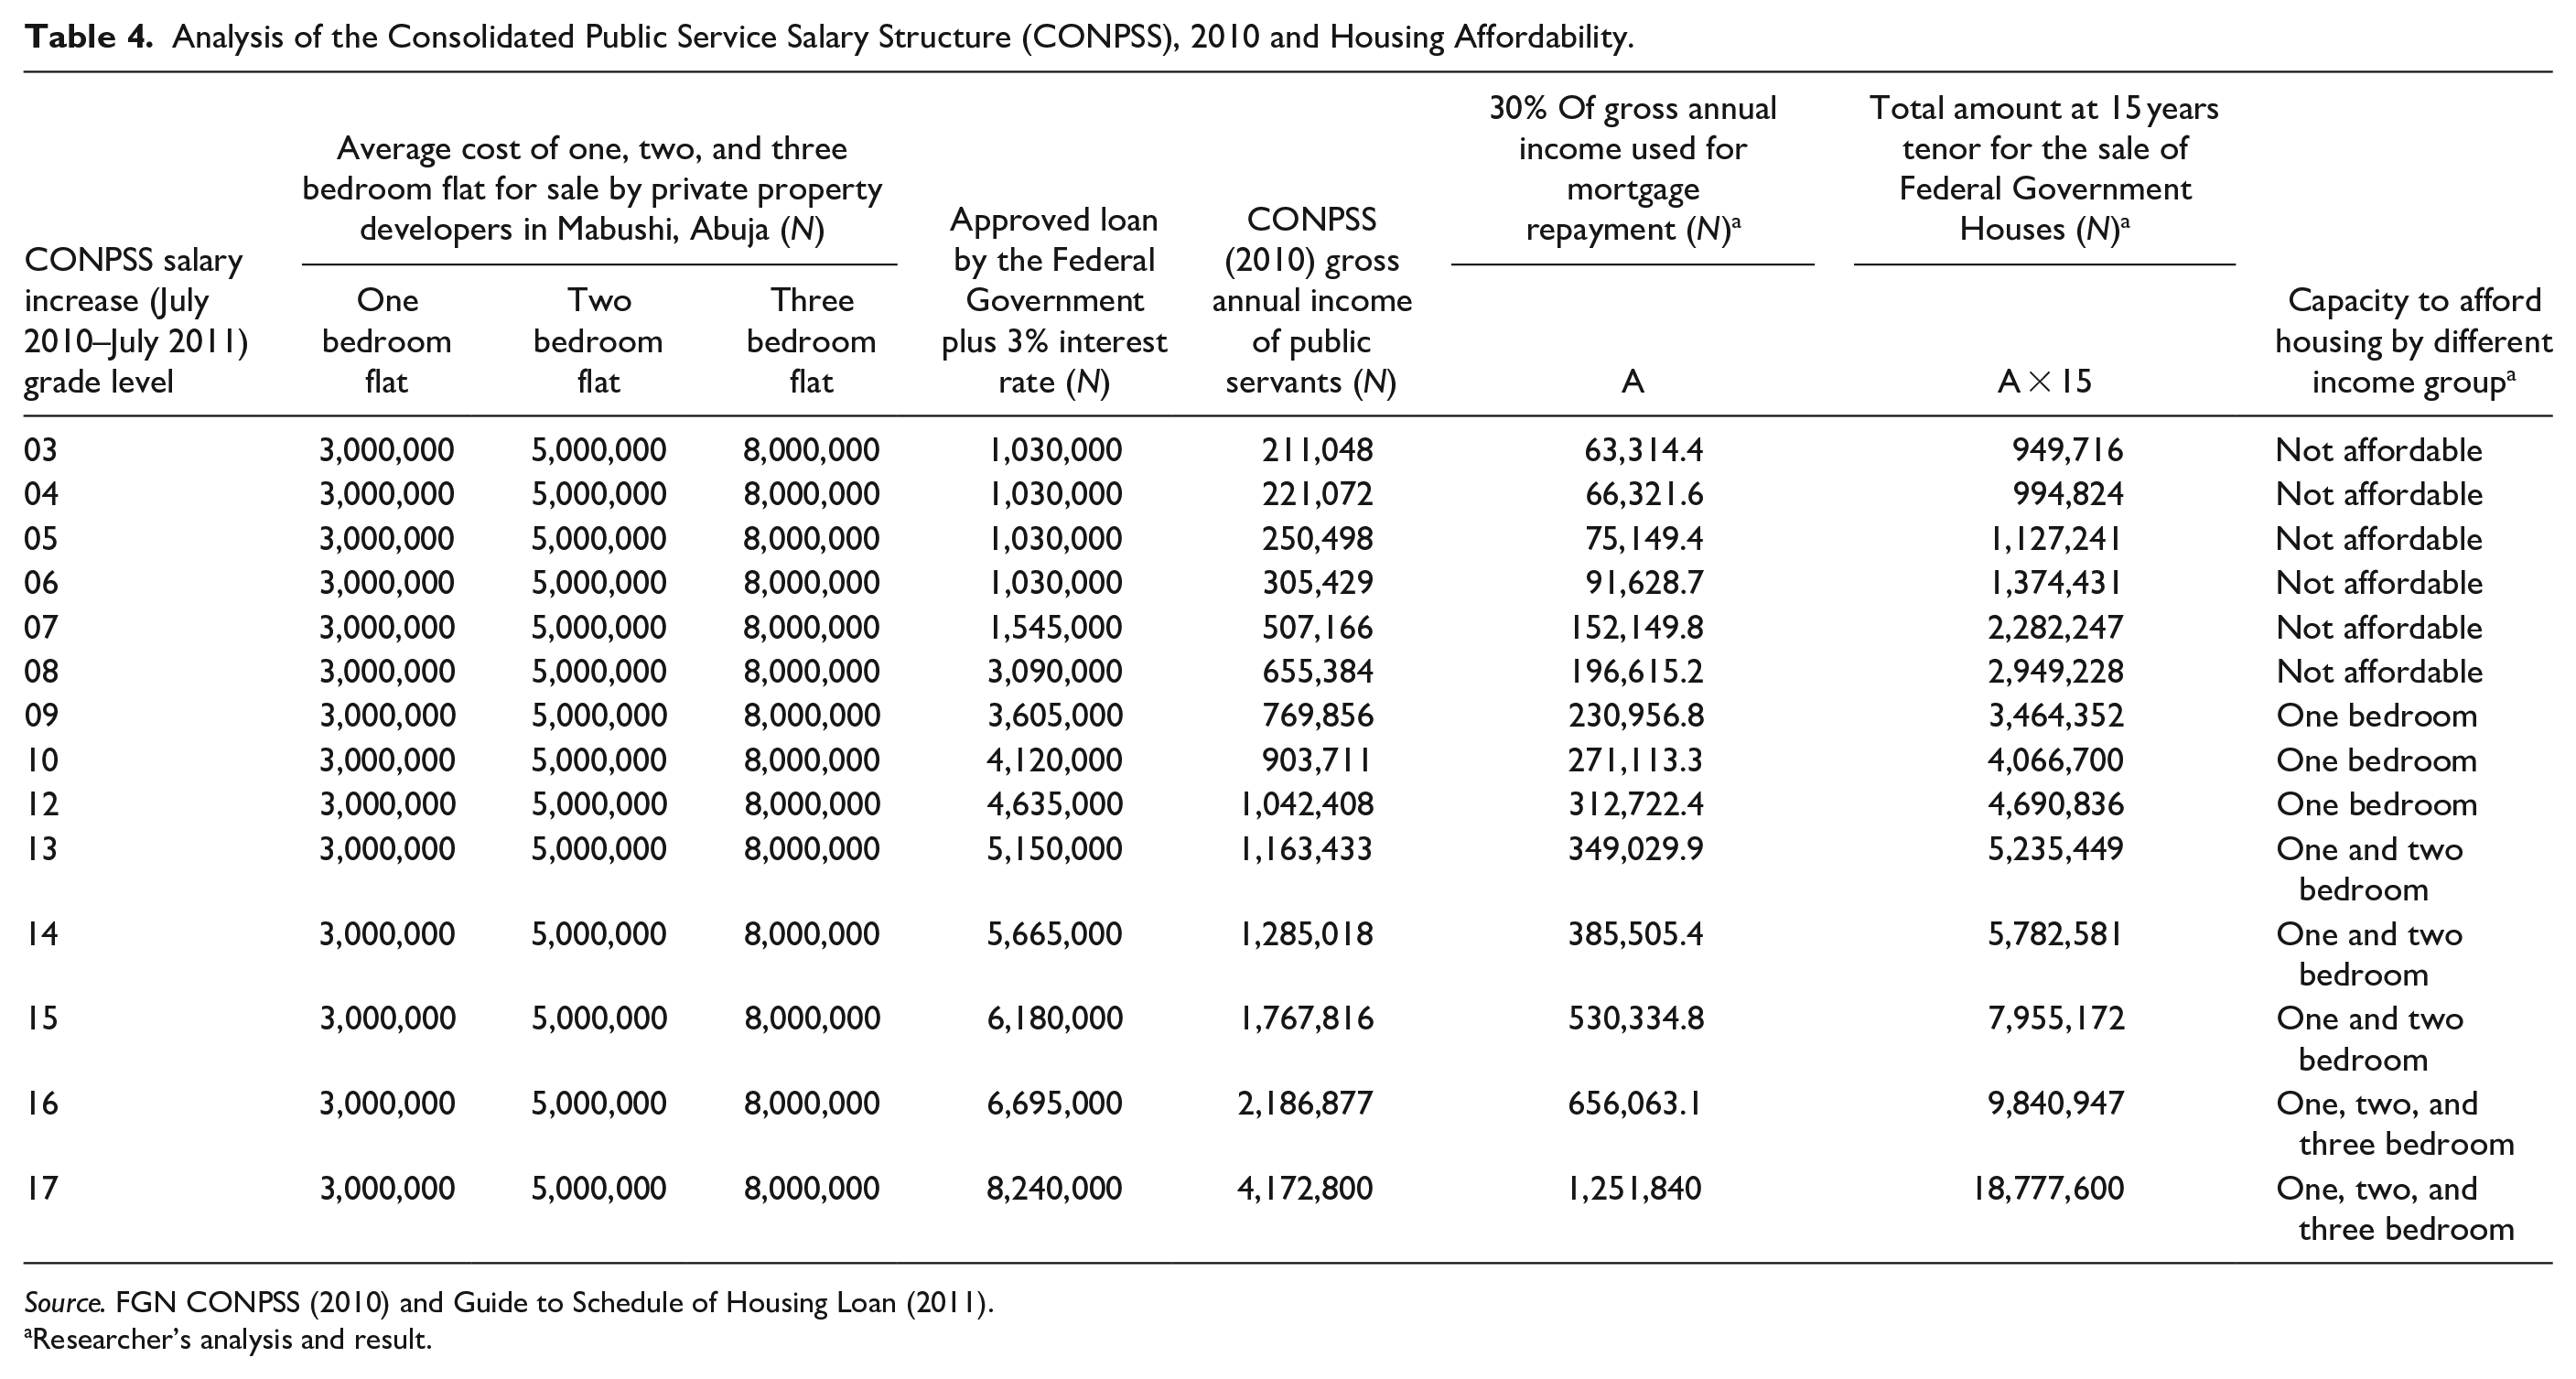
Source. FGN CONPSS (2010) and Guide to Schedule of Housing Loan (2011).
Researcher’s analysis and result.
Table 1 shows the Harmonized Public Service Salary Structure (HAPSS) for 2000 and the affordability levels of low, medium and high-income earners for 1, 2, and 3 bedroom flats at the cost of 1.2, 1.5, and 3 million naira, respectively. Revelation from the analysis indicates that the low and medium-income earners (GL 01–12) were not able to buy or compete in the housing market. Officers on Salary Grade Levels 14 and 15 were able to afford 1- bedroom flat while those on Salary Grade Levels 16 and 17 were able to afford 2—bedroom flat within 15 years in Wuse district of Abuja. No officer from (GL.01–17) was able to afford a 3—bedroom flat at the cost of 3 million naira. Remarkably, due to poor salary packages, low and medium-income residents (GL. 01–13) were not empowered financially with the capacity to afford a house.
Table 2 shows the Federal Government of Nigeria Harmonized Public Service Salary Structure for 2003. The analysis reveals that by the year 2003, only public servants on grade levels 16 and 17 were able to buy 1 bedroom flat at the cost of 1.5 million naira. Also, it reveals that low and medium-income residents could not buy 1, 2, and 3—bedroom flats at the cost of 1.5, 1.8, and 3.5 million naira, respectively within a tenor of 15 years. The analysis reveals that low and medium-income residents, as well as the low echelon of high-income groups (i.e., the equivalent of salary grade level 01–06, 07–12, and 13–15 in Government employment respectively), were disadvantaged from buying houses in Abuja.
Table 3 reveals that CONPSS (2007) salary increase did not empower the majority of low and medium-income residents (i.e., the equivalent of salary grade level 01–06 and 07–12 in Government employment) to afford 1—bedroom flat at the cost of 3 million naira within a time frame of 15 years. Officers on grade levels 12 to 14 were able to buy 1 bedroom flat. Those on grade level 15 were able to buy 2 bedrooms flat at the cost of 4.5 million naira whereas officers on grade levels 16 and 17 were able to purchase 3 bedrooms flat at the cost of 6 million naira within a tenor of 15 years. This indicates that most low and medium-income residents in Abuja (GL.01–10) face relatively depressed purchasing power as far as savings and homeownership are concerned. This is a fact because the majority of the residents in Garki, Wuse, and Mabushi districts are officers on grade level 13 and above.
Table 4 the Consolidated Public Service Salary Structure (2010) salary increase could not empower low-income residents (GL.01–06) and the majority of medium-income earners (GL. 07–12) to afford 1 bedroom flat at the cost of 3 million naira. Officers on salary grade levels 9 to 12 were able to afford 1—bedroom flat, whereas officers on salary grade levels 13 to 15 afforded 2—bedroom flat at the cost of 5 million naira. However, an officer on grade levels 16 and 17 were able to buy a 3—bedroom flat at the cost of 8 million naira within 15 years. In the light of this revelation, this may be the reason officers on grade levels 01 to 08 were not able to participate in the housing market.
Determinants of the Unaffordable Public Housing Market for Large Income diversity Groups
Low-income group
The results of the PCA (see Table 5) collapsed the identified factors that cause an unaffordable housing market for low-income residents of Abuja into three components which accounted for 71.3% of the variability in the original 11 variables. The first component loaded significantly on four factors which are (in descending order) the percentage of income spent on housing costs (0.858), household size (0.762), percentage of income spent on non-housing costs (.755), and the number of bedrooms (0.596) with an eigenvalue of 3.664. It accounted for 33.3% of the factors that cause an unaffordable housing market for low-income earners. Therefore component 1 was an index for measuring housing costs as a distinct factor that cause an unaffordable housing market for low-income earners. The defining variable of the component was the percentage of income spent on housing costs with a factor loading of 0.858.
Determinants of the Unaffordable Public Housing Market for Low Income Group.
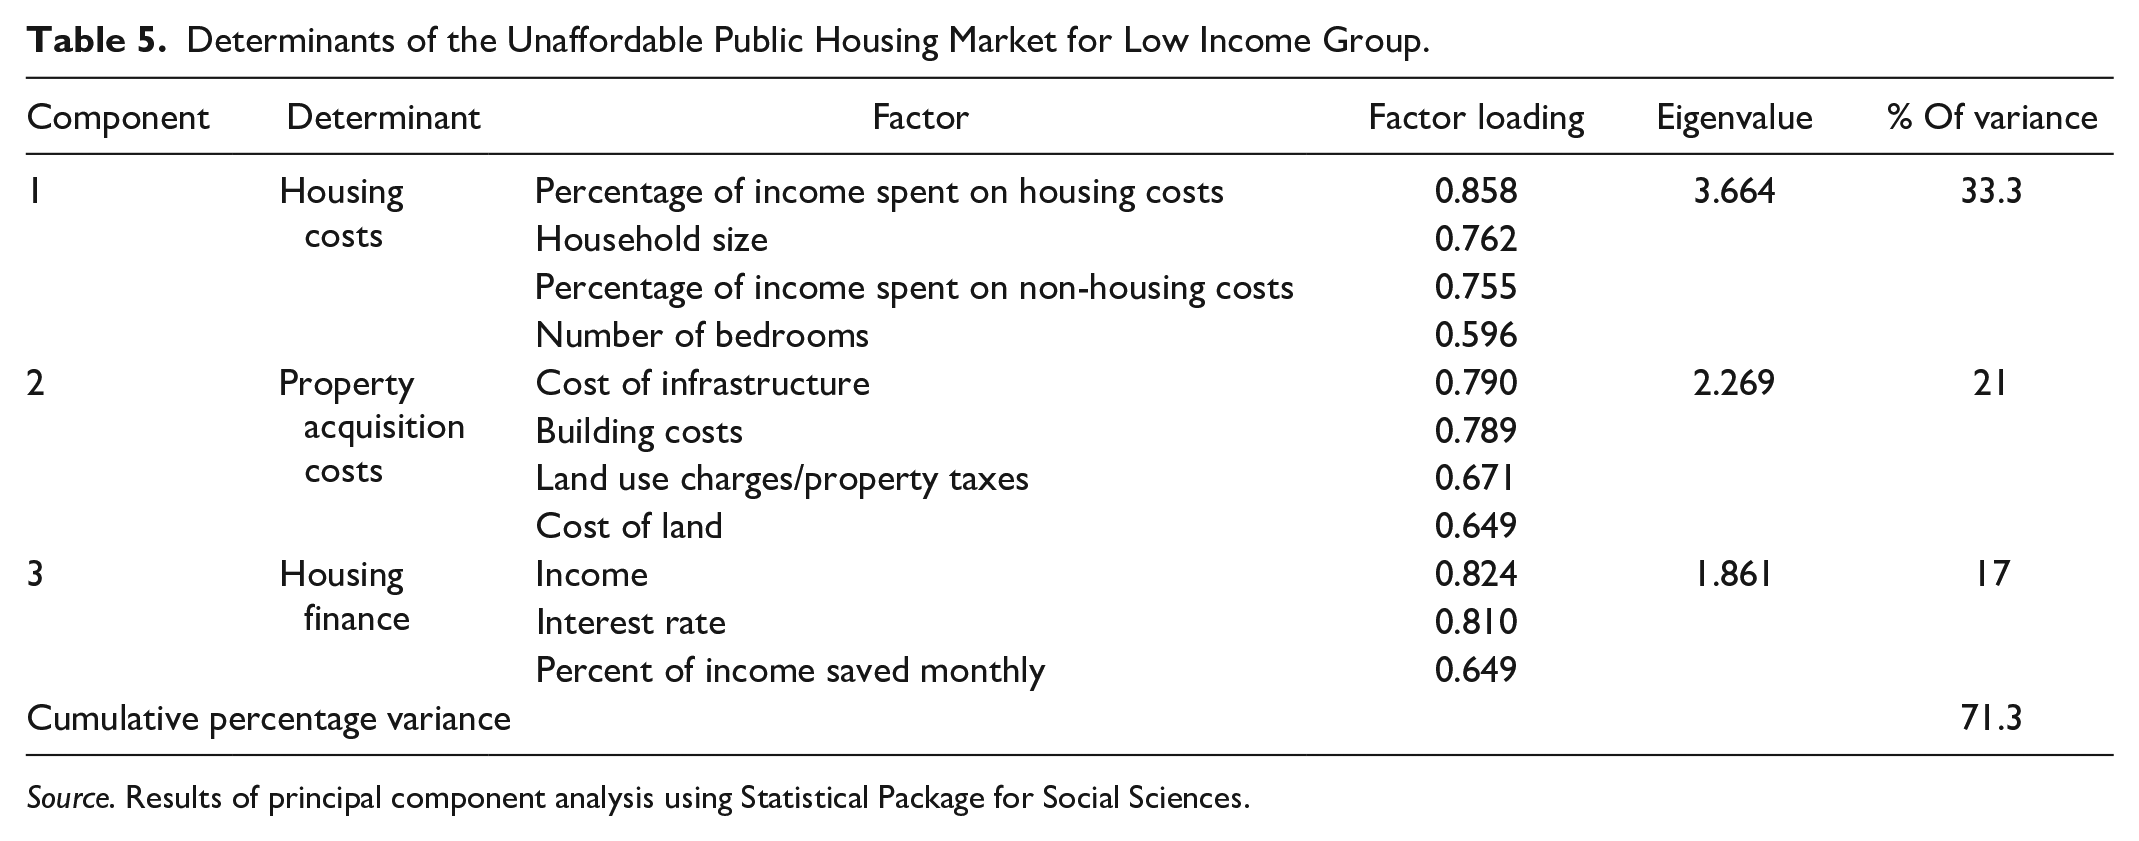
Source. Results of principal component analysis using Statistical Package for Social Sciences.
The second component was significant and loaded on the cost of infrastructure (0.790), building costs (0.789), land use charges/property taxes (0.671), and cost of land (0.649) with an eigenvalue of 2.269. It explained 21% of the determinants of the unaffordable housing market for low-income residents. Hence, component 2 was an index for measuring property acquisition costs as a distinct factor that accounts for the unaffordable housing market for low-income earners. The defining variable of the component was the cost of infrastructure with a factor loading of 0.790.
The third component loaded significantly on income (0.824), interest rate (0.810), and percentage of income saved monthly (0.649) with an eigenvalue of 1.861. It explained 17% of the factors that cause the unaffordable housing market for low-income residents. Hence component 3 was an index of measuring housing finance as a distinct factor that explains the cause of the unaffordable housing market for low-income earners. The defining variable of the component was income with a factor loading of 0.824. Overall, the key factors that determine the cause of the unaffordable housing market for low-income residents in Abuja, in descending, order are housing costs, property acquisition costs, and housing finance.
Medium income group
The results (see Table 6) show that the four components which cause the unaffordable housing market for medium-income residents accounted for 57.9% of the variability in the original 11 variables. The first component loaded significantly on the factors of land use charges/property taxes (0.767), cost of land (0.676), interest rate (0.660), percentage of income saved monthly (0.646), and income (0.505) with an eigenvalue of 2.580. It accounted for 23.3% of the factors that cause the unaffordable housing market for the medium income earners. Therefore component 1 was an index for measuring land and finance costs as a distinct factor that cause an unaffordable housing market for medium-income earners. The defining variable of the component was land use charges/property taxes with a factor loading of 0.767.
Determinants of the Unaffordable Public Housing Market for Medium Income Group.

Source. Results of principal component analysis using Statistical Package for Social Sciences.
The second component was significantly loaded on the percentage of income spent on housing costs (0.809), and percentage of income spent on non-housing costs (0.708) with an eigenvalue of 1.684. It explained 15% of the factors that account for the unaffordable housing market for medium-income earners. Consequently, component 2 was an index for measuring housing costs as a distinct factor that explains the cause of unaffordable housing market for medium-income earners. The defining variable of the component was the percentage of income spent on housing costs with a factor loading of 0.809.
The third component was significantly loaded on household size (0.790) and the number of bedrooms (0.735), with an eigenvalue of 1.091. It accounted for 9.920% of the factors that determine the cause of the unaffordable housing market for medium income earners. Hence component 3 was an index for measuring family shelter requirements as a distinct factor that accounts for the unaffordable housing market for medium-income earners. The defining variable of the component was household size with a factor loading of 0.790.
The fourth component loaded significantly on the cost of infrastructure (0.766) and building costs (0.653) with an eigenvalue of 1.069. It explained 9.714% of the factors that cause the unaffordable housing market for medium-income earners. Therefore component 4 was an index for measuring infrastructure and building costs as a distinct factor that determines the cause of the unaffordable housing market for medium-income earners. The defining variable of the component was the cost of infrastructure with a factor loading of 0.766. Overall, the factors that determined the cause of the unaffordable housing market for medium-income earners, in descending order, are land and finance costs, housing costs, family shelter requirements, and infrastructure and building costs.
High-income group
The results (see Table 7) showed that four components with a cumulative percentage of 66, accounted for variability in the original 11 variables that determined the cause of the unaffordable housing market for the high-income earners. The first component was significantly loaded on land use charges/property taxes (0.796), percentage of income saved monthly (0.779), and interest rate (0.744) with an eigenvalue of 2.612. It accounted for 24.5% of the factors that cause the unaffordable housing market for the high-income earners. Hence component 1 was an index for measuring property charges as a distinct factor that determines the cause of unaffordable public housing market for high-income earners. The defining variable of the component was land use charges/property taxes with a factor loading of 0.796.
Determinants of the Unaffordable Public Housing Market for High Income Group.

Source. Results of principal component analysis using Statistical Package for Social Sciences.
The second component loaded significantly on the number of bedrooms (0.790), percentage of income spent on housing costs (0.721), and household size (0.646) with an eigenvalue of 1.897. It accounted for 17.2% of the factors that cause the unaffordable housing market for the high-income group. Therefore, component 2 was an index for measuring family and housing costs as a distinct factor that cause the unaffordable housing market for high-income earners. The defining variable of the component was the number of bedrooms with a factor loading of 0.790.
The third component loaded significantly on the percentage of income spent on non-housing costs (0.791), cost of land (0.656), and income (0.587) with an eigenvalue of 1.567. It accounted for 14.25% of factors that determine the cause of unaffordable housing market of the high-income earners. Thus, component 3 was an index for measuring land and non-housing expenditures as a distinct factor that cause the unaffordable housing market for high-income earners. The defining variable of the component was the percentage of income spent on non-housing costs with a factor loading of 0.791.
The fourth component also loaded significantly on the cost of infrastructure (0.843) and building cost (0.841) with an eigenvalue of 1.109. It accounted for 10% of the factors that cause the unaffordable housing market for the high-income earners. Component 4 was, therefore, an index of measuring infrastructure and building costs as a distinct factor that determines the cause of unaffordable housing market for high-income earners. The defining variable of the component was the cost of infrastructure with a factor loading of 0.843. Overall, the key factors that cause the unaffordable housing market for high-income earners, in descending order, are property charges; family and housing costs; land and non-housing expenditures; and infrastructure and building costs.
Discussion
The measure of public housing affordability using the 30% house price-to-income ratio in Tables 1 to 4 indicates that low, medium and lower-upper income groups were not able to afford the public houses. Rather, it was the upper higher income, which constitutes less than one-third of the population that was able to afford the housing. This is despite the fact that the public housing estates were designed and built to accommodate the low and medium-income groups. The low and medium-income groups could not afford the public housing because the prices at which those houses were sold to the public (by the government) were beyond their income. This is an indication that income is a very strong determinant of public housing affordability. This supports the argument that the housing cost approach (i.e. house price-to-income ratio), otherwise known as the rule-of-thumb, is the best measure of housing affordability. Moreover, this outcome implies that more than two-thirds of the population cannot afford public housing in Nigeria. This is an indication that the public housing program is not affordable to the target population. This portends a serious setback to the nation’s housing policy which aims to provide an affordable home for all Nigerians. This may be the reason why most low and medium-income groups spend a very high proportion of their income to live in expensive inner-city areas whereas others live in cheaper outer suburbs at longer distances to their places of work. This also accounts for the several vacant houses, unoccupied housing estates and unacceptable squatter settlements in many Nigerian cities. It places some households in danger of not having the ability to maintain their occupancy, thereby giving rise to an increased possibility of homelessness.
The principal component analysis (see Table 5) showed that the factors that determine the cause of the unaffordable housing market for low-income residents in Abuja, in descending, order are housing costs, property acquisition costs, and housing finance. The three afore-mentioned factors accounted for 71.3% of the cause of the unaffordable housing market for the low-income group. A breakdown shows that housing costs had the highest effect (33.3%). It was followed in descending order by property acquisition costs (21%), and housing finance (17%). This implies that the three factors made the affordability of public housing beyond the income of low-income households. This indicates that the factors determine whether public housing is affordable to the low-income group based on their income. Consequently, for the low-income group to participate in the public housing market, their income should be able to afford the housing cost, property acquisition cost and housing finance mortgage condition. Also, it is an indication that the three factors have a very strong income effect on the public housing affordability of the low-income group. The magnitude of the effect on the income determines the extent to which the low-income group could afford public housing. Therefore, the affordability of public housing based on the income of this group is dependent on the three factors. This suggests that the three factors are germane in the provision of affordable housing to low income.
The factors responsible for the unaffordable housing market for the medium-income earners (see Table), in descending order, are land and finance costs (23.3%), housing costs (15%), family shelter requirements (9.92%), and infrastructure and building costs (9.714%) (see also Table 6). The aforementioned factors influenced the unaffordable housing market for the medium income by 57.9%. This implies that the four factors made public housing affordability beyond the income of middle-income households. It hindered the medium-income households from participating in the public housing market during the monetization exercise of the Government. This also indicates that the four factors have a strong income effect on the housing affordability for the medium income group. Consequently, their income should be able to support the aforementioned factors for the group to participate in the public housing market. This is an indication that they are the important factors to be considered in the provision of affordable housing for the medium-income group. This is because the affordability of public housing based on the income of this group is dependent on the four factors.
The four factors that influence the unaffordable housing market for high-income earners (see Table 7), in descending order, are property charges (24.5%); family and housing costs (17.2%); land and non-housing expenditures (14.25%); and infrastructure and building costs(10%). The aforementioned factors cumulatively accounted for 66% of the cause of unaffordable housing market for the lower-high income group. This implies that the four factors made the prices of public housing beyond the reach of the income of lower-high income households. This also implies that the affordability of public housing for this group based on their income is dependent on the four factors. The four factors have a strong income effect on housing affordability and therefore should be given due consideration in the provision of affordable housing for this particular income group.
Overall, the cause of the unaffordable public housing for the low, medium, and high-income groups differs. It is an indication that the affordability problem of many public housing programs in the country may have been because they are not tailored to a targeted population income level and the household’s ability to pay. It also indicates that the problem was exacerbated because public housing affordability is based on market forces. Furthermore, a comparative analysis of the cause of unaffordable housing market indicates that factors, except for housing costs and infrastructure and building costs, differed among the three income groups. However, housing cost was common for the three income groups, whereas infrastructure and building costs were peculiar to only medium and high-income groups. This suggests that poor income was the reason low and medium earners could not participate in the purchase of public housing under the monetization policy of the federal government of Nigeria.
Recommendations
This study identified three contextual bases for considering housing affordability issues across the diverse income groups. First, income-to-income level bases for measuring housing affordability should be adopted for public housing provision. This implies that public housing should be provided to low, medium, and high-income groups based on affordability within the context of their specific income level. Second, the market price of public housing should be relative to the income level of each of the diverse income groups. The income inequality and ability to pay across the diverse income groups should be a major determinant of the market price of affordable housing. Third, there should be a redefinition of affordability to reflect the determinants of the unaffordable housing market for each of the diverse income groups.
The policymakers should therefore consider the three aforementioned contextual bases in the formulation of housing affordability programs and policies. This will result in the provision of affordable public housing for the respective diverse income groups. The government should also play a significant role in decreasing the cost of construction by formulating policies that target the provision of fiscal incentives, appropriate institutional framework and accessibility to land to encourage low-income housing development. There is a need for the government to quickly review upward the minimum wage of Nigerian workers in line with the current nation’s high inflation rate. This will facilitate the accessibility of the diverse income groups, especially the medium and low-income earners to affordable housing.
Conclusion
This study determined factors that influence housing affordability for large income diversity groups in Abuja which is Nigeria’s new-town capital city. The results showed that public housing was not affordable to low and medium-income earners. Moreover, factors that determine unaffordable housing differ among the three diverse income groups. Unaffordable housing for the low-income group is caused by housing cost, property acquisition cost, and housing finance. For the medium-income group, they are land and finance costs, housing costs, family shelter requirements and infrastructure and building. For the high-income group, the factors are property charge, family, and housing costs, land and non-housing and infrastructure and building costs. The outcome of this study provides a contextual framework for considering housing affordability.
Footnotes
Declaration of Conflicting Interests
The author(s) declared no potential conflicts of interest with respect to the research, authorship, and/or publication of this article.
Funding
The author(s) received no financial support for the research, authorship, and/or publication of this article.